BENCHMARKING AND VALIDATION OF MOCUP K. Wang*, T-P Lou, E. Greenspan and J. Vujic Department of Nuclear Engineering University of California Berkeley, CA 94720
[email protected]
ABSTRACT The purpose of this work was to benchmark the MOCUP code for burnup analysis. Two welldocumented benchmarks were used to validate MOCUP and the way we are applying it. One benchmark consists of three PWR pin-cell burnup problems.. The other benchmark is a fast reactor (burner) burnup problem. From the comparisons of our MOCUP results with those obtained from measurement and/or other computer codes, it has been concluded that: (a) with few exceptions, the MOCUP results of isotopic compositions fall within the range of those calculated by different codes, (b) MOCUP results for the actinide concentration are in agreement with the measurement values to within 11%, and (c) the MOCUP predictions of reactivity change with burnup are in good agreement with the reported values. For example, for most of the actinides the deviations in concentration are less than 5%, and for all fission products studied, the deviation of MOCUP results from the measured values is less than 10% (an exception is 149Sm).
1. INTRODUCTION The utility program MOCUP1 developed by Idaho National Engineering and Environment Laboratory is a linkage code that couples MCNP2, a generalized-geometry Monte Carlo (MC) transport code, and ORIGEN23, an isotope generation and depletion code. MOCUP is extremely useful for analysts who perform isotope production, material transformation, and depletion and isotope analyses on complex, non-lattice geometric configurations. The main advantage of MC technique is that more accurate results for reactivity calculations and hence for burnup can be obtained due to realistic modeling of complex geometries and the use of continuous-energy cross sections. Due to lack of funding, MOCUP was not well documented and not well benchmarked. Before using MOCUP in our routine research work, we have chosen two well-documented benchmarks to validate MOCUP and the way we are applying it. The MOCUP results were not included in the documented analysis4, 5 of any of these benchmark problems. *
The permanent address is: Department of Engineering Physics, Tsinghua University, Beijing, 100084, P.R.CHINA 1
The first benchmark problem is from the OECD/NEA Burnup Credit Calculational Criticality Benchmark Phase I-B Results4, which was proposed to provide a comparison of the ability of different code systems and data libraries to perform depletion analysis for the prediction of spent fuel isotopic concentrations and included results representing 21 different sets of calculations submitted by 16 different organizations worldwide and were based on a limited set of nuclides determined to have the most important effect on the neutron multiplication factor of light-waterreactor spent fuel. This benchmark modeled a simple fuel pin-cell which was burned for four complete cycles including burn time and subsequent down time, and consisted of three cases corresponding to fuel samples taken from three different axial locations in the reference practical fuel pin, each with a different final burnup. The second benchmark problem is from OECD document, Physics of Plutonium Recycling5, which was about a 600 MWe (1500 MWth) oxide burner reactor operating on a 125 EFPD cycle at 80% capacity factor. The reactor core was of a homogeneous layout with two radial enrichment zones and no radial blankets; axially, the core was about one meter high and had no axial blankets. The fuel was comprised of an annular mixed oxide pin of depleted uranium and multi-recycled LWR plutonium. Six organizations submitted their results obtained from different sets of calculation codes. Section 2 and 3 of this paper, respectively, describe the thermal pin benchmark and the fast reactor benchmark along with our calculation results of MOCUP. Conclusions are made in Section 4.
2. THERMAL PIN BENCHMARKING OF MOCUP 2.1 BENCHMARK SPECIFICATION The purpose of this calculational benchmark problem was to compare nuclide depletion concentrations computed by all participants for a simple pin-cell model.4 The fuel pin-cell description is given in Table I. The fuel sample was burned for four complete cycles; the length of the burn time and subsequent down time for each cycle are given in Table II. This benchmark consists of three cases, each with a different total burnup; the specific power for each cycle and the final burnup are given in Table III for each of the three cases. Table IV lists the initial isotopic concentrations used for the fuel material for all three cases. Table V provides the isotopic composition of the moderator for cycle 1, and the boron concentrations for subsequent cycles should be modified by the cycle-specific relative boron concentrations given in Table II.
2.2 SOME IMPORTANT MOCUP PARAMETERS Time interval of running MCNP. The results presented in Section 2.3 were obtained by running MCNP in the time steps of 60 days. It was also found that the similar accuracy could be obtained by using the longer time steps (a half year) in combination with shorter time steps (up to 10 days) at the beginning of each cycle (after each downtime), in order to account the 135Xe buildup. By
2
using the latter choice of time steps, the accuracy of the 135Cs concentration has been improved. Thus, we adopted the second method for our current research work. Normalization of flux. The flux obtained from MCNP must be normalized with the practical thermal power. Either of the following two ways can be used: a) When the IRF card in ORIGEN input (constant flux depletion mode) is used, the flux multiplier factor (FMT) is calculated by the following equations:
=K
eff
FMT =
×
Tloss − Cutoff − Cnxn Floss × P × 10 6
1.602 × 10 − 13 × K
eff
(1) (2)
×Q
where, - Number of neutrons per fission; Keff - Multiplication factor from MCNP; Tloss Total loss of neutrons from MCNP; Cutoff - Cutoff neutrons from MCNP; Cnxn - Neutrons created by (n, xn) from MCNP; Floss - Neutron loss by fission from MCNP. P - Thermal power (MW); Q - Recoverable energy per fission, 204.5 MeV/fission. This flux normalization method was used in the fast reactor benchmark problem described in Section 3. b) When the IRP card in ORIGEN input (constant power depletion mode) is used, flux can be calculated by ORIGEN as follows:6 φ=
6.242 × 10¹⁸ × P ∑ fi σ if Q i
(3)
i
Q i = 1.29927 × 10 −3 (Z 2 A 0.5 ) + 33.12 (4) 2 f f where, - Neutron flux(n/cm -s); X i - Amount of fissile nuclide i(g-atom); i - Microscopic fission cross section for nuclide i (barn); Qi - Recoverable energy per fission for nuclide i (MeV/fission); Z - Atomic number; A - Atomic mass. This method was used in the thermal benchmark problem described in this section. Length of time step of ORIGEN2.1. The length of 3 days was used as the ORIGEN time step in this thermal benchmark. In general, it should not be longer than 10 days. Otherwise, the calculated errors in the nuclide concentrations for isotopes: Pu, Am and Cm will be too large. The length of 10 days was used in the fast reactor benchmark. Nuclides modeled in MCNP. The following 15 fissionable isotopes were included in the thermal benchmark: 234U, 235U, 236U, 238U, 238Pu, 239Pu, 240Pu, 241Pu, 242Pu, 241Am, 242Am, 243Am, 237Np, 238 Np and 245Cm. In addition, 242Cm, 243Cm, 244Cm and 246Cm were also included in the fast reactor benchmark. The following 28 fission products were included in the thermal benchmark: 95 Mo, 99Tc, 109Ag, 101Ru, 103Ru, 133Cs, 135Cs, 147Sm, 149Sm, 150Sm,151Sm, 152Sm,143Nd, 145Nd,
3
147
Nd, 151Eu, 152Eu, 153Eu, 154Eu, 155Eu, 155Gd, 157Gd, 131Xe, 133Xe, 135Xe, 103Rh, 147Pm and 149Pm. In addition, 141Pr, 105Pd, 108Pd, 129I, 137Cs and 93Zr were also included in the fast reactor benchmark.
2.3 COMPARISONS OF MOCUP RESULTS WITH BENCHMARK VALUES In addition to the parameters described in Section 2.2, the reflective boundary conditions for MCNP and the ORIGEN2 cross section library for PWR with 33 GWd/MTU were used. The depletion of boron in the coolant was considered. Table VI, VII and VIII give the comparisons of the results of isotopic concentrations and Table IX shows the EOL k∞. Based on the results presented in these tables, the following conclusions can be made: (a) MOCUP results are in an agreement with the measured values of the actinide concentrations to within 11%; most deviations are less than 5%. (b) MOCUP results are in an agreement with the measured concentrations of all fission products studied to within 10%. An exception is 149Sm with deviations of up to 50%. (c) All MOCUP isotopic concentration results fall within the range of the results calculated by different sets of codes. That is, the relative errors of MOCUP results with the average calculated values are less than the standard deviation. However, there are some exceptions for certain burnup values, in the case of several isotopes of Am and Sm. (d) The k∞ values calculated by MOCUP deviate from the benchmark values by less than 0.012.
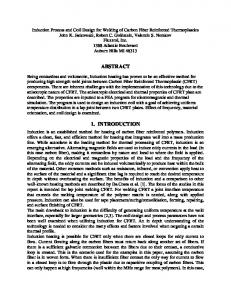
3. FAST REACTOR BENCHMARKING OF MOCUP 3.1 BENCHMARK SPECIFICATION The core sketch is shown in Figure 1. The BOL compositions are specified in Table X. Additional data are given in Table XI.
3.2 COMPARISONS OF MOCUP RESULTS WITH BENCHMARK VALUES In addition to the parameters described in Section 2.2, the vacuum boundary conditions for MCNP and the ORIGEN2 cross section library for LMFBR with LWR-Pu/U/U/U were used. MCNP was run at the following effective full power days (EFPD): 0, 250, 375 and 625. The comparisons of some BOL results are given in Table XII. Table XIII shows the results of isotopic composition variation and reactivity loss. The following observations can be made, based on the presented results: (a) The MOCUP calculated keff and neutron balance components fall within the range of the reported results. (b) The MOCUP prediction of reactivity loss with burnup and inner core and outer core isotopic composition variation are also within or almost within the range of the corresponding results given in the benchmark.
4. CONCLUSIONS
4
Based on the results of the thermal pin-cell and the fast reactor (burner) benchmarks, it is concluded that MOCUP can give the burnup results of reactivity swing and isotopic concentration variations which are in good agreement with those obtained from measurement and/or other codes. However, the accuracy of the results depends on several parameters that must be properly chosen (the time intervals for running MCNP, the normalization of flux, the length of the time steps in ORIGEN). In addition, more nuclides may need to be modeled in MCNP to get more accurate reactivity results.
REFERENCES 1. R. L. Moore at al.,"MOCUP: MCNP-ORIGEN2 Coupled Utility Program," Idaho National Engineering Laboratory Report INEL-95/0523, 1995. 2. J.F. Briesmeister, Ed., MCNP ¨ CA General Monte Carlo N-Particle Transport Code , Los-Alamos National Laboratory Report LA-12625-M, Version 4B (1997). 3. A.G. Croff, ORIGEN2 - A Revised and Updated Version of the Oak Ridge Code, Ridge National Laboratory Report ORNL/TM-7175, 1980.
Oak
4. M. D. DeHart, M. C. Brady and C. V. Parks, OECD/NEA Burnup Credit Calculational Criticality Benchmark Phase I-B Results, Oak Ridge National Laboratory Report ORNL6901, June 1996. 5. The Working Party on the Physics of Plutonium Recycling of the NEA Nuclear Science Committee, Physics of Plutonium Recycling, Volume 4, Fast Plutonium-Burner Reactors: Beginning of Life, OECD Document, ISBN 92-64-14703-9, 1995. 6. A. G. Croff, ORIGEN2: A Versatile Computer Code for Calculating the Nuclide Compositions and Characteristics of Nuclear Materials, Nuclear Technology, 62:335-352, September 1983. Table I. Physical Data for Benchmark Problem Pin-cell Calculation4 Parameter Data Type of Fuel Pellet UO2 Fuel Density, g/cm3 10.045 Rod Pitch, cm 1.5586 Outer Diameter of rod, cm 1.118 Inner Diameter of rod, cm 0.986 Fuel Diameter, cm 0.9563 Active Fuel Length, cm 347.2 Effective Fuel Temperature, K 841 Clad Temperature, K 620 Clad Material Zircaloy-2(97.91wt%Zr, 1.59wt%Sn, 0.5wt%Fe) Water Temperature, K 558 Water Density, g/cm3 0.7569 5
Table II. Operating History Data for Benchmark Problem Pin-cell Calculation4
Operating Cycle 1 2 3 4
Burntime (days) 306.0 381.7 466.0 461.1
Downtime (days) 71.0 83.1 85.0 1870.0
Born Concentration (ppm) 331.0 469.7 504.1 492.5
Boron Concentration (% of cycle 1) 100.0 141.9 152.3 148.8
Table III. Specific Power for the Three Benchmark cases4 Specific Power(kW/kgU) Operating Cycle 1 2 3 4
Case A (Final Burnup= 27.35GWd/MTU) 17.24 19.43 17.04 14.57
Case B (Final Burnup= 37.12GWd/MTU) 24.72 26.76 22.84 18.87
Case C (Final Burnup= 44.34GWd/MTU) 31.12 32.51 26.20 22.12
Table IV. Initial Fuel Composition and Number Densities4 Nuclide Number Density (atoms/b-cm) Nuclide Number Density (atoms/b-cm)
234
U
6.15165x10⁻⁶ 12
C
9.13357x10⁻⁶
235
U
6.89220x10⁻⁴ 14
N
1.04072x10⁻⁵
236
U
3.16265x10⁻⁶ 16
238
U
2.17104x10⁻²
O
4.48178x10⁻²
Table V. Beginning of Cycle 1 coolant Number Densities4 Nuclide Number Density (atoms/b-cm)
1
H
5.06153x10⁻²
16
O
2.53076x10⁻²
6
10
B
2.75612x10⁻⁶
11
B
1.11890x10⁻⁵
Table VI. Comparisons of Isotopic Concentrations(mg/g UO2) for Case A (27.35GWd/MTU Burnup)
Isotope 234
U 235 U 236 U 238 U 238 Pu 239 Pu 240 Pu 241 Pu 242 Pu 241 Am 243 Am 237 Np
Measurement Value 1.600x10⁻¹ 8.470 3.140 8.425x10+2 1.012x10⁻¹ 4.264 1.719 6.812x10⁻¹ 2.886x10⁻¹
2.680x10⁻¹
95
Mo 99 Tc 101 Ru 103 Rh 109 Ag 133 Cs 135 Cs 143 Nd 145 Nd 147 Sm 149 Sm 150 Sm 151 Sm 152 Sm 153 Eu 155 Gd
8.500x10⁻¹ 3.600x10⁻¹ 6.130x10⁻¹ 5.100x10⁻¹ 2.900x10⁻³ 2.070x10⁻¹ 8.700x10⁻² 7.900x10⁻²
1.590x10⁻¹ 8.190 3.224 8.375x10+2 9.027x10⁻² 4.230 1.710 6.697x10⁻¹ 2.761x10⁻¹ 2.426x10⁻¹ 4.101x10⁻² 2.912x10⁻¹
Standard Deviation of Col. 3 (%) 5.19 2.98 2.91 0.12 15.68 5.16 3.95 6.45 8.69 4.22 11.31 8.61
1.5611 x10⁻¹ 8.4275 3.1460 8.3761x10+2 9.2807x10⁻² 4.1036 1.6842 6.8976x10⁻¹ 2.8698x10⁻¹ 2.4250x10⁻¹ 3.9537x10⁻² 2.6676x10⁻¹
5.666x10⁻¹ 5.985x10⁻¹ 5.637x10⁻¹ 3.492x10⁻¹ 5.396x10⁻² 8.415x10⁻¹ 3.821x10⁻¹ 6.232x10⁻¹ 5.066x10⁻¹ 1.806x10⁻¹ 2.054x10⁻³ 1.953x10⁻¹ 9.742x10⁻³ 9.394x10⁻² 7.655x10⁻² 3.879x10⁻³
1.17 5.17 1.03 4.57 11.03 4.87 2.49 2.76 1.02 6.03 14.14 5.30 22.41 7.20 7.90 33.45
5.6028x10⁻¹ 5.9757x10⁻¹ 5.6355x10⁻¹ 3.4761x10⁻¹ 5.3361x10⁻² 8.4288x10⁻¹ 3.8658x10⁻¹ 6.1430x10⁻¹ 5.0698x10⁻¹ 1.6275x10⁻¹ 1.9915x10⁻³ 2.1025x10⁻¹ 9.6462x10⁻³ 8.6684x10⁻² 8.1485x10⁻² 4.0300x10⁻³
Average Value
7
MOCUP Results
Error of Col. 5 with Col.2(%) -2.43 -0.50 0.19 -0.58 -8.29 -3.76 -2.03 1.26 -0.56
-0.46
-0.84 7.38 0.21 -0.59 -31.33 1.57 -0.36 3.15
Error of Col. 5 with Col.3(%) -1.82 2.90 -2.42 0.01 2.81 -2.99 -1.51 3.00 3.94 -0.04 -3.59 -8.39 -1.12 -0.16 -0.03 -0.46 -1.11 0.16 1.17 -1.43 0.07 -9.89 -3.04 7.66 -0.98 -7.72 6.45 3.89
Table VII. Comparisons of Isotopic Concentrations(mg/g UO2) for Case B (37.12GWd/MTU Burnup)
Isotope 234
U 235 U 236 U 238 U 238 Pu 239 Pu 240 Pu 241 Pu 242 Pu 241 Am 243 Am 237 Np
Measurement Value 1.400x10⁻¹ 5.170 3.530 8.327x10+2 1.893x10⁻¹ 4.357 2.239 9.028x10⁻¹ 5.761x10⁻¹
3.560x10⁻¹
95
Mo 99 Tc 101 Ru 103 Rh 109 Ag 133 Cs 135 Cs 143 Nd 145 Nd 147 Sm 149 Sm 150 Sm 151 Sm 152 Sm 153 Eu 155 Gd
1.090 4.000x10⁻¹ 7.160x10⁻¹ 6.530x10⁻¹ 3.000x10⁻³ 2.710x10⁻¹ 1.040x10⁻¹ 1.090x10⁻¹
1.363x10⁻¹ 4.879 3.633 8.304x10+2 1.746x10⁻¹ 4.314 2.189 8.859x10⁻¹ 5.593x10⁻¹ 3.119x10⁻¹ 1.137x10⁻¹ 4.183x10⁻¹
Standard Deviation of Col. 3 (%) 7.08 6.01 2.72 0.17 14.80 6.08 4.27 5.97 8.28 4.35 10.41 8.86
1.3331x10⁻¹ 4.9255 3.5762 8.3046x10+2 1.6950x10⁻¹ 4.2756 2.1852 8.5309x10⁻¹ 5.6241x10⁻¹ 2.9460x10⁻¹ 9.5145x10⁻² 3.8220x10⁻¹
7.333x10⁻¹ 7.745x10⁻¹ 7.611x10⁻¹ 4.436x10⁻¹ 8.237x10⁻² 1.085 4.148x10⁻¹ 7.292x10⁻¹ 6.454x10⁻¹ 2.010x10⁻¹ 2.208x10⁻³ 2.738x10⁻¹ 1.092x10⁻² 1.195x10⁻¹ 1.139x10⁻¹ 6.676x10⁻³
1.30 3.57 1.05 5.15 10.61 4.90 2.98 3.93 1.25 7.95 15.01 7.07 21.72 9.01 8.19 33.28
7.2860x10⁻¹ 7.8220x10⁻¹ 7.6273x10⁻¹ 4.4074x10⁻¹ 8.0589x10⁻² 1.0852 4.1604x10⁻¹ 7.1175x10⁻¹ 6.4923x10⁻¹ 1.7613x10⁻¹ 2.0576x10⁻³ 2.9822x10⁻¹ 9.5884x10⁻³ 1.0975x10⁻¹ 1.1988x10⁻¹ 6.7335x10⁻³
Average Value
8
MOCUP Results
Error of Col. 5 with Col.2(%) -4.78 -4.73 1.31 -0.27 -10.46 -1.87 -2.40 -5.51 -2.38
7.36
-0.44 4.01 -0.59 -0.58 -31.41 10.05 5.52 9.98
Error of Col. 5 with Col.3(%) -2.20 0.95 -1.56 0.01 -2.92 -0.89 -0.17 -3.70 0.56 -5.55 -16.32 -8.63 -0.64 0.99 0.21 -0.65 -2.16 0.02 0.30 -2.39 0.59 -12.37 -6.81 8.92 -12.19 -8.16 5.25 0.86
Table VIII. Comparisons of Isotopic Concentrations(mg/g UO2) for Case C (44.34GWd/MTU Burnup)
Isotope
Measurement Value
Average Value
234
U
1.200x10⁻¹
1.215x10⁻¹
235
U
3.540
3.201
236
U
3.690
238
U
8.12 3.2615
3.769 +2
8.249x10
2.60 3.7162 +2
8.247x10
Error of Col. 5 with Col.3(%) -1.69
-7.87
1.89
0.71
-1.40
+2
-0.01
0.01
-1
-10.17
-1.52
0.21 8.2480x10
Pu
2.688x10
239
Pu
4.357
4.303
7.12 4.0566
-6.89
-5.73
240
Pu
2.543
2.437
5.27 2.4383
-4.12
0.05
241
Pu
1.020
9.892x10⁻¹
6.86 9.7377x10⁻¹
-4.53
-1.56
7.985x10
-1
8.39 8.1602x10
-1
-2.87
2.19
-1
5.29 3.2639x10
-1
-4.09 -20.44
Pu
8.401x10
-1
2.452x10
-1
Error of Col. 5 with Col.2(%) -0.46
238
242
-1
Standard MOCUP Deviation of Results Col. 3 (%) 8.99 1.1945x10⁻¹
13.86 2.4147x10
241
Am
3.403x10
243
Am
1.917x10⁻¹
10.40 1.5251x10⁻¹
-1
-1
237
95
Np
4.680x10
-1
Mo
99
Tc
101 103 109
-3.12
-9.42
8.440x10⁻¹
1.85 8.4205x10⁻¹
-0.23
-1
-1
1.36
8.958x10
4.21 9.0798x10
9.021x10⁻¹
1.76 9.0841x10⁻¹
0.70
Rh
4.099x10
-1
5.40 4.9139x10
-1
19.88
1.036x10
-1
10.21 1.0218x10
-1
-1.37
Ag
135
145
9.42 4.5338x10
Ru
133
143
5.005x10
Cs Cs
Nd Nd
1.240
1.244
4.300x10
-1
7.630x10
-1
7.440x10
-1
5.60 1.2423
4.318x10
-1
7.748x10
-1
7.339x10
-1
2.070x10
-1
0.19
-0.13
3.63 4.4194x10
-1
2.78
2.35
4.51 7.5649x10
-1
-0.85
-2.36
1.46 7.4198x10
-1
-0.27
1.10
9.12 1.7816x10
-1
147
Sm
149
Sm
4.700x10⁻³
2.336x10⁻³
15.61 2.2334x10⁻³
-52.48
-4.39
Sm
-1
3.311x10
-1
8.50 3.6496x10
-1
1.10
10.23
1.171x10
-2
22.31 1.0994x10
-2
150 151
Sm
152
Sm
153 155
Eu
Gd
3.610x10
-13.93
-6.12
1.210x10⁻¹
1.355x10⁻¹
9.68 1.2364x10⁻¹
2.18
-8.76
-1
1.397x10
-1
8.52 1.4628x10
-1
-1.16
4.71
8.849x10
-3
32.97 8.9863x10
-3
1.480x10
9
1.55
Table IX. Comparisons of EOL k∞ for Three Cases
Burnup (GWd/MTU)
Computer code
k∞ with k∞ with calculated measured concentra- concentrations, k∞,C tions, k∞,M 1.00567 b 1.00399 1.00934 1.01842 0.92079 0.92823 0.89869 0.92193 0.85399 0.86263 0.82784 0.85320
C
-
M
a
k∞ with average concentrations, k∞,A 1.00103 1.01721 0.91906 0.91776 0.86257 0.85474
MOCUP 0.0017 CASMO-3 -0.0088 MOCUP -0.0087 37.12 CASMO-3 -0.0280 MOCUP -0.0117 44.34 CASMO-3 -0.0359 a denotes reactivity. b The statistical uncertainties of all the k∞ from MOCUP are less than 0.001. 27.35
C
-
A
0.0046 -0.0077 0.0020 -0.0231 -0.0116 -0.0380
Table X. Initial Atomic Number Density(atoms/barn-cm) for Fast Reactor Benchmark5
235
U 9.409x10⁻⁶ 241 Pu 1.990 x10⁻⁴ Ni 2.583 x10⁻³ 235
U 7.899x10⁻⁶ 241 Pu 2.803 x10⁻⁴ Ni 2.583 x10⁻³ Fe 2.662 x10⁻² Fe 7.987 x10⁻³
Inner core 238 239 U Pu Pu -3 -5 3.754 x10 8.683 x10 6.037 x10⁻⁴ 242 241 Pu Am Fe -4 -5 2.180 x10 1.990 x10 1.231 x10⁻² Mo O Na -4 -2 3.105 x10 1.057 x10 7.389 x10⁻³ Outer core 238 238 239 U Pu Pu -3 -4 3.152 x10 1.223 x10 8.503 x10⁻⁴ 242 241 Pu Am Fe -4 -5 3.071 x10 2.803 x10 1.231 x10⁻² Mo O Na -4 -2 3.105 x10 1.061 x10 7.389 x10⁻³ Axial and radial reflector(shielding) Cr Ni Mo Na -3 -3 -4 7.662 x10 5.588 x10 6.717 x10 1.093 x10⁻² (Rod) Follower Cr Ni Mo Na -3 -3 -4 2.299 x10 1.676 x10 2.015 x10 1.863 x10⁻² 238
10
240
Pu 4.105 x10⁻⁴ Cr 3.541 x10⁻³ Mn 2.957 x10⁻⁴ 240
Pu 5.782 x10⁻⁴ Cr 3.541 x10⁻³ Mn 2.957 x10⁻⁴ Mn 6.398 x10⁻⁴ Mn 1.920 x10⁻⁴
Table XI. Physical Data of Fast Reactor Benchmark Parameter Data Sub-assembly lattice dimension, cm 15.14 Number of pins/sub-assembly 331(221 fuel pins,110 pins with no fuel) External clad diameter, cm 0.655 Pellet diameter, cm 0.550 Central hole diameter, cm 0.200 Nature and density of fuel Mixed UO2(10.46g/cc)-PuO1.98(10.94g/cc) Uranium isotopic composition, at% 0.25U-235, 99.75U-238 5.6Pu-238, 39.1Pu-239, 26.7Pu-240, Plutonium isotopic composition, at% 13.0Pu-241, 14.3Pu-242, 1.3Am-241 Pu/(U+Pu) ratio for inner core, mass% 28.85 Pu/(U+Pu) ratio for outer core, mass% 40.64 Density of steel(hex-tube and cladding), g/cc 7.95 Composition of steel, mass% 64.75Fe, 17.00Cr, 14.00Ni, 2.75Mo, 1.50Mn Volume fraction of fuel sub-assembly, % 22.96Fuel, 23.11Steel, 33.89Sodium Number of sub-assemblies in inner core 128 Number of sub-assemblies in outer core 112 Volume fraction of reflector sub-assembly, % 50.0Steel, 50.0Sodium Volume fraction of follower sub-assembly, % 15.0Steel, 85.0Sodium Thermal power, MW 1500 Electrical Power, MW 600 Load factor 0.80 Residence time of fuel sub-assemblies, EFPD 625 Fuel temperature, C 1227 Temperature of cladding, tube and sodium, C 470 Table XII. Comparisons of Some BOL Results Sort k-eff
MOCUP results 1.11955 (0.00170)a
Range of reported values
Sort
MOCUP results
Range of reported values
1.10660-1.13488
Critical balance(%) Absorption 90.64 88.5-92.0 Leakage 9.36 Absorption normalized to 1.0 U-235 0.0037 0.0037-0.0394 O 0.0024 U-238 0.2041 0.2027-0.2139 Fe 0.0948 Pu-238 0.0327 0.0290-0.0349 Cr 0.0391 Pu-239 0.2771 0.2786-0.2916 Ni 0.0374 Pu-240 0.0756 0.0674-0.0838 Mo 0.0532 Pu-241 0.1164 0.1155-0.1237 Mn 0.0167 Pu-242 0.0314 0.0034-0.0325 Na 0.0071 Am-241 0.0080 0.0080-0.0090 a The value in parentheses is the statistical uncertainties of MCNP.
11
8.0-11.5 0.0016-0.0030 0.0746-0.0925 0.0263-0.0379 0.0358-0.0409 0.0478-0.0547 0.0230-0.0330 0.0069-0.0078
Table XIII. Comparisons of Reactivity Loss and Isotopic Composition Variation Sort ∆
ANL CEA PNC(J2) PNC(J3,2) (USA) (FRANCE) (JAPAN) (JAPAN) Reactivity loss of BOL-EOL(% of ∆k/kk )
MOCUP
x100 %
12.44
U-235 U-238 Pu-238 Pu-239 Pu-240 Pu-241 Pu-242 Am-241 Am-243 Cm-242 Cm-244
-5.61 -394.5 -49.0 -160.9 -34.7 -136.5 -30.5 9.58 31.2 4.63 4.48
12.85
13.27
13.60
13.39
Isotopic composition variation of EOL-BOL(∆kg) -5.6 -5.9 -5.8 -5.7 -420 -411 -392 -390 -50 -45 -50 -47 -149 -174 -170 -131 -38 -21 -32 -13 -133 -139 -133 -122 -29 -42 -31 -20 9.1 7.5 8.3 9.5 31 44 33 34 3.7 5.2 4.8 4.5 4.1 7.4 5.3 5.3
PSI (SWIZERLAND) 13.06 -5.5 -384 -43.4 -173 -34 -137 -25 8.6 33 4.1 5.4
191.55 141.14 INNER CORE 50.14
F O L L O W E R
F O L L O W E R
INNER CORE
OUTER CORE
0 0 34.88
38.37
91.94
95.35
127.53
179.2
Figure 1. R-Z Geometry Sketch of Fast Reactor Benchmark. The Unspecified Region is Reflector. Unit: cm.
12