Multidimensional Systems and Signal Processing, 10, 429–441 (1999)
c 1999 Kluwer Academic Publishers, Boston. Manufactured in The Netherlands. °
Bias Removal Algorithm for 2-D Equation Error Adaptive IIR Filters
[email protected] Department of Electronic Engineering, Graduate School of Engineering, Tohoku University, Sendai, 980-8579, Japan
MAHA SHADAYDEH
MASAYUKI KAWAMATA
Department of Electronic Engineering, Graduate School of Engineering, Tohoku University, Sendai, 980-8579, Japan Received March 17, 1998; Revised September 29, 1998; Revised December 14, 1998 Abstract. This paper proposes a bias removal algorithm for equation error-based 2-D adaptive cascade IIR filters with separable denominator function. As well known, equation error-based adaptive IIR filtering algorithms have the advantages of fast convergence and unimodal mean-square-error surface. These advantages, however, come along with the drawback of biased parameter estimates in the presence of measurement noise. The adaptive filter structure in the proposed algorithm is based on the concept of backpropagating the desired signal through a cascade of the denominator vertical and horizontal sections. To handle the bias problem, the proposed algorithm uses a scaled value of the output error of each of the cascaded sections as an estimate for the measurement noise embedded in the signal part of the coefficient-update procedure of that section. Thus, while maintaining the advantages of easy stability monitoring, fast convergence, and low computational load, the effect of the measurement noise is suppressed. Input-Output stability analysis is carried out, and the constraints required to maintain stability are derived. Simulation examples are presented to support the effectiveness and the usability of the proposed bias removal algorithm in 2-D system identification and image enhancement applications. Key Words: 2-D equation error IIR filter, backpropagation adaptive filter, LMS algorithm
1.
Introduction
Equation error adaptive IIR filters have the advantages of fast convergence and unimodal mean square error surface. However, their main drawback is that they converge to biased parameter estimates in the presence of measurement noise. A 1-D equation error cascade IIR filtering algorithm has been proposed by Gao and Snelgrove [1]. This algorithm is based on the concept of backpropagating the desired signal through the inverse of the all pole second order sections such that new intermediate errors are generated; then the filter coefficients are adapted to minimize the intermediate errors. This cascade structure has the advantages of easy stability check and low parameter sensitivity. Moreover, minimizing the intermediate equation error functions instead of the output error offers significant reduction in the gradients’ computational complexity [1]. Such advantages are of great interest in 2-D adaptive IIR filters with applications to image enhancement and 2-D system identification. Toshima et al. [2] have proposed a direct extension of the 1-D backpropagation concept [1] to 2-D case for separable denominator adaptive IIR filters. In addition to the simplicity of stability monitoring, 2-D IIR filters with separable denominator function offer signifi-
430
M. SHADAYDEH AND M. KAWAMATA
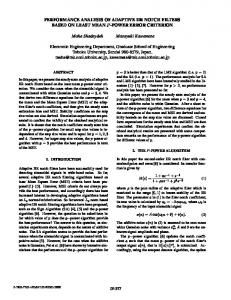
Figure 1. Equation error formulation for separable denominator 2-D IIR filters.
cant reduction in the computational load when compared with direct form 2-D IIR filters. Moreover, since the numerator is nonseparable polynomial, they can be efficiently used to approximate nonseparable 2-D IIR filters [3]. However, the drawback of the backpropagation cascade structures (1-D and 2-D case) is that they are based on minimizing equation error functions; accordingly, it is expected that they converge to biased parameter estimates when the desired signal is contaminated with measurement noise [4]. So far, stability analysis and the performance of the 1-D backpropagation cascade structure [1] as well as the 2-D one [2] have not been considered in the literature. In this paper we propose a 2-D Bias Removal Algorithm (2DBRA) for the backpropagation cascade structure [2]. The proposed bias removal technique is based on the idea of using a scaled value of the output error as an estimates for the measurement noise. This idea is adopted from the bias remedy LMS (BRLMS) algorithm proposed by Lin and Unbehauen [5] for direct form IIR filter. However, in this paper, we suggest to apply the output-error feedback at the output of each of the cascaded sections as shown in Figure 1. Thus, while maintaining the advantages of easy stability monitoring, fast convergence, and low computational load, the effect of the measurement noise is suppressed. Through our stability analysis of the the proposed algorithm we show that there are two possible reasons for the convergence of the algorithm [2] to biased parameter estimates. The first one is due to the cascade connection; the second is due to the measurement noise in the desired signal. The effect of the latter can be counteract by introducing the output-error feedback in the 2DBRA, while it is necessary to use small step size parameters to reduce the effect of the cascade connection. Note that a bias removal technique and performance analysis similar to those presented in this paper can be applied to the 1-D cascaded structure [1].
431
BIAS REMOVAL ALGORITHM
After introducing the the 2DBRA, stability analysis of the proposed algorithm is discussed. System identification and image enhancement experimental results are then presented to demonstrate the effectiveness and the superiority of the 2DBRA over the 2-D adaptive algorithm [2]. 2.
2-D Bias Removal Algorithm (2DBRA)
Consider the 2-D stable separable denominator IIR filter w(m, n) =
N2 N1 X X
a(i, j)u(m − i, n − j) +
i=0 j=0
M2 M1 X X
b1 (i)b2 ( j)w(m − i, n − j);
(1)
i=0 j=0 (i, j)6=(0,0)
d(m, n) = w(m, n) + v(m, n)
(2)
where u(m, n), m = 0, . . . , M, n = 0, . . . , N , is the input signal, d(m, n) is the observable output signal, and v(m, n) is a zero mean measurement noise assumed to be independent of w(m, n) and u(m, n). Let q1−1 and q2−1 denote spatial delay operators in the horizontal and vertical directions respectively. For the separable denominator adaptive IIR filter shown in Figure 1, the input ˆ 1−1 , q2−1 ) = signal u(m, n) is passed through the adaptive filter’s transversal section ( A(q P N1 P N2 −j ˆ j)q1−i q2 ), while the desired signal d(m, n) is backpropagated through i=0 j=0 a(i, the cascade of the adaptive filter’s denominator vertical and horizontal sections Bˆ 2 (q2−1 ) = P M1 P M2 −j bˆ2 ( j)q2 , and Bˆ 1 (q1−1 ) = 1− i=1 bˆ1 (i)q1−i respectively. Then two intermediate 1− j=1 error functions, namely e1 (m, n) and e2 (m, n), are generated as follows: e1 (m, n) = d1 (m, n) − y1 (m, n) T = d2 (m, n) − θˆ 1 (k − 1)ϕ1 (m, n)
(3)
e2 (m, n) = d2 (m, n) − y2 (m, n) T = θˆ 2 (k − 1)ϕ2 (m, n) − y2 (m, n).
(4)
In the inner product notations, k denotes the iteration number used in updating the coefficients; the value of k is some function of (m, n) specifying the indexing scheme, and θˆ 1 (k) = [bˆ1k (1), . . . , bˆ1k (M1 ), aˆ k (0, 0), . . . , aˆ k (N1 , N2 )]T
(5)
ϕ1 (m, n) = [d2 (m − 1, n), . . . , d2 (m − M1 , n), u(m, n), . . . , u(m − N1 , n − N2 )]T
(6)
θˆ 2 (k) = [1, −bˆ2k (1), . . . , −bˆ2k (M2 )]T
(7)
ϕ2 (m, n) = [d(m, n), d(m, n − 1), . . . , d(m, n − M2 )] . T
(8)
To handle the bias problem, the 2DBRA tries to counteract the effect of the measurement noise v(m, n) in the desired signal d(m, n) by using a scaled value of the output-error
432
M. SHADAYDEH AND M. KAWAMATA
eo (m, n) = d(m, n) − y(m, n) as an estimate for the measurement noise v(m, n). The filter parameter vector θˆ 2 (k) is then updated subject to minimizing the intermediate error function e2 (m, n) as follows: θˆ 2 (k) = θˆ 2 (k − 1) − µ2 e2 (m, n)[ϕ2 (m, n) − τ2 (m, n)εo (m, n)]
(9)
where µ2 = diag[0, µ2 , . . . , µ2 ] is a diagonal step size matrix, εo (m, n) is the output error vector given by εo (m, n) = [eo (m, n), eo (m, n − 1), . . . , eo (m, n − M2 )]T and τ2 (m, n) is a scaling factor defined as µ ¶ kϕ (m, n)k , α2 ≥ 0 τ2 (m, n) = min 1, α2 2 kεo (m, n)k
(10)
(11)
with k k denoting the Euclidean norm. In a similar way, the 2DBRA uses value of the error signal e2 (m, n) to estimate PaM2scaled −j bˆ2k−1 ( j)q2 )v(m, n), that reaches the intermediate the colored noise v1 (m, n) = (1 − j=1 signal d2 (m, n) (see Figure 1). The filter parameter vector θˆ 1 (k) is then updated subject to minimizing the intermediate error function e1 (m, n) as follows: θˆ 1 (k) = θˆ 1 (k − 1) + µ1 e1 (m, n)[ϕ1 (m, n) − τ1 (m, n)ε2 (m, n)]
(12)
where ε2 (m, n) = [e2 (m − 1, n) . . . e2 (m − M1 , n), ]T and τ1 (m, n) is a scaling factor defined as µ ¶ kϕ (m, n)k , α1 ≥ 0. τ1 (m, n) = min 1, α1 1 kε2 (m, n)k
(13)
(14)
The time varying scaling factor τ1 (m, n)(τ2 (m, n)) defined in Eq. (14)((11)) is chosen to be inversely proportional to the variance of the error e2 (m, n)(eo (m, n)) such that output-error feedback mechanism works only when the output-error e2 (m, n)(eo (m, n)) becomes good estimates of the measurement noise in d2 (m, n) (d(m, n)). 3.
Stability Analysis of the 2DBRA
Rigorous convergence analysis of the 2-D cascade structure in Figure 1 as a whole dynamic is very complicated due to the interaction between the cascaded sections. In an attempt to simplify the analysis of the dynamical behavior of the 2DBRA, we divide this structure into two parts. The first part consists of the transversal section and the denominator horizontal section with input vector ϕ1 (m, n) and desired signal d2 (m, n). And the second part consists of the denominator vertical section with input vector ϕ2 (m, n) and desired signal y2 (m, n). Then we show that the effect of the interaction between these two cascaded parts can be replaced by a noise component in the desired signal of each part. On the other-hand, and
BIAS REMOVAL ALGORITHM
433
in order to reduce the interconnection between the cascaded sections, we here suggest that, at the update iteration k, the signals y1 (m, n), d2 (m, n) and d1 (m, n) should be calculated from the estimated parameters at iteration k − 1, while the signal y2 (m, n) and y(m, n) should be calculated from the estimated parameters at iteration k − 2. Accordingly, at iteration k, the intermediate signal y2 (m, n) is independent of θˆ 1 (k − 1), that is e2 (m, n) is independent of θˆ 1 (k − 1). In this view, and under the assumption that the adaptation process of the filter coefficients is slow, i.e. the used step size parameters are sufficiently small, stability analysis of the difference equation that describes the parameter-error vector of each part can be carried out as if these two part were independent using the stability robustness theory of perturbed linear system [6] following the same line of arguments as presented in [5]. In the rest of this section, we only discuss the stability of the mean of the parameter-error vector: E{θ˜ 1 (k)} = E{θ 1 − θˆ 1 (k)}
(15)
where θ 1 is the ideal parameter vector defined as θ 1 = [b1 (1), . . . , b1 (M1 ), a(0, 0), . . . , a(N1 , N2 )]T
(16)
Similar mathematical derivation and stability analysis can be applied to the parameter-error vector θ˜ 2 (k) [4].
Stability Analysis of Eq. (15) Now, before going into the stability analysis of Eq. (15), we will first show that the desired signal d2 (m, n) for the first part of the structure can be decomposed into three components as follows: d2 (m, n) = d20 (m, n) + ζ2 (m, n) + v1 (m, n)
(17)
with d20 (m, n) represents the noise free stationary desired signal for this part of the structure; ζ2 (m, n) is a perturbation component related to the fluctuation of the parameter-error vector θ˜ 2 (k − 1). Using Eq. (2), the regressor vector ϕ2 (m, n) in Eq. (8) can be rewritten as ϕ(m, n) = ϕ20 (m, n) + v 2 (m, n)
(18)
ϕ20 (m, n) = [w(m, n), w(m, n − 1), . . . , w(m, n − M2 )]T
(19)
v 2 (m, n) = [v(m, n), v(m, n − 1), . . . , v(m, n − M2 )]T .
(20)
with
434
M. SHADAYDEH AND M. KAWAMATA
From Figure 1, and using Eq. (18), we have d2 (m, n) = θˆ 2 (k − 1)T (ϕ20 (m, n) + v 2 (m, n)) = θ 2T ϕ20 (m, n) − θ˜ 2 (k − 1)ϕ20 (m, n) + v1 (m, n) T
= θ 2T ϕ20 (m, n) + ζ2 (m, n) + v1 (m, n)
(21)
T with ζ2 (m, n) = −θ˜ 2 (k − 1)ϕ20 (m, n). However, from Eq. (1) we can find that
θ 1T ϕ10 (m, n) = θ 2T ϕ20 (m, n)
(22)
where ϕ10 (m, n) = [d20 (m − 1, n), . . . , d20 (m − M1 , n), u(m, n), . . . , u(m − N1 , n − N2 )]T
(23)
d20 (m, n) = θ 2T ϕ20 (m, n).
(24)
Substituting Eq. (22) in Eq. (21) we arrive at Eq. (17) with d20 (m, n) = θ 1T ϕ10 (m, n). Now, substituting Eq. (12) in Eq. (15) and using Eqs. (3) and (17) we get E{θ˜ 1 (k)} = [A1 + B1 (m, n)]E{θ˜ 1 (k − 1)} + Av1 + Aζ2
(25)
where A1 = I − µ1 Rϕ1 ϕ1 B1 (m, n) =
(26)
µ1 E{τ1 (m, n)ϕ1 (m, n)ε2T (m, n)}
(27)
Av1 = µ1 E{[b1T v 1 (m, n) − v1 (m, n)][ϕ1 (m, n) − τ1 (m, n)ε2 (m, n)]} Aζ2 =
−µ1 E{[1, −b1T ]ζ 2 (m, n)[ϕ1 (m, n)
− τ1 (m, n)ε2 (m, n)]}
(28) (29)
with Rϕ1 ϕ1 = E{ϕ1 (m, n)ϕ1T (m, n)} b1 = [b1 (1), . . . , b1 (M1 )]
(30)
T
v 1 (m, n) = [v1 (m − 1, n), . . . , v1 (m − M1 , n)]
(31) T
(32)
ζ 2 (m, n) = [ζ2 (m, n), ζ2 (m − 1, n), . . . , ζ2 (m − M1 , n)] . T
(33)
Note that we have assumed that the parameter vector θˆ 1 (k−1) is independent of the regressor vector ϕ1 (m, n). This assumption is referred to as the independence assumption in adaptive filtering literature [7] and is well justified for sufficiently small step size parameters. The difference equation (25) has two forcing terms. The first one Aζ2 is related to the error in estimating the parameters of the second part of the cascade structure θ˜ 2 (k − 1). And the second Av1 is due to the colored measurement noise v1 (m, n). For τ1 (m, n) = 0, these two forcing terms cause the adaptive algorithm [2] to converge to biased solution.
435
BIAS REMOVAL ALGORITHM
Table 1. Parameter estimates for Example 1 (30 runs).
True values
a(1, 0)
a(0, 1)
a(1, 1)
b1 (1)
b1 (2)
b2 (1)
b2 (2)
0.8
−0.5
−0.4
1.2
−0.36
−0.9
−0.2
Ref. [2]
1.3208
−0.4717
−0.6225
0.6844
0.0980
−0.9174
−0.2346
2DBRA
0.7967
−0.5028
−0.4063
1.2050
−0.3591
−0.8981
−0.1994
In the Appendix we discuss the conditions that should be imposed on the step size parameter µ1 and the constant α1 to ensure the stability of the difference equation (25). We show that the forcing term Av1 will approach zero as the scaling factor τ1 (m, n) → 1. On the other-hand, the output error feedback in the second part of the structure will be useful to reduce the amount of bias caused by the forcing term Aζ2 . 4.
Experimental Results
Example 1: Noisy desired signal (white measurement noise). In this example, the 2-D adaptive algorithm [2] and the 2DBRA are applied to the system identification experiment. A 2-D zero mean white Gaussian signal of unit variance and size 256 by 256 is used for the input signal u(m, n). And a zero mean, unit variance Gaussian noise which is independent of the input signal is used for the additive noise v(m, n). The process w(m, n) is generated by filtering the input signal u(m, n) with the separable denominator 2-D IIR filter: ¢ ¡ H q1−1 , q2−1 =
1 + 0.8q1−1 − 0.5q2−1 − 0.4q1−1 q2−1
(1 − 1.2q1−1 + 0.36q1−2 )(1 + 0.9q2−1 + 0.2q2−2 )
.
(34)
Table 1 shows the obtained parameter estimates for µ1 = 0.0012, µ2 = 0.0008, and α1 = α2 = 0.5. Experimental results have shown that the amount of the reduction in the bias caused by the interaction between the cascaded sections depends on the values of the used step size parameters µ1 and µ2 . For sufficiently small step size values, significant reduction in the bias caused by both the measurement noise and the cascade interaction can be obtained. This reduction in the bias is achieved, however, at the expense of moderate increase in the computational load of the 2DBRA over the algorithm [2]. This increase is due to the requirement of adjusting the time varying scaling factors τ1 (m, n) and τ2 (m, n) at each iteration. Example 2: Noisy desired signal (colored measurement noise). In this example we aim to compare the performances of the proposed 2DBRA with that of the 2-D LMS algorithm [2] in the colored measurement noise scenario. We apply both algorithms to the system identification experiment. The following transfer function is used for the unknown system [8]: ¢ ¡ H q1−1 , q2−1 =
1 + q1−1 + 2q2−1 + 3q1−1 q2−1
1 − 0.25q1−1 − 0.5q2−1 + 0.125q1−1 q2−1
.
(35)
436
M. SHADAYDEH AND M. KAWAMATA
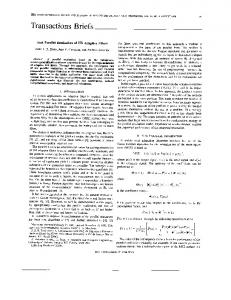
Figure 2. The improvement of the SNR of the enhanced image through consecutive passes in Example 2.
A 2-D white Gaussian noise of zero mean and 104 variance is used for the input signal u(m, n). And the “Mandrill” image of mean 129.1378, variance σv2 = 1749.8, and size 256 columns by 256 rows, is used for the measurement noise v(m, n). The image is processed row by row repeatedly such that the values of the estimated parameters at the end of one pass are used as the parameter initial values at the beginning of the next pass. The error signal e0 (m, n) = d(m, n) − y(m, n) gives the enhanced image. The variance of the noise left in the enhanced image is calculated by subtracting the noiseless image from it and then computing the variance. Figure 2 shows the improvement in the Signal to Noise Ratio (SNR) of the enhanced image through successive passes using the algorithm [2] and the 2DBRA where SNR value is calculated by µ 2¶ σ (36) SNR = 10 log v2 σn with σn2 denotes the variance of the noise left in the enhanced image. The SNR value of the initial noisy image is −7.711. As this figure indicates, for low SNR, the 2DBRA works almost without the bias removal mechanism as the algorithm [2]. As the SNR increases gradually, the effectiveness of the output-error-feedback becomes very clear. Figures 3 and 4 show the original and the noisy image “Mandrill” respectively. Figures 5 and 6 show the enhanced images at the 10th pass using algorithm [2] and the 2DBRA respectively. In both of the experiments presented here, stability monitoring was not required. It has been observed that, for sufficiently small step size parameters, whenever the poles of the
BIAS REMOVAL ALGORITHM
437
Figure 3. The original image “Mandrill” used in Example 2.
Figure 4. The noisy image “Mandrill” used in Example 2.
adaptive filters start to immigrate outside the unit circle, the output error of each section increases suddenly and consequently the scaling factors τ1 (m, n) and τ2 (m, n) decreases; the adaptive algorithm works without output-error feedback and is able to draw the poles back to the unit circle.
438
M. SHADAYDEH AND M. KAWAMATA
Figure 5. The enhanced image at the 10th pass using algorithm [2], µ1 = µ2 = 7.6894 × 10⁻⁸ .
Figure 6. The enhanced image at the 10th pass using the 2DBRA, µ1 = µ2 = 7.6894 × 10⁻⁸ , α1 = α2 = 0.7.
5.
Conclusion
The bias removal algorithm for 2-D equation error adaptive IIR filters has been presented. The filter structure in the proposed algorithm is based on backpropagating the desired signal
439
BIAS REMOVAL ALGORITHM
through a cascade of the denominator vertical and horizontal sections. The key idea in the proposed algorithm is to use a scaled value of the output error of each of the cascade sections to counteract the effect of the measurement noise embedded in the regressor of the update procedure of that section. I/O stability analysis has been carried out. It has been shown that the proposed algorithm remains stable and the effect of the measurement noise can be significantly suppressed under general conditions imposed on the values of the used step sizes and scaling factors. Image enhancement and 2-D system identification experimental results have been presented to support the effectiveness of the proposed 2DBRA algorithm. Appendix: Stability Analysis of the Difference Equation (25) i) Stability Analysis of the Autonomous Part of Eq. (25) The autonomous perturbed system E{θ˜ 1 (k)} = [A1 + B1 (m, n)]E{θ˜ 1 (k − 1)},
(37)
is exponentially and asymptotically stable if [6] 1. All the eigenvalues of the stability matrix A1 are within the unit circle. Such condition is satisfied if µ1 ≤
2σ1 , tr(Rϕ1 ϕ1 )
0 < σ1 ≤ 1.
(38)
Then we can define the state transition matrix 81 (k) = Ak1 , k > 0
(39)
that satisfies k81 (k)k ≤ c1 β1k , c1 > 0, β1 ∈ [0, 1].
(40)
2. The perturbation term B1 (m, n) satisfies. 0 ≤ β1 + c1 kB1 (m, n)k ≤ 1.
(41)
From Eq. (27) we have © ª kB1 (m, n)k = kE τ1 (m, n)µ1 ϕ1 (m, n)ε2T (m, n) k ½ ¾ kϕ1 (m, n)k 2σ1 kϕ1 (m, n)k kε2 (m, n)k ≤ α1 E kε2 (m, n)k tr(Rϕ1 ϕ1 ) ≤ 2σ1 α1 .
(42)
440
M. SHADAYDEH AND M. KAWAMATA
Thus, the value of α1 should satisfy 0 ≤ α1 ≤
1 − β1 . 2σ1 c1
(43)
ii) The Boundedness of the Forcing Term Av1 Making use of Eq. (17) in Eq. (28), invoking the assumption that the measurement noise v(m, n) is independent of u(m, n) and w(m, n), and providing that the poles of the adaptive filter’s denominator horizontal section are inside the unit circle, we can find that kAv1 k = µ1 kE{[b1T v 1 (m, n) − v1 (m, n)][v 1 (m, n) − τ1 (m, n)v 1 (m, n)]}k = µ1 k[1 − τ1 (m, n)][Rv1 v1 b1 − E{v1 (m, n)v 1 (m, n)}]k ≤ µ1 kRv1 v1 b1 − E{v1 (m, n)v 1 (m, n)}k
(44)
with Rv1 v1 = E{v 1 (m, n)v 1T (m, n)}. Hence, the forcing term Av1 is bounded, and kAv1 k will approach zero as τ1 (m, n) → 1. iii) The Boundedness of the Forcing Term Aζ2 From Eq. (29) we have kAζ2 k = µ1 kE{[1, −b1 ]ζ 2 (m, n)[ϕ1 (m, n) − τ1 (m, n)ε2 (m, n)]}k à !1/2 M1 X 2 b1 (i) E{kζ 2 (m, n)kk[ϕ1 (m, n) − τ1 (m, n)ε2 (m, n)]k}. ≤ µ1
(45)
i=0
Equation (45) states that the norm of the forcing term Aζ2 is bounded providing that the error signal ζ2 (m, n) has finite variance. The boundedness of the error ζ2 (m, n) is guaranteed if the step size µ2 , used in the update procedure of the denominator vertical section, satisfies the necessary condition for the convergence of the LMS FIR filter Bˆ 2 (q2−1 ) in the variance which is given by [7] µ2