Abstractâ. Among several features used for clinical binary classification, behavioral performance, questionnaire scores, test results and physical exam reports ...
This article has been accepted for publication in a future issue of this journal, but has not been fully edited. Content may change prior to final publication. Citation information: DOI 10.1109/JBHI.2018.2844300, IEEE Journal of Biomedical and Health Informatics
> REPLACE THIS LINE WITH YOUR PAPER IDENTIFICATION NUMBER (DOUBLE-CLICK HERE TO EDIT)
REPLACE THIS LINE WITH YOUR PAPER IDENTIFICATION NUMBER (DOUBLE-CLICK HERE TO EDIT) < proposed method with a proof of concept, in an application in fibromyalgia which is a chronic syndrome of high sensitivity to pain with a prevalence of 2-8% among populations [16]. FM syndrome is generally diagnosed according to the American College of Rheumatology (ACR) 1990 [17] or 2010 [18] criteria in clinics. These criteria mainly depend on tender point count and duration of widespread chronic pain. In addition to these parameters, Fibromyalgia Impact Questionnaire (FIQ), depression tests (Beck Depression Inventory (BDI), Hospital Anxiety and Depression Scale (HADS) etc.), pain threshold measurements and pain scores are also used as supportive information for diagnosis of FM. Automatic diagnostic classification of FM via machine learning methods by using clinical measures is possible [19]. Classification of 53 FM patients and 74 romatoid arthiris (RA) patients was performed by using ADABoost classifier utilizing several clinical measures such as Global Severity Index (GSI), Positive Symptom Distress Index (PSDI) and Positive Symptom Total (PST) and medico-social features such as age, Visual Analog Scale, occupation, years in school, years with disease, average income per month and their medication. Results reported a success rate for clinical measures 96%, for medico-social characteristics 89% and for combination of clinical and medico-social features 97% was observed to discriminate FM and (RA). However, underlying abnormalities in central nervous system for FM syndrome is still unknown. To discover abnormalities that cause FM, several neuroimaging studies focused on finding neuromarkers specific to FM (see reviews [20-22]). There are only a handful reports regarding classification of FM from neuroimaging data. While results of these are in the range of 76-96% accuracy, some of these methods employed feature level fusion, none employed decision level fusion. In this study, we developed a decision level fusion approach to combine clinical and neuroimaging data which provides flexibility of use at the clinic. Furthermore the proposed method in the following sections is generalizable to any clinical application which contains a heterogeneous set of features that employ clinical and neuroimaging data. II. METHOD On a group of fibromyalgia (FM) patients and healthy controls (HC), three different experiments are conducted in a clinical neuroimaging lab [23, 24]. In addition, patients filled questionnaires. Clinical measurements regarding pain thresholds are collected by experiments just before the start of the neuroimaging data collection. Then several classifiers are trained with extracted features and a quality check is done. Among all of the classifiers tested, 5 are chosen for fusion, to improve the performance of binary detection. This provided adequate materials for us to carry on with the proof of concept for decision level fusion. The framework for binary classification based on decision level fusion with maximum likelihood is introduced in Fig. 1. In a more general setting, for binary classification of other clinical ailments, data collection can include a wider range of data as follows. Behavioral performance could be collected through neuropsychological tests such as Stroop. Self-report based data could be collected when the patients fill standard
2
questionnaires such as BDI. Verbal report could be obtained during physical exam from the records of the physician. Physiological data could be acquired as time series using sensors that measure heart rate, skin conductance, EMG or skin temperature during an ongoing task such as a stress test. Brain activity could be acquired as time series through either resting state or task-based fMRI, EEG, MEG. All of these data can be added to the proposed framework for detection of FM, using new classifiers that operate on features obtained from the behavioral performance such as reaction time, accuracy or features from the self-reports in terms of survey scores or features obtained from the physician’s report consisting of pulse, weight and other physical exam details or features obtained from physiological/brain activity based on normalized t values or p values after data analysis, and absolute peak values or onset latencies of the signals of each trial, and mean signal values in each trial.
Figure 1. Binary classification based on decision level fusion with likelihood A. Data Collection 16 healthy controls (HC) and 19 fibromyalgia (FM) patients were admitted. All participants were required to fill Beck Depression Inventory (BDI) questionnaire. Pain threshold values for both thumbs were collected by using electronic Von Frey (eVF) anesthesiometer (Ugo Basile Co., Italy). More details regarding participants are provided in [24]. The first experiment involved motor data collection in a self-paced finger tapping task (FTT). The second experiment involved painful stimulation with and without TENS device (PAIN). The third experiment, was median nerve stimulation using TENS device (MNS). For all of these experiments, fNIRS data was collected using Hitachi ETG-4000 continuous wave functional near infrared spectroscopy system. Data was collected from both hands in separate episodes. More details are provided in [23, 24]. B. Feature Extraction After obtaining channel positions and corresponding cortical regions, data was preprocessed to remove artifacts [23, 24]. In order to generate features based on different regions of interest (ROI), time series data from multiple channels were averaged.
2168-2194 (c) 2018 IEEE. Personal use is permitted, but republication/redistribution requires IEEE permission. See http://www.ieee.org/publications_standards/publications/rights/index.html for more information.
This article has been accepted for publication in a future issue of this journal, but has not been fully edited. Content may change prior to final publication. Citation information: DOI 10.1109/JBHI.2018.2844300, IEEE Journal of Biomedical and Health Informatics
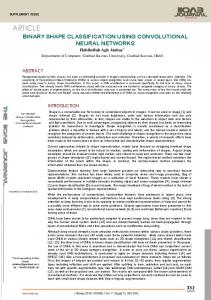
> REPLACE THIS LINE WITH YOUR PAPER IDENTIFICATION NUMBER (DOUBLE-CLICK HERE TO EDIT) < Out of 12 channels per hemisphere, 6 ROIs were created. These were middle frontal gyrus (MFG), pre central gyrus (Pre CG), post central gyrus (Post CG), superior parietal gyrus (SPG), and parts of inferior parietal lobe; supramarginal gyrus (SMG) and angular gyrus (AG) known in the literature as active regions in painful stimulation studies of FM [25-30] and healthy controls [31]. The channels that correspond to left (L) and right (R) hemisphere ROIs are illustrated in Fig. 2.
[𝑦 , 𝑦 , 𝑦 … … . 𝑦 ] that have the same length N, a distance matrix A is constructed that has NxN dimensions. We can assume 𝑥(𝑛) and 𝑦(𝑛) as hemodynamic responses obtained from different channels. For every index of A ; 𝐴 = 𝑑(𝑥(𝑖), 𝑦(𝑗))
We created functional connectivity matrices using three metrics: cross-correlation analysis with maximal lag (CCA), seed-based correlation analysis (SCA), and Dynamic Time Warping (DTW). 1) Cross Correlation Analysis (CCA) with Maximum Lag For two different time series 𝑥(𝑛) and 𝑦(𝑛) represents two different fNIRS channel. If we assume 𝑙 as shift lag for time series 𝑦 that is -20 sec to + 20 sec for this study, maximum cross correlation coefficient for 𝑙 is ∑
( ) ( ( )
( )
)
(1)
That 𝑟 (0) and 𝑟 (0) are zero-lag autocorrelation estimations of 𝑥(𝑛) and 𝑦(𝑛). 𝑟 (0) = ∑
𝑥(𝑛) 𝑥(𝑛)
(2)
𝑟 (0) = ∑
𝑦(𝑛) 𝑦(𝑛)
(3)
Monotonic condition : In warping path indices does not go back in time domain. This provides that time points are not repeated in warping path. Indices can either stay same or increase: 𝑎−𝑐 ≥0&𝑏−𝑑 ≥0
2) Seed-Based Correlation Analysis (SCA) Seed-Based Correlation Analysis was performed by estimating the zero-lag correlation coefficient for time series 𝑥(𝑛) and 𝑦(𝑛) by following formula. 𝑟 (0) =
(
)(
)
(4)
3) Dynamic Time Warping (DTW) DTW is a similarity measurement algorithm that is generally used for two-time series that vary in time or speed [32]. It finds an optimal match between two-time series that might include stretched and compressed parts. To achieve this, it minimizes the total distance between these two-time series. For time series, 𝑥(𝑛) = [𝑥 , 𝑥 , 𝑥 … … . 𝑥 ] and 𝑦(𝑛) =
(7)
Continuity condition : Warping path advances one step at a time. Index change between a-c and b-d can be less or equal to one. (8)
Boundary condition : The path should start from A(0,0) and finish A(N-1,N-1). Warping window condition : An ideal alignment path onto distance matrix A can not be too far from the diagonal of this matrix. For warping window length r, |𝑎 − 𝑏| > 𝑟 & |𝑐 − 𝑑| > 𝑟
We used CCA with maximum lag from -20 sec to + 20 sec with 10 Hz sampling rate (-200 +200 time points). Among these lag values, we used the one which returned the maximum correlation coefficient as window size in DTW.
(6)
If we assume time indices a and c for one time series and b and d for other time series, kth and k-1th point in our warping path can be identified as 𝑤 = (𝑎, 𝑏) and 𝑤 = (𝑐, 𝑑) such that this warping path provides the following conditions ;
𝑎−𝑐 ≤1&𝑏−𝑑 ≤1 𝑎𝑟𝑔 𝑚𝑎𝑥 𝑟 (𝑙) =
(5)
show the Euclidean distance between 𝑥(𝑖) and 𝑦(𝑗). Primary objective of this method is to find the path that minimizes between two time series that starts from the index (0,0) to (N-1,N-1). This way is called warping path. 𝑊 = [𝑤 , 𝑤 , … … . . 𝑤 ]
Figure 2. Regions of Interest (ROI) of the connectivity features
3
(9)
In DTW, warping matrix is created by using linear programming. To find the minimum distance between two time series, first Euclidean distance 𝑑(𝑥(𝑖), 𝑦(𝑗)) should be found and defined as cost value. Then, to proceed in the warping matrix, minimum value of the neighboring cells (𝐷(𝑖 − 1, 𝑗 − 1), 𝐷(𝑖 − 1, 𝑗), 𝐷(𝑖, 𝑗 − 1)) is chosen and the 𝐷(𝑖, j) can be found by the following formula. 𝐷(𝑖, 𝑗) = 𝑑(𝑥(𝑖), 𝑦(𝑗)) + 𝑚𝑖𝑛 (𝐷(𝑖 − 1, 𝑗 − 1), 𝐷(𝑖 − 1, 𝑗), 𝐷(𝑖, 𝑗 − 1))
(10)
We used maximum lag of time points obtained from CCA as window length (DTW-ML) and infinite window length in DTW (DTW-INF) to find DTW distance as a FC measure. The first usage of DTW as a FC metric for classification of time series is reported in [33]. For DTW-INF and DTW-ML, we first normalized it to [-1, 1] scale. -1 value corresponds to the maximum distance in DTW distance matrix and 1 corresponds to the DTW distance equals to zero that represents the maximum similarity. Then, we directly
2168-2194 (c) 2018 IEEE. Personal use is permitted, but republication/redistribution requires IEEE permission. See http://www.ieee.org/publications_standards/publications/rights/index.html for more information.
This article has been accepted for publication in a future issue of this journal, but has not been fully edited. Content may change prior to final publication. Citation information: DOI 10.1109/JBHI.2018.2844300, IEEE Journal of Biomedical and Health Informatics
> REPLACE THIS LINE WITH YOUR PAPER IDENTIFICATION NUMBER (DOUBLE-CLICK HERE TO EDIT) < applied Fisher’s Z-transformation to both DTW matrices to decrease the skewness and normalize the distribution. 4) Features driven from self-reported clinical data We used BDI score, right hand and left hand pain threshold values as features. for this classification. After normalizing features by using Z-score normalization, we used Hampel filter [34-36]. For any feature 𝐷 = [𝑑 , 𝑑 , 𝑑 , … . 𝑑 ] and a sliding window of length 𝑙, local median and standarddeviation is defined as; 𝑚 = 𝑚𝑒𝑑𝑖𝑎𝑛(𝑑 𝜎 = ℎ 𝑚𝑒𝑑𝑖𝑎𝑛(|𝑑
,𝑑
,𝑑
,….𝑑 ,…,𝑑
− 𝑚 |, . . , |𝑑 − 𝑚 |, … , |𝑑
,𝑑
,𝑑
) (11)
− 𝑚 |) (12)
where ℎ is the constant, defined as ℎ = 1⁄(√2 𝑒𝑟𝑓𝑐 (0,5)) = 1,4826 that is used to make the median standard deviation estimate unbiased. Filter’s response for 𝑖 element 𝑑′ is given by 𝑑′ =
𝑚 , |𝑑 − 𝑚 | > 𝑡𝜎 𝑑 , |𝑑 − 𝑚 | ≤ 𝑡𝜎
(13)
In this equation, 𝑡 represents the threshold value. If it is set to zero, a standard median filter was obtained. For our study, we used 𝑙 = 5 and 𝑡 = 1. 5) Features driven from individual channels An ideal hemodynamic response function (HRF) is created with 40 sec duration and 20 sec onset latency. Based on our previous work [17,18], the channels that differed significantly between HC and FM populations are selected to extract features (i.e. channels 6,18 for PAIN, 3,17 for FTT and TENS). Features are defined as the DTW distance between the observed signal and ideal HRF. Features are computed separately for right and left hands, channels and PAIN, PAIN+TENS, TENS and FTT conditions. After extracting features, we normalized them by using z-score normalization. C. Feature reduction After obtaining symmetric FC matrices that all have size 12 x 12, we applied t-test to compare the HC and FM groups for every experiment (PAIN, FTT, MNS, TENS), hand (Left, Right) and connectivity metric (SCA, CCA, DTW-INF and DTW-ML) separately. For significant connections, we chose significance threshold for p=0.025 for every map. Having determined the significant connections, we saved only these connections as features for every experiment. The FC maps showing t-test values of the connections between the HC and FM groups are shown in Table I. Due to high dimensionality, we had to reduce the dimensions of the feature vector aggregated from all experiments by using Principal Component Analysis (PCA) by keeping %95 of variance. -----insert Table I presented after references about here----D. Classification We used the Matlab Classification Learner Application. The algorithms are trained and tested by 10 and 20 fold cross
4
validation. Because of the small sample size in the FM and HC classes, we used data imputation to avoid over generalization. As a rule of thumb, regeneration of new data should be restricted to cover at most 30% of the data pool [37]. Data imputation is a widely used approach in the data-hungry deep learning systems [38]. Since the features extracted from our experiments are converted to z-scores already, data is imputed by using the mean and variance of each feature, separately for the two classes, abiding by the same methodology used in [38]. We generated imputed data for 6 FM samples and 9 HC samples, so that a total of 25 samples are reached at both groups. Several classifiers are trained using kNN, SVM, LDA and Logistic Regression and Bagged Trees ensemble algorithms embodied in the Matlab toolkit. As illustrated in Fig 2, each classifier Ci has public executables and stored characteristics such as 𝑁 , 𝑁 , 𝑇 , 𝐹 , 𝐿 such that 𝑁 , 𝑁 , are the number of healthy controls and the number of patients with disease. 𝑇 is the ratio of true positives, obtained by dividing the correctly classified patients, 𝑁 , to 𝑁 . 𝐹 is the ratio of falsely classified healthy controls, obtained by dividing the falsely classified controls, 𝑁 , to 𝑁 (i.e. false positives). Li is the likelihood ratio of the classifier to detect the disease. [13]. 𝐿 =
(14)
Having a likelihood ratio equal to 1 is non-specific, but having a likelihood ratio smaller than 1 indicates that classifier Ci has negative opinion regarding existence of the disease. On the other hand, if the likelihood ratio is larger than 1, than the detection rate of the classifier increases approximately 5% for each 1 point increase in likelihood [13]. The higher the likelihood Li, the better the chance of Ci to detect the disease. Now assume that a classifier Ci can be used because its features are measured from the patient. Then using a threshold value, ßi, (which ranges between 0-1) the patient is decided to test positive based on a-posteriori probability, when pi > ßi . This decision returns a boolean opinion about the existence of disease as ui from classifier Ci. if pi > ßi then ui = 1 else ui = 0
(15)
E. Fusion The proposed method herein relies on the assumption that method sharing at the classifier level can be put to practice in the clinics, provided that achieving interoperability at classifier level can easily be guaranteed using apps that operate on mobile or remote platforms. Hence we assume that the clinics are already populated with several classifiers that utilize features driven from the resources available at their disposal. Based on the availability of multiple features obtained from multiple tests or data resources, multiple classifiers may return opinions. Each classifier contributes to the overall opinion based on the decision it supports. If the decision of a classifier is positive, the detection rate of the classifier is taken into account (i.e..number of true positives divided by the number of type 1 errors). On the
2168-2194 (c) 2018 IEEE. Personal use is permitted, but republication/redistribution requires IEEE permission. See http://www.ieee.org/publications_standards/publications/rights/index.html for more information.
This article has been accepted for publication in a future issue of this journal, but has not been fully edited. Content may change prior to final publication. Citation information: DOI 10.1109/JBHI.2018.2844300, IEEE Journal of Biomedical and Health Informatics
> REPLACE THIS LINE WITH YOUR PAPER IDENTIFICATION NUMBER (DOUBLE-CLICK HERE TO EDIT) < other hand, if the decision is negative, the rate of erroneous rejection of the classifier is taken into account (i.e. number of type 2 errors divided by the number of True negatives). More specifically, the fused likelihood, Lf is defined as follows. 𝐿 =∏
𝐷
(16)
where Di are individual contributions of the available classifiers such that: if ui = 1 (17)
then 𝐷 = else 𝐷 =
The fused likelihood Lf, ranges from 0 to infinity. Values of Lf, less than 0 indicate that the presence of disease is negative. Values of Lf, greater than 1 indicate positive opinion about the presence of disease, such that the larger the Lf, the higher the chance for having it. Therefore, a threshold ßf which ranges between 1 to infinity is applied to make the final decision uf based on K classifiers such that, if Lf > ßf then uf = 1 else uf = 0
(18)
where uf is the decision of the fused classifiers. Determining the threshold values ßf can be done intuitively, based on calculations regarding the change of detection percentages [13], or based on more sophisticated algorithms that optimize the decision[12], or based on log likelihood which is widely used at the clinics. Referring back to Fig 1., if it is possible to obtain opinion from an expert physician after classification, then this opinion, ue, -which is either 1 or 0- can be used to update the parameters of each classifier Ci that participated in the decision using the following updates (shown as dashed line in Fig 2). 𝑁 𝑁 𝑁 𝑁
= 𝑁 = 𝑁 = 𝑁 = 𝑁
+ (1 − 𝑢 ) + 𝑢 + 𝑢 .𝑢 + 𝑢 . (1 − 𝑢 )
(19) (20) (21) (22)
True positive and false positive ratios should also be updated to reflect new detection rates. It is important to mention that, while this update changes the inferred efficiency of classifier Ci in detecting the disease, it does not require retraining the remotely based classifier with the recently collected data, to apply fusion for a new set of test data. Because the likelihood ratio is dependent only to Tp and Fp, ratios. If the features are saved at the local site,along with the decisions ui, ue, then these can be used at the site of the participating classifier for retraining procedures to be started in batch mode at a later time. Furthermore, this method allows to merge decisions from multiple sites, which may be operating remotely, by simple multiplication of the Di values obtained from the classifiers running at those sites, using the data from the same patient, but utilizing different features obtained from different data collection resources located elsewhere.
5
III. RESULTS After training several classifiers with 10-fold and 20-fold cross over for 35 subjects, we discarded the classifiers with accuracy less than 60%. As seen in Fig 1, classifiers C1, C3, C4 operated on connectivity data of the FTT, PAIN and MNS experiments, C2 operated on the channel data of the PAIN experiment and C5 operated on the pain tests and surveys reported in [18]. Parameters of the selected classifiers C1-C5 were as follows. In cubic kNN, k:10, distance metric: Minkowski, Exponent:3. In fine kNN, k:1, distance metric:Euclidean. In SVM, kernel: quadratic, polynomial:2, boxconstraint:1. We tested multiple ßi values, and computed associated Li. For each classifer Ci, we chose the ßi which returned the highest Li. The best values were 0.5 for ß1, ß2 ß3, ß5 and 0.7 for ß4. We presume that with more data available at the clinic, ßi can be trained in batch mode as suggested by [12]. Table 2 reports the sensitivity and specificity scores of the individual classifiers, after testing for 15 subjects, by arranging a dısjoınt test subset from the training subset. As seen from table 2, sensitivity ranges between 0.64-0.85 at the end of the training round. At the end of the test round which is performed after fusion, the TP rates of individual classifiers are updated with new data, but only a subtle improvement is obtained in sensitivity. Specificity of individual classifiers ranged between 0.73-0.92 at the end of the training round. After updating the FP rates of individual classifiers at the end of fusion, the specificity range of individual classifiers improved slightly to the 0.790.90 range. Fusion is performed by applying (16-18) and then deciding on uf based on the logarithm of Lf. We set ßf as 0.6, but optimally this should be arranged via some training, during retraining of the classifiers based on expert opinion, ue. Table 3 reports the sensitivity and specificity scores of our decision level fusion, by assuming availability of 2, 3, 4 and 5 classifiers. As seen from table 3, likelihood based fusion returns a sensitivity of 1.00 for several combinations of different classifiers. In terms of specificity, the upper range is 0.89 when there are less than 5 classifiers, but 1.00 if it is possible to utilize all of the classifiers. When the sensitivity values of the sets of classifiers presented in table 3 are aggregated so that average sensitivity Si is calculated for all fusion sets that contained Ci, the highest values were obtained for S3 and S4 as 0.90. This is expected since C3 represents connectivity in the pain matrix and C4 represents authentic activity of FM patients due to allodynia [23, 24]. Hence C3 and C4 lead the fusion more strongly than other classifiers. IV. DISCUSSION The fusion approach proposed in this study is similar to the method proposed in [12] for fusion of clinical data to detect breast cancer, fusion of EEG and pupil data to detect increased human performance at target detection task[14] and fusion of EEG and fNIRS data to detect stress of a human operator [15]. Our proposal was different from these with respect to the classifier detection rates, because we proposed to update likelihood values whenever expert opinion about the final decision is available, without waiting for retraining of individual classifiers.
2168-2194 (c) 2018 IEEE. Personal use is permitted, but republication/redistribution requires IEEE permission. See http://www.ieee.org/publications_standards/publications/rights/index.html for more information.
This article has been accepted for publication in a future issue of this journal, but has not been fully edited. Content may change prior to final publication. Citation information: DOI 10.1109/JBHI.2018.2844300, IEEE Journal of Biomedical and Health Informatics
> REPLACE THIS LINE WITH YOUR PAPER IDENTIFICATION NUMBER (DOUBLE-CLICK HERE TO EDIT) < A. FM classification To our best knowledge, this is the first study that uses functional connectivity metrics derived from fNIRs data as well as self-reports for diagnosis of FM. Table II. Performance of Classifiers in detection of FM (upper row: after training, lower row: updated after test) Type Features Sensitivity Specificity connectivity C1 Cubic 0.64 0.79 kNN 0.69 0.80 C2
Fine kNN
channel
C3
Quadratic SVM
connectivity
C4
LDA
connectivity
C5
Cubic kNN
clinical test and survey
0.84 0.74 0.85 0.86 0.83 0.81 0.73 0.79
0.79 0.80 0.73 0.79 0.74 0.80 0.92 0.90
Table III. Performance of Fused Classifiers in FM detection C1 C2 C3 C4 C5 sens spec 1
1
1 1
0.89
0.83
1.00
0.83
1.00
0.83
0.89
0.83
0.78
1.00
0.89
0.67
1.00
0.67
0.89
1
0.83
1.00
1
0.83
1.00
0.83
0.89
0.83
0.78
0.67
0.89
1.00
0.89
1
0.83
1.00
1
0.83
1.00
1
1
1 1
1
1
1
1
1 1
1
1 1 1
1
1
1
1
1
1 1 1
1
1
1
1
1
1 1
1
1
1
1
1.00
0.78
0.83
0.89
1
1
0.67
0.89
1
1
1
0.83
1.00
1
1
1
1
1
1
1
1
1 1
1 1
1 1
1
1
0.67 1
1.00
0.89
1
1.00
1.00
1
1
1.00
1.00
1
1
1
1.00
0.89
1
1
1
1.00
1.00
1
1
1
1.00
1.00
6
The performance figures we reported in detection of FM are superior to the ones reported in the literature. In [39] resting state functional connectivity data obtained from 50 participants is used to diagnose 17 FM, 16 RA, 17 HC participants. MVPA was used for extracting models to discriminate salience network and default mode network. Maximum accuracy to classify FM was obtained using SVM with linear kernel with regularization as %76. When painful and non-painful fMRI tasks were used along with logistic regression and SVM, patients and healthy controls were correctly classified with a maximum 93% accuracy, 92% sensitivity and 94% specificity by using a combined feature set [40]. There exists only one study in FM which includes comparison of classification performance using clinical and neuroimaging data [41]. In that study, several different classifiers including ANN, SVM, Naïve bayes, J48 decision tree, logistic regression and kNN were used to classify 14 FM, and 12 HC subjects using volumes of 56 different brain regions via structural MRI and self-report data including mood and pain intensity. While maximum accuracy of structural MRI based classification was close to 76% using the J48 classifier, maximum accuracy of self-report based classification was found to be 96%. In comparison to the aforementioned studies, we developed and applied a different concept to obtain a generalized decision for classification of FM. In our study, we utilized different FC metrics including cross correlation (CCA), seed-based correlation (SCA) and dynamic time warping (DTW) to obtain significantly different connections between the two subject groups, FM and HC. We trained four different classifiers for three different neuroimaging tasks (FTT, MNS, PAIN), three with connectivity data and one with channel data. In addition, we trained a separate classifier for self-reported data. The fusion method we used is more powerful than the other methods, not only because it outperforms them, but because it allows for making quick decisions based on the availability of features that drive individual classifiers. When the maximum likelihood based classifier is applied to the FM as a proof of concept, it detected the disease with a 100% sensitivity and specificity when 4 and 5 classifiers are fused. B. Data Imputation Sometimes data can be missing at random (for example, a sensor may fail due to power outage) [42]. Data loss is encountered more at the clinic, due to shortage of time in collecting a test, or due to inability of the patient to cooperate, or lack of availability of the diagnostic device for collecting data. In such cases, missing data can be an overbearing factor, reducing the performance of the classifier, during training or test. Several methods based on statistics, models and machine learning are proposed in [42] to reproduce missing data from the existing distribution of features. However these methods are more suitable for feature level fusion. The decision level fusion approach proposed in our framework is robust in its treatment of missing data, because when some classifiers turn off because of missing features, the classification process continues with the remaining classifiers. On the other hand, some of the features shared by multiple classifiers may be more important for prediction. Therefore multiple imputation can be used by
2168-2194 (c) 2018 IEEE. Personal use is permitted, but republication/redistribution requires IEEE permission. See http://www.ieee.org/publications_standards/publications/rights/index.html for more information.
This article has been accepted for publication in a future issue of this journal, but has not been fully edited. Content may change prior to final publication. Citation information: DOI 10.1109/JBHI.2018.2844300, IEEE Journal of Biomedical and Health Informatics
> REPLACE THIS LINE WITH YOUR PAPER IDENTIFICATION NUMBER (DOUBLE-CLICK HERE TO EDIT) < replacing each missing value with a set of plausible ones that represent the uncertainty about the right value to impute [42]. We adopted this approach to FM to generate more samples. C. Machine learning effect size Regardless of the better sensitivity and specificity figures we obtained in comparison to other methods in FM classification, we are aware of the limitations of the small sample sizes. In studies that contain small sample sizes, within-sample heterogeneity is minimized by recruiting patients with common characteristics, excluding nuisance factors that relate to age, education and other biological variability. Hence, studies with small sample sizes –like ours- report accuracies above 90% [43]. However, when tests are performed on independent samples in a larger cohort, for binary classification with linear classifiers, accuracies drop proportional to the logarithm of the proportion of shared features [43]. This is due to heterogeneity between samples among the independent training and test sets. Hence studies with smaller sample size may reach high prediction accuracy at the cost of lower generalizability. On the other hand, studies with large sample size have more generalization power, at the cost of lower accuracy. Features that are significantly different between groups may have less distinctive contribution to disease prediction. For a normally distributed feature among the groups to be classified, a large effect size (eg. 0.8) which is found to be highly significant may only lead to a modest detection rate just above 60%. Thereby, a new scale should be defined for interpretation of effect sizes in machine learning –or decision level fusion. For instance, accuracies that range from 60-70%, 70-80% and above 80% can be identified as modest, medium and large respectively. As reported in [43], the effect size in machine learning is large in small cohorts with 15-60 samples, and it drops exponentially as sample size increases. By using the decision level fusion approach proposed here, sample size can be increased on the go, with the update rules and batch mode retraining of the classifiers. Furthermore, heterogeneity can be accommodated by merging data across classifier sites. And in the meantime, accuracy can still be kept at a fair level, without sharp drops due to heterogeneous tests, because there are multiple classifiers, some of which are unaffected by the heterogeneity of the nuisance features. Our approach is in line with the call in [43], which states that ‘machine learning studies with larger samples should be conducted in order to be of diagnostic value. The time has come to make the step toward a next “generation” of machine learning studies, using large samples and/or independent validation samples and (re)use (smaller) studies. V. CONCLUSION We proposed a decision fusion approach based on likelihood for quick, reliable and feasible binary classification. In this framework, individual classifiers effect the final decision in an amount proportional to their rate of detection. Overall detection rate increases based on the number of classifiers that are available to participate in the decision. The system is fault tolerant, because even when some classifiers are unavailable, it can still make a feasible decision based on the existing classifiers. Decision fusion based on likelihood has another
7
advantage. Log of likelihood can be used to assign logistic levels of disease or confidence to the final decision. Hence the proposed system is relevant clinically. Expert opinion can be incorporated to the system we proposed. In general, the accuracy of the classifier drops in proportion to the interclass kappa (i.e. the rating consistency of the experts) [43]. If expert opinion is available on individual decisions, and if it is known that interclass kappa is high, it is possible to increase the detection rates of individual classifiers without running retraining but using the simple update rule we have suggested, to update the false positive and false negative numbers. Individual classifiers which are located at remote sites can be retrained later in batch mode, provided that the data contained at the local clinics are allowed to be uploaded elsewhere. This way, local data can be harvested globally, for building a larger cohort. Interoperability at the classifier level can be established by using apps that operate on mobile or remote platforms. Local clinics can be populated with several classifiers that utilize features driven from the resources available at their disposal. Remotely, multiple classifiers can be trained on disjoint patient populations at several different sites in the world. As soon as public access is provided to run the codes of these classifiers in test mode, local clinics can use them for detection tests. It is imperative that success at the clinic hinges on the widespread sharing of classifier applications. However, this scheme is contingent upon installation of patient privacy and secure cybernetic interoperability protocols. Currently there are ongoing efforts for data sharing [44] and tool sharing, but automatic classification attempts in neuroimaging are rather new [45]. If public access of remotely based classifiers is made a priority in the future, perhaps as a part of outsourcing neuroimaging data analysis [46], this simple and robust binary classification method can serve the community in clinical decision making. REFERENCES [1] [2]
[3] [4]
[5]
[6] [7]
[8]
O. Dekel, O. Shamir, and L. Xiao, "Learning to classify with missing and corrupted features," Machine Learning, journal article vol. 81, no. 2, pp. 149-178, November 01 2010. P. J. García-Laencina, J.-L. Sancho-Gómez, and A. R. FigueirasVidal, "Pattern classification with missing data: a review," Neural Computing and Applications, journal article vol. 19, no. 2, pp. 263282, March 01 2010. M. Mihara and I. Miyai, "Review of functional near-infrared spectroscopy in neurorehabilitation," Neurophotonics, vol. 3, no. 3, p. 031414, Jul 2016. M. Wolf, M. Ferrari, and V. Quaresima, "Progress of near-infrared spectroscopy and topography for brain and muscle clinical applications," J Biomed Opt, vol. 12, no. 6, p. 062104, Nov-Dec 2007. A. S. Bick, A. Mayer, and N. Levin, "From research to clinical practice: implementation of functional magnetic imaging and white matter tractography in the clinical environment," J Neurol Sci, vol. 312, no. 1-2, pp. 158-65, Jan 15 2012. B. C. Dickerson, "Advances in functional magnetic resonance imaging: technology and clinical applications," Neurotherapeutics, vol. 4, no. 3, pp. 360-70, Jul 2007. Y. Zhou, K. Wang, Y. Liu, M. Song, S. W. Song, and T. Jiang, "Spontaneous brain activity observed with functional magnetic resonance imaging as a potential biomarker in neuropsychiatric disorders," Cogn Neurodyn, vol. 4, no. 4, pp. 275-94, Dec 2010. Y. Bai, X. Xia, and X. Li, "A Review of Resting-State Electroencephalography Analysis in Disorders of Consciousness," Front Neurol, vol. 8, p. 471, 2017.
2168-2194 (c) 2018 IEEE. Personal use is permitted, but republication/redistribution requires IEEE permission. See http://www.ieee.org/publications_standards/publications/rights/index.html for more information.
This article has been accepted for publication in a future issue of this journal, but has not been fully edited. Content may change prior to final publication. Citation information: DOI 10.1109/JBHI.2018.2844300, IEEE Journal of Biomedical and Health Informatics
> REPLACE THIS LINE WITH YOUR PAPER IDENTIFICATION NUMBER (DOUBLE-CLICK HERE TO EDIT) < [9]
[10]
[11] [12]
[13] [14] [15] [16] [17]
[18]
[19]
[20] [21] [22] [23] [24]
[25]
[26] [27] [28] [29]
[30] [31]
J. M. Billings, M. Eder, W. C. Flood, D. S. Dhami, S. Natarajan, and C. T. Whitlow, "Machine Learning Applications to Resting-State Functional MR Imaging Analysis," Neuroimaging Clin N Am, vol. 27, no. 4, pp. 609-620, Nov 2017. J. Brakowski et al., "Resting state brain network function in major depression - Depression symptomatology, antidepressant treatment effects, future research," J Psychiatr Res, vol. 92, pp. 147-159, Sep 2017. J. Kittler, M. Hatef, R. P. W. Duin, and J. Matas, "On combining classifiers," IEEE Transactions on Pattern Analysis and Machine Intelligence, vol. 20, no. 3, pp. 226-239, 1998. J. L. Jesneck, L. W. Nolte, J. A. Baker, C. E. Floyd, and J. Y. Lo, "Optimized approach to decision fusion of heterogeneous data for breast cancer diagnosis," Med Phys, vol. 33, no. 8, pp. 2945-54, Aug 2006. S. McGee, "Simplifying likelihood ratios," J Gen Intern Med, vol. 17, no. 8, pp. 646-9, Aug 2002. M. Qian et al., "Decision-level fusion of EEG and pupil features for single-trial visual detection analysis," IEEE Trans Biomed Eng, vol. 56, no. 7, pp. 1929-37, Jul 2009. F. Al-Shargie, T. B. Tang, and M. Kiguchi, "Stress Assessment Based on Decision Fusion of EEG and fNIRS Signals," IEEE Access, vol. 5, pp. 19889-19896, 2017. D. J. Clauw, "Fibromyalgia: a clinical review," JAMA, vol. 311, no. 15, pp. 1547-55, Apr 16 2014. F. Wolfe et al., "The American College of Rheumatology 1990 Criteria for the Classification of Fibromyalgia. Report of the Multicenter Criteria Committee," Arthritis Rheum, vol. 33, no. 2, pp. 160-72, Feb 1990. F. Wolfe et al., "The American College of Rheumatology preliminary diagnostic criteria for fibromyalgia and measurement of symptom severity," Arthritis Care Res (Hoboken), vol. 62, no. 5, pp. 600-10, May 2010. B. Garcia-Zapirain, Y. Garcia-Chimeno, and H. Rogers, "Machine Learning Techniques for Automatic Classification of Patients with Fibromyalgia and Arthritis," International Journal of Computer Trends and Technology, vol. 25, no. 3, p. 4, 2015. R. H. Gracely and K. R. Ambrose, "Neuroimaging of fibromyalgia," Best Pract Res Clin Rheumatol, vol. 25, no. 2, pp. 271-84, Apr 2011. R. Staud, "Brain imaging in fibromyalgia syndrome," Clin Exp Rheumatol, vol. 29, no. 6 Suppl 69, pp. S109-17, Nov-Dec 2011. L. Jorge and E. Amaro, Jr., "Brain Imaging in Fibromyalgia," (in English), Current Pain and Headache Reports, vol. 16, no. 5, pp. 388-398, 2012/10/01 2012. A. Eken, D. Gokcay, C. Yilmaz, B. Baskak, A. Baltaci, and M. Kara, "Association of Fine Motor Loss and Allodynia in Fibromyalgia: An fNIRS Study," J Mot Behav, pp. 1-13, Dec 6 2017. A. Eken, M. Kara, B. Baskak, A. Baltaci, and D. Gokcay, "Differential efficiency of transcutaneous electrical nerve stimulation in dominant versus nondominant hands in fibromyalgia: placebo-controlled functional near-infrared spectroscopy study," Neurophotonics, vol. 5, no. 1, p. 011005, Jan 2018. R. H. Gracely, F. Petzke, J. M. Wolf, and D. J. Clauw, "Functional magnetic resonance imaging evidence of augmented pain processing in fibromyalgia," Arthritis Rheum, vol. 46, no. 5, pp. 1333-43, May 2002. D. B. Cook, G. Lange, D. S. Ciccone, W. C. Liu, J. Steffener, and B. H. Natelson, "Functional imaging of pain in patients with primary fibromyalgia," J Rheumatol, vol. 31, no. 2, pp. 364-78, Feb 2004. T. Giesecke et al., "Evidence of augmented central pain processing in idiopathic chronic low back pain," Arthritis Rheum, vol. 50, no. 2, pp. 613-23, Feb 2004. R. H. Gracely et al., "Pain catastrophizing and neural responses to pain among persons with fibromyalgia," Brain, vol. 127, no. Pt 4, pp. 835-43, Apr 2004. M. Burgmer, E. Pogatzki-Zahn, M. Gaubitz, E. Wessoleck, G. Heuft, and B. Pfleiderer, "Altered brain activity during pain processing in fibromyalgia," Neuroimage, vol. 44, no. 2, pp. 502-8, Jan 15 2009. J. Pujol et al., "Mapping brain response to pain in fibromyalgia patients using temporal analysis of FMRI," PLoS One, vol. 4, no. 4, p. e5224, 2009. A. V. Apkarian, M. C. Bushnell, R. D. Treede, and J. K. Zubieta, "Human brain mechanisms of pain perception and regulation in health and disease," Eur J Pain, vol. 9, no. 4, pp. 463-84, Aug 2005.
[32]
[33] [34] [35] [36] [37]
[38] [39]
[40] [41]
[42]
[43] [44] [45] [46]
8
H. Sakoe and S. Chiba, "Dynamic programming algorithm optimization for spoken word recognition," Acoustics, Speech and Signal Processing, IEEE Transactions on, vol. 26, no. 1, pp. 43-49, 1978. R. J. Meszlenyi, P. Hermann, K. Buza, V. Gal, and Z. Vidnyanszky, "Resting State fMRI Functional Connectivity Analysis Using Dynamic Time Warping," Front Neurosci, vol. 11, p. 75, 2017. F. R. Hampel, "A general qualitative definition of robustness," The Annals of Mathematical Statistics, pp. 1887-1896, 1971. F. R. Hampel, "The influence curve and its role in robust estimation," Journal of the American Statistical Association, vol. 69, no. 346, pp. 383-393, 1974. R. K. Pearson, Y. Neuvo, J. Astola, and M. Gabbouj, "Generalized Hampel Filters," EURASIP Journal on Advances in Signal Processing, journal article vol. 2016, no. 1, p. 87, August 05 2016. A. Krizhevsky, I. Sutskever, and G. E. Hinton, "ImageNet Classification with Deep Convolutional Neural Networks," (in English), Communications of the Acm, vol. 60, no. 6, pp. 84-90, Jun 2017. D. B. Rubin, "Multiple imputation after 18+ years," (in English), Journal of the American Statistical Association, vol. 91, no. 434, pp. 473-489, Jun 1996. B. Sundermann et al., "Diagnostic classification based on functional connectivity in chronic pain: model optimization in fibromyalgia and rheumatoid arthritis," Acad Radiol, vol. 21, no. 3, pp. 369-77, Mar 2014. M. Lopez-Sola et al., "Towards a neurophysiological signature for fibromyalgia," Pain, vol. 158, no. 1, pp. 34-47, Jan 2017. M. E. Robinson, A. M. O'Shea, J. G. Craggs, D. D. Price, J. E. Letzen, and R. Staud, "Comparison of machine classification algorithms for fibromyalgia: neuroimages versus self-report," J Pain, vol. 16, no. 5, pp. 472-7, May 2015. P. J. Garcia-Laencina, J. L. Sancho-Gomez, and A. R. FigueirasVidal, "Pattern classification with missing data: a review," (in English), Neural Computing & Applications, vol. 19, no. 2, pp. 263282, Mar 2010. H. G. Schnack and R. S. Kahn, "Detecting Neuroimaging Biomarkers for Psychiatric Disorders: Sample Size Matters," Front Psychiatry, vol. 7, p. 50, 2016. K. J. Gorgolewski et al., "The brain imaging data structure, a format for organizing and describing outputs of neuroimaging experiments," Sci Data, vol. 3, p. 160044, Jun 21 2016. J. V. Haxby, "Multivariate pattern analysis of fMRI: the early beginnings," Neuroimage, vol. 62, no. 2, pp. 852-5, Aug 15 2012. A. S. Dick and U. Hasson, "Outsourcing neuroimaging data analysis Implications for scientific accountability and issues in the public interest," Trends Cogn Sci, vol. 14, no. 1, pp. 2-4, Jan 2010.
Didem Gökçay graduated from the Electrical and Electronics Department of the Middle East Technical University with BS and MS degrees. She was a Fulbright scholar at the Department of Computer and Information Science and Engineering Department of University of Florida, where she obtained her PhD. Later she became a postdoctoral researcher at University of California, San Diego. She is the director of the MetuNeuro Lab and works as an assistant professor at the Department of Health Informatics at the Middle East Technical University, Informatics Institute. Her major field of study is cognitive and affective neuroscience. She uses fMRI, fNIRS, thermal camera and pupillary responses for studying the interaction between cognition and emotion.
2168-2194 (c) 2018 IEEE. Personal use is permitted, but republication/redistribution requires IEEE permission. See http://www.ieee.org/publications_standards/publications/rights/index.html for more information.
This article has been accepted for publication in a future issue of this journal, but has not been fully edited. Content may change prior to final publication. Citation information: DOI 10.1109/JBHI.2018.2844300, IEEE Journal of Biomedical and Health Informatics
> REPLACE THIS LINE WITH YOUR PAPER IDENTIFICATION NUMBER (DOUBLE-CLICK HERE TO EDIT)
REPLACE THIS LINE WITH YOUR PAPER IDENTIFICATION NUMBER (DOUBLE-CLICK HERE TO EDIT)