INTERNATIONAL JOURNAL OF MATHEMATICS AND COMPUTERS IN SIMULATION
Ensemble of Duo Output Neural Networks For Binary Classification Pawalai Kraipeerapun and Somkid Amornsamankul
Abstract— This paper presents an ensemble of duo output neural networks (DONN) using bagging technique to solve binary classification problems. DONN is a neural network that is trained to predict a pair of complementary outputs which are the truth and falsity values. Each component in an ensemble contains two DONNs in which the first network is trained to predict the truth and falsity outputs whereas the second network is trained to predict the falsity and truth outputs which are set in reverse order of the first one. In this paper, we propose classification techniques based on outputs obtained from DONNs. Also, the ensemble selection technique is proposed. This technique is created based on uncertainty and diversity values. All proposed techniques have been tested with three benchmarks UCI data sets, which are ionosphere, pima, and liver. It is found that the proposed ensemble techniques provide better results than those obtained from an ensemble of back propagation neural networks, an ensemble of complementary neural networks, a single pair of duo output neural networks, a single pair of complementary neural networks, and a back propagation neural network. Keywords— Binary classification problem, Ensemble neural network, Feed forward back propagation neural network, Complementary neural networks, Uncertainty.
I. I NTRODUCTION
I
N order to solve binary classification problems, several methods can be used. Examples of these methods are neural network, support vector machine (SVM), decision tree, naive bayesian classifier, etc. Neural networks was found to provide better classification accuracy than traditional statistical methods in various areas of applications such as business, finance, revenue, health, medicine, engineering, marketing, river monitoring, and Paleoceanography [1], [2], [3], [4], [5]. Even though SVM was found to provide better classification accuracy than neural network in some applications [6], neural network was also found to perform better than SVM in various tasks such as document classification [7], exudate classification [8], bio-activity classification [9], biological microscopic image classification [10], and learning disability diagnosis problem [11]. However, it is found that neural network is one of the most widely used methods used to solve the classification problem [12]. In order to classify the output obtained from Manuscript received November 5, 2010; revised November 5, 2010. This research project is supported by Faculty of Science, Mahidol University. P. Kraipeerapun is with Department of Computer Science, Faculty of Science, Ramkhamhaeng University, Bangkok, Thailand (email:
[email protected]) S. Amornsamankul is with Department of Mathematics, Faculty of Science, Mahidol University, and is with Centre of Excellence in Mathematics, CHE, Bangkok, Thailand (email:
[email protected])
Issue 4, Volume 4, 2010
neural network, one of the most well known techniques is applying a threshold value. The threshold value must be preset before making binary classification in order to examine whether the output exceed the threshold or not. This technique can cause vagueness in the classification since the output obtained from neural network is always uncertain. It is not exactly the truth output. Therefore, it would be better if we can deal with both truth and falsity output of a neural network for each input pattern. A neural network with multiple outputs can be applied to support this idea. Instead of dealing only with the truth output, a neural network trained to predict both truth and falsity outputs is considered. Instead of using only truth target values, complement of truth target values called falsity target values are also considered. A neural network trained with both truth and falsity target values will provide both truth and falsity outputs. This method was created in [13] and named duo output neural network (DONN). A pair of duo output neural networks were created to solve a single output regression problem. One neural network was trained using reverse order of target values used in another neural network. The aggregation of outputs obtained from these two duo output neural networks was found to provide better performance when compared to backpropagation neural networks and support vector regression with linear, polynomial, and radial basis function kernels. Furthermore, an ensemble of pairs of duo output neural networks was also found to provide better result than a single pair of duo output neural networks for a single output regression problem [14]. Therefore, this paper aims to apply an ensemble of duo output neural networks to solve binary classification problems. Its results will also be compared to a single pair of duo output neural networks. In general, in order to create an ensemble, several neural networks must be trained and all outputs obtained from these neural networks are aggregated. A diverse ensemble of less accurate classifiers was found to perform better than an ensemble of more accurate classifiers but with less diversity [15]. There are several techniques used to create a diverse ensemble neural network. One of the most widely used techniques is varying neural network parameter values such as initial weights, number of hidden nodes, and number of input features. Another technique is varying training data in different manners. In order to varying training data, bagging technique can be used. Bagging applies bootstrap resampling to create several training sets [16]. Furthermore, diversity can also be manipulated based on output of the ensemble. Varying output of neural network can also increase diversity. One technique is that the use of duo output neural network since it applies both truth and falsity outputs.
162
INTERNATIONAL JOURNAL OF MATHEMATICS AND COMPUTERS IN SIMULATION
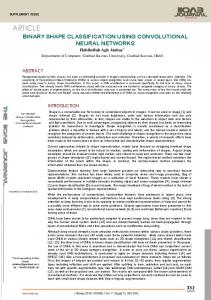
Truth output
Target output
Target output
(Tt arg et )
NN
(Tt arg et )
Truth output
(Ttrain1 )
NN1
(Ttrain )
Falsity output
( Ftrain1 ) Training data
Training data
Falsity output
NN 2 Fig. 1.
( Ftrain 2 )
Neural network for binary classification. (Training Phase) Complement of target output
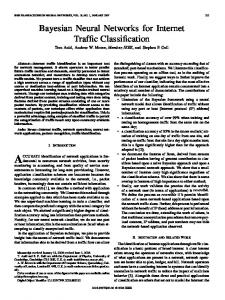
In this paper, we divide the experiment into two parts. First, a single pairs of neural networks is created and three proposed classification techniques are applied. Second, we apply an ensemble of duo output neural networks and bagging technique to solve the binary classification problems. In the ensemble, two duo output neural networks are created in each component of the ensemble in which one neural network is trained using reverse order of target values used in another neural network. We also propose two classification techniques based on outputs obtained from the ensemble. Moreover, we can compute uncertainty and diversity in the classification based on truth and falsity outputs obtained from the ensemble. Both uncertainty and diversity are then used to identify level of confidence in order to select the right ensemble among several ensembles created in the experiment. We test our experiment based on three classical benchmark problems including ionosphere, pima, and liver from the UCI machine learning repository [17]. The rest of this paper is organized as follows. Section II describes the basic concept of creating a pair of duo output neural networks and three proposed classification techniques. Section III describes an ensemble of duo output neural networks and the proposed classification techniques used to classify outputs from an ensemble of duo output neural networks. The ensemble selection based on uncertainty and diversity is also proposed in this section. Section IV describes data sets and results of our experiments. Conclusions and future works are presented in Section V. II. D UO O UTPUT N EURAL N ETWORK FOR B INARY C LASSIFICATION In traditional feedforward backpropagation neural network, only truth target values are used to train neural networks to predict truth outputs as shown in Fig. 1. However, the complement of the truth value which is the falsity value can occur in real world situations as well. Therefore, this paper also consider falsity target values together with truth target values in training process. In this case, we can create a feedforward backprogation neural network that is trained to provide two complementary outputs which are truth and falsity values. Let Ttarget (xi ) be the truth target value for the input pattern xi , i = 1, 2, 3, ..., n where n is the total number of training input patterns. Let Ftarget (xi ) be the falsity target value for the input pattern xi . The falsity target value is considered as the complement of the truth target value. The falsity target value can be computed as follows. Issue 4, Volume 4, 2010
Truth output
(Ttrain 2 )
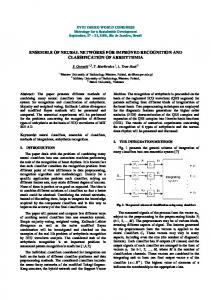
( Ft arg et ) Fig. 2. Duo output neural network for binary classification. (Training Phase)
Truth output
NN1
(T1 ) Falsity output
( F1 ) Unknown data
Falsity output
NN 2
( F2 )
A g g r e g a t i o n
Output
Truth output
(T2 ) Fig. 3.
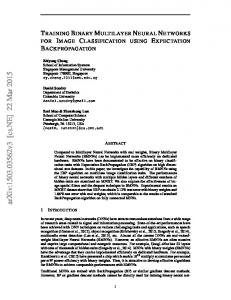
Duo output neural network for binary classification. (Testing Phase)
Ftarget (xi ) = 1 − Ttarget (xi )
(1)
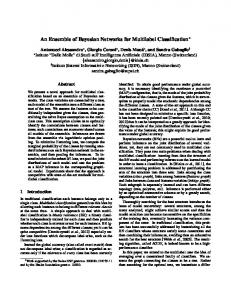
Duo output neural network can be created in two circumstances according to the sequence of truth and falsity target values used to train a neural network. In order to take advantages of both circumstances, a pair of duo output neural networks is created. Fig. 2 shows a pair of duo output neural networks in training phase. N N1 is a feedforward backpropagation neural network trained to predict the truth output (Ttrain1 ) and the falsity output (Ftrain1 ). N N2 is also a feedforward backpropagation neural network trained to predict the falsity output (Ftrain2 ) and the truth output (Ttrain2 ). Both networks are created based on the same architecture and parameters. Also, they apply the same input pattern data. However, they are trained using different order of truth and falsity target values. In Fig. 3, the unknown input pattern yk is assigned to a pair of duo output neural networks in the testing phase where k = 1, 2, 3, ..., t and t is the total number of unknown input patterns. Let T1 (yk ) and F1 (yk ) be the truth and the falsity outputs for the unknown input pattern yk of the first neural network (N N1 ). These two outputs can be aggregated in two aspects: the average truth output (Ta (yk )) and the average falsity output (Fa (yk )). Both average outputs can be defined as follows.
163
INTERNATIONAL JOURNAL OF MATHEMATICS AND COMPUTERS IN SIMULATION
Ta (yk ) =
T1 (yk ) + (1 − F1 (yk )) 2
(2)
Target output
T2 (yk ) + (1 − F2 (yk )) 2
(4)
F2 (yk ) + (1 − T2 (yk )) (5) 2 Instead of using only the truth output for binary classification, both truth and falsity values can be applied. The binary classification techniques described in this paper are created based on the classification techniques used in [18]. In [18], a pair of feedforward backpropagation neural networks were created in which the first network is trained to predict only the truth output whereas the second network is trained to predict only the falsity output (see Fig. 4). This technique was named complementary neural network. In order to classify each input pattern, both truth and falsity outputs were compared. If the truth output is greater than the falsity output then the input pattern is classified as a value 1. Otherwise, it is classified as a value 0. In this paper, the truth and falsity outputs which are Ta , Tb , Fa , and Fb can be used. Three classification techniques are proposed and described below. 1) For each input pattern yk , if Ta (yk ) > Fb (yk ) then the input pattern yk is classified as a value 1 else the input pattern yk is classified as a value 0.
Truth output
(T )
F1 (yk ) + (1 − T1 (yk )) Fa (yk ) = (3) 2 Let F2 (yk ) and T2 (yk ) be the falsity and the truth outputs for the unknown input pattern yk of the second neural network (N N2 ). The average truth output (Tb (yk )) and the average falsity output (Fb (yk )) can be computed as follows. Tb (yk ) =
NNT
(Tt arg et )
Training data
NN F
Falsity output
(F ) Complement of target output
( Ft arg et ) Fig. 4.
Complementary neural network for binary classification.
Fb (yk ) =
2) For each input pattern yk , if Tb (yk ) > Fa (yk ) then the input pattern yk is classified as a value 1 else the input pattern yk is classified as a value 0. 3) For each input pattern yk , b (yk ) > 0.5 then if Ta (yk )+T 2 the input pattern yk is classified as a value 1 else the input pattern yk is classified as a value 0. The truth and falsity outputs obtained from a pair of duo output neural networks can be used to quantify uncertainty in the classification. Let U (yk ) be an uncertainty value in the classification of input pattern yk . U (yk ) can be computed as follows.
U (yk ) = 1 − |Ta (yk ) − Fb (yk )| or Issue 4, Volume 4, 2010
(6)
U (yk ) = 1 − |Tb (yk ) − Fa (yk )|
(7)
From our experiment in section IV, it is found that three proposed classification techniques provide the same results. These techniques can be used interchangeably. Uncertainty in the classification can be computed from equations (6) and (7) interchangeably as well. Degree of uncertainty obtained from a pair of duo output neural network can be used to identify level of confidence in order to belief that whether the input pattern is classified into the correct class or not. If the difference between the truth and falsity is high then the degree of uncertainty is low. On the other hand, if the difference is low then the degree of uncertainty is high. Uncertainty information obtained from the classification can be used to support users for selecting a proper classifier. III. BAGGING
OF
D UO O UTPUT N EURAL N ETWORKS
In this paper, we apply bagging of duo output neural networks (DONNs) that was proposed in [14] to the problem of binary classification. Bagging of DONNs can be described as follows. In bagging algorithm, multiple training sets are created based on bootstrap resampling in which each training set or bag is generated by random with replacement of input patterns from the original training data set. All training sets have the same size as the original training set; however, the sequence of patterns are different. Also, some original patterns may be repeated and some may not be included in each generated training set. In order to create bagging of DONNs in the training phase, m pairs of neural networks are trained based on m training sets created using bootstrap resampling. Each pair of neural networks apply the same training data and target outputs. They are also created based on the same architecture. The first network is trained using truth target and falsity target values to predict two outputs which are truth and falsity j j outputs. Let Ttarget (xi ) and Ftarget (xi ) be the truth target and falsity target values of the j-th component for the input pattern xi , i = 1, 2, 3, ..., n where n is the total number of training input patterns and j = 1, 2, 3, ..., m where m is the total number of components in the ensemble. The falsity target j j value, Ftarget (xi ), is computed as 1−Ttarget (xi ). The second j j network is trained using Ftarget (xi ) and Ttarget (xi ) to predict
164
INTERNATIONAL JOURNAL OF MATHEMATICS AND COMPUTERS IN SIMULATION
The average truth output and the average falsity output are compared in each component in the ensemble. If j j Tavg (yk ) > Favg (yk ) then the pattern yk of the j-th component is classified as a value 1. Otherwise, it is classified as a value 0. After that, the majority vote is then applied to classify outputs obtained from all components of the ensemble. If at least half of the outputs yield a value 1 then the pattern is classified as a value 1. Otherwise, it is classified as a value 0.
falsity and truth outputs which are sequenced in reverse order of outputs obtained from the first network. In the testing phase, the unknown input pattern yk is assigned to each component in the ensemble where k = 1, 2, 3, ..., t and t is the total number of unknown input patterns. Let T1j (yk ) and F1j (yk ) be the truth and falsity outputs obtained from the first neural network of the j-th component. The truth and the non-falsity outputs can be aggregated to provide the average truth output as shown in the equation below. j Tavg (yk ) =
T1j (yk ) + (1 − F1j (yk )) 2
(8)
Let F2j (yk ) and T2j (yk ) be the falsity and truth outputs obtained from the second neural network of the j-th component. The average falsity output can be computed from the falsity and non-truth outputs as follows. F2j (yk ) + (1 − T2j (yk )) (9) 2 In order to compute uncertainty in the classification, the average truth and the average falsity outputs obtained from each component in the ensemble are used. Let Uj (yk ) be an uncertainty value of the input pattern yk in the j-th component. Uj (yk ) can be computed as follows. j Favg (yk ) =
j j Uj (yk ) = 1 − |Tavg (yk ) − Favg (yk )|
Furthermore, uncertainty in the classification can be used to support the selection of the right ensemble from several ensembles created in the experiment. In order to choose the high generalization performance ensemble, accuracy and diversity of classifiers in each ensemble are considered based on uncertainty occurred in the classification. As we know that two classifiers are diverse if both classifiers produce different amount of output errors based on new input data [19]. In this paper, diversity of the ensemble is then proposed as the difference among uncertainty values of all classifiers in the ensemble. If the difference is high then the diversity is also high. Let Ar be an average of all uncertainties in the r-th ensemble where r = 1, 2, 3, ..., s and s is the total number of ensembles. Let Dr be a diversity value of the r-th ensemble in which Dr is an average of the difference among all uncertainty values occurred in the r-th ensemble. Ar and Dr can be defined as follows.
(10)
Degree of uncertainty obtained from all components in the ensemble for each input pattern can be used to decide whether the input pattern is classified into the correct class or not. Let E(yk ) be an uncertainty value of the input pattern yk . Therefore, E(yk ) can be calculated as follows. Pm j=1 Uj (yk ) (11) E(yk ) = m Two proposed classification techniques created based on averaging and majority vote are described as follows. 1) Averaging The average truth outputs obtained from all components are again averaged. The average falsity outputs obtained from all components are also averaged. Let Tavg (yk ) and Favg (yk ) be the truth and falsity outputs obtained from double average, respectively. These two values can be defined as follows. Pm j j=1 Tavg (yk ) Tavg (yk ) = (12) m Pm j j=1 Favg (yk ) (13) Favg (yk ) = m After that, these two values are compared in order to classify the pattern into a binary class. If Tavg (yk ) > Favg (yk ) then the pattern is classified as a value 1. Otherwise, it is classified as a value 0.
Pm
j=1
Ar =
Dr =
Pm
l,h=1
Vj
(14)
m |Vl − Vh |
m(m − 1)/2
;
l 6= h
where Vj =
Pt
k=1
Uj (yk ) t
(16)
As we know that a diverse ensemble of less accurate classifiers provides better performance than an ensemble of more accurate classifiers but with less diversity [15]. Therefore, we propose two steps to select the right ensemble from a set of ensembles. First, we select the subset of ensembles that have uncertainty values less than the average uncertainty value obtained from all ensembles. After that we choose the ensemble that has the highest diversity from those selected ensembles. Let Aavg be the average uncertainty obtained from all ensembles. Hence, Aavg can be computed as follows. Aavg =
Ps
r=1
Ar
s
Therefore, the r-th ensemble will be selected if Dr = max{Di } and Ai < Aavg where i = 1, 2, ..., s.
2) Majority vote Issue 4, Volume 4, 2010
(15)
165
(17)
INTERNATIONAL JOURNAL OF MATHEMATICS AND COMPUTERS IN SIMULATION TABLE II
IV. E XPERIMENTS
AVERAGE CLASSIFICATION ACCURACY OBTAINED FROM THE TEST DATA
A. Data Sets
SET
Three benchmarking UCI data sets [17], which are ionosphere, liver, and pima are used in this experiment. The characteristics of these data sets can be shown in Table I.
Method BPNN: T > 0.5 CMTNN: T >F DONN: Ta > Fb Tb > Fa Ta +Tb > 0.5 2
TABLE I UCI DATA SETS USED IN THIS STUDY Name Feature type No. of classes No. of features Sample set size Training set size Testing set size
Ionosphere numeric 2 34 351 200 151
Pima numeric 2 8 768 576 192
Liver numeric 2 6 345 276 69
Pima %correct
Liver %correct
93.54
70.49
62.68
96.42
74.74
66.52
96.52 96.52 96.52
77.92 77.92 77.92
70.22 70.22 70.22
TABLE III T HE PERCENT IMPROVEMENT OF THE PROPOSED DONN COMPARED TO BPNN AND CMTNN. Method
B. Experimental Methodology and Results
BPNN: T > 0.5 CMTNN: T >F
We separate the experiment into two parts, which are a single pair of duo output neural networks and an ensemble of duo output neural networks. 1) A single Pair of Duo Output Neural Network In our experiment, each data set is applied to three types of neural network which are backpropogation neural network (BPNN), complementary neural network (CMTNN), and our proposed duo output neural network (DONN). In order to compare results obtained from those three methods, all environments are fixed for all methods. For BPNN, twenty feedforward backpropagation neural networks are trained with twenty different randomized training sets for each data set. For CMTNN, twenty pair of feedforward backpropagation neural networks are trained with the same twenty training sets used for BPNN for each data set. For our proposed neural network, twenty pair of DONNs are also trained with the same twenty training sets used for BPNN for each data set. All networks are having the same parameter values in terms of the network architecture and they are initialized with the same random weights. the number of input-nodes is equal to the number of input features, which is 34, 8, and 6 for ionosphere, pima, and liver data sets, respectively. They have one hidden layer constituting of 2n neurons where n is the number of input features. Hence, the number of neuron in the hidden layer for those data sets are 68, 16, and 12, respectively. Table V shows the comparison among average classification accuracy obtained from twenty set of BPNN, CMTNN, and DONN for each test set of ionosphere, pima, and liver. It can be argued that the integration of both truth and falsity values in the prediction can provide better classification accuracy when compared to the prediction involved only in the truth values. It can be seen that both CMTNN and DONN can provide better performance than BPNN. Moreover, it is also found that a pair of neural network with multiple outputs (truth and falsity values) can provide better accuracy than a pair of neural network with single output dealing only with the truth values for one network and applying only falsity values to another network. Therefore, it is found that the results obtained from Issue 4, Volume 4, 2010
Ionosphere %correct
DONN (%improvement) Ionosphere Pima Liver 3.19
10.53
12.56
0.10
4.25
5.56
the proposed DONN outperform the results obtained from BPNN and CMTNN. Table VI shows the percent improvement of the proposed DONN compared to BPNN and CMTNN. From our experiment, it can be concluded that the proposed classification techniques using Ta > Fb , Tb > Fa b > 0.5 are found to provide the same results for and Ta +T 2 each test set used in this study. Therefore, we can use these three techniques interchangeably. Moreover, uncertainty in the classification can be computed based on Ta and Fb using equation (6). Table IV shows the ranges of uncertainty values in the classification of pima data set. One of twenty sets of pima used in the experiment is shown. Uncertainty values are grouped into three levels each with an equal range. The total number of correct and incorrect outputs in each range are shown together with their percentage of correct classification. It can be seen that the proportion of the percentage of the correct outputs in each group conforming to the level of uncertainty in which the more correct outputs, the less uncertainty. 2) An Ensemble of Duo Output Neural Networks The focus of this experiment is to explore the accuracy improvement of the binary classification. Results obtained from our proposed bagging of DONNs will be compared to results obtained from [18] which are bagging of backpropaga-
166
TABLE IV U NCERTAINTY LEVEL OBTAINED FROM A PAIR OF DONN FOR THE TEST SET OF PIMA DATA .
Uncertainty value level 0.68-0.99 High 0.36-0.67 Med 0.05-0.35 Low Total
Number of patterns correct incorrect 23 23 45 18 77 6 145 47
%correct 50.00 71.43 92.77 75.52
INTERNATIONAL JOURNAL OF MATHEMATICS AND COMPUTERS IN SIMULATION TABLE V AVERAGE CLASSIFICATION ACCURACY OBTAINED FROM THE TEST DATA 100
Ensemble
93.54
70.49
62.68
96.42
74.74
66.52
96.52
77.92
70.22
96.56
77.16
69.93
97.55 97.52
77.81 77.66
74.64 73.99
97.38 97.42
79.66 79.40
76.30 76.23
99 98 97
95 94 93 92 91 90
1
2
3
4
5
6
7
8
Technique
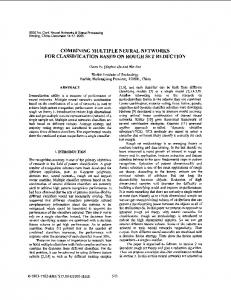
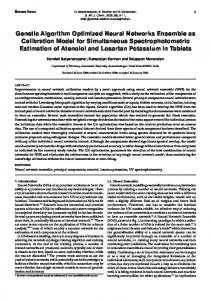
tion neural networks (BPNNs) and bagging of complementary neural networks (CMTNNs). Moreover, our results will also be compared to a single pair of DONNs, a single pair of CMTNNs, and a traditional BPNN obtained from previous section. In CMTNN, a pair of neural networks is trained separately to predict the truth and falsity outputs whereas a pair of duo output neural networks is trained to predict both outputs at the same time. All networks created in each ensemble are having the same parameter values in terms of the network architecture as those created in [18] which is also the same as those created in the previous section. They are initialized with the same random weights. Also, the same set of bags are applied to all machines. Each data set is randomly split into a training set and a testing set as shown in table I. In order to show that our approach provides better performance than other techniques, twenty ensembles each with thirty components are created. All ensembles have the same architecture; however, they are trained with different sets of bag. We consider the average of twenty results obtained from twenty ensembles instead of considering only one ensemble. For each ensemble, thirty bags are created using bootstrap resampling with replacement. For each component, a pair of duo output neural networks is trained. Each neural network contains the number of input-nodes equal to the number of input features, which is 34, 8, and 6 for ionosphere, pima, and liver data sets, respectively. They have one hidden layer constituting of 2n neurons where n is the number of input features. Table V shows the comparison among average classification accuracy results obtained from twenty sets of our proposed ensemble of DONNs and the results obtained from [18] which are an ensemble of BPNNs and an ensemble of CMTNNs. The results obtained from the previous section which are a single pair of DONNs, a single pair of CMTNNs, and a traditional BPNN are also shown in this table. The graphical comparison among results obtained from these techniques for the test set of ionosphere, pima, and liver can be portrayed in Fig. 5, 6, and 7, respectively. Table VI shows the percent improvement of the proposed ensemble of DONNs based on averaging classification technique compared to other single and ensemble techniques. It can be seen that the ensemble of DONNs based on Issue 4, Volume 4, 2010
96
%Correct
BPNN: T > 0.5 CMTNN: T >F DONN: T >F BPNN: T > 0.5 CMTNN: averaging majority vote DONN: averaging majority vote
Liver %correct
Fig. 5. The comparison among results obtained from (1) BPNN, (2) CMTNN, (3) DONN, (4) Ensemble of BPNNs, (5) Ensemble of CMTNNs: Averaging, (6) Ensemble of CMTNNs: Majority vote, (7) Ensemble of DONNs: Averaging, and (8) Ensemble of DONNs: Majority vote for the test set of ionosphere
80 78 76 74
%Correct
Single
Pima %correct
72 70 68 66 64 62 60
1
2
3
4
5
6
7
8
Technique
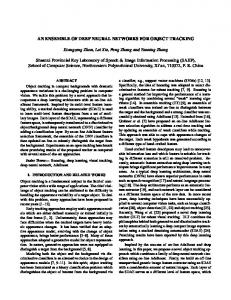
Fig. 6. The comparison among results obtained from (1) BPNN, (2) CMTNN, (3) DONN, (4) Ensemble of BPNNs, (5) Ensemble of CMTNNs: Averaging, (6) Ensemble of CMTNNs: Majority vote, (7) Ensemble of DONNs: Averaging, and (8) Ensemble of DONNs: Majority vote for the test set of pima
80 78 76 74
%Correct
Method
Ionosphere %correct
72 70 68 66 64 62 60
1
2
3
4
5
6
7
8
Technique
Fig. 7. The comparison among results obtained from (1) BPNN, (2) CMTNN, (3) DONN, (4) Ensemble of BPNNs, (5) Ensemble of CMTNNs: Averaging, (6) Ensemble of CMTNNs: Majority vote, (7) Ensemble of DONNs: Averaging, and (8) Ensemble of DONNs: Majority vote for the test set of liver
167
INTERNATIONAL JOURNAL OF MATHEMATICS AND COMPUTERS IN SIMULATION TABLE VI
TABLE VII
T HE PERCENT IMPROVEMENT OF THE PROPOSED ENSEMBLE OF DONN S
U NCERTAINTY AND DIVERSITY OBTAINED FROM ENSEMBLES OF
BASED ON AVERAGING TECHNIQUE COMPARED TO OTHER TECHNIQUES
IONOSPHERE DATA SET
Method Single
Ensemble
BPNN: T > 0.5 CMTNN: T >F DONN: T >F BPNN: T > 0.5 CMTNN: averaging majority vote DONN: majority vote
4.11
13.01
21.73
1.00
6.58
14.70
0.89
2.23
8.66
0.85
3.24
9.11
-0.17 -0.14
2.38 2.58
2.22 3.12
-0.04
0.33
0.09
averaging technique provides the best results for pima and liver data set. It is approximately 2.6% better than the results obtained from the ensemble of CMTNNs and approximately 6% better than the ensemble of BPNNs. On the other hand, the ensemble of DONNs and the ensemble of CMTNNs provide quite similar results for ionosphere data set. The ensemble of CMTNNs provides approximately 0.15% better than the ensemble of DONNs. Therefore, it can be concluded that the results obtained from the proposed ensemble of DONNs outperform the results obtained from an ensemble of BPNNs and an ensemble of CMTNNs. It also provides better performance than a single pair of DONNs, a single pair of CMTNNs, and a traditional BPNN. From our proposed ensemble selection technique described in section III, the ensemble can be chosen based on diversity and uncertainty values. In this experiment, we have twenty ensembles. Thus, we will pick an ensemble that has the highest diversity and its uncertainty is less than the average uncertainty obtained from all twenty ensembles. Table VII, VIII and IX show relationships between uncertainty and diversity obtained from ensembles of ionosphere, pima, and liver data sets, respectively. They are sequenced by uncertainty values in an ascending order. The average uncertainties obtained from each data set are 0.2610, 0.4636, and 0.6136, respectively. Table X shows the average percent correct of the ensembles that have uncertainty lower and higher than the average uncertainty as well as the average percent correct of the ensembles that have diversity lower and higher than the average diversity. It can be seen that the ensembles with lower average uncertainty and the ensembles with higher average diversity provide better performance than those with higher average uncertainty and lower average diversity, respectively. These results conform to our proposed ensemble selection technique. Therefore, we apply our proposed selection technique to select the right ensemble. Hence, the selected ensembles for ionosphere, pima, and liver data sets are the ensemble 11, 7, and 7, respectively. It can be noted that the selected ensemble from each data set may not be the best answer; however, it is equal to or better than the average ensemble as described in table XI. As Issue 4, Volume 4, 2010
Ensemble 1 2 3 4 5 6 7 8 9 10 11 12 13 14 15 16 17 18 19 20
Ensemble of DONNs (Averaging) %improvement Ionosphere Pima Liver
Uncertainty 0.2123 0.2292 0.2295 0.2392 0.2397 0.2420 0.2458 0.2476 0.2488 0.2602 0.2604 0.2647 0.2663 0.2677 0.2743 0.2743 0.2930 0.2949 0.3112 0.3184
Diversity 0.1108 0.0880 0.1176 0.1114 0.1400 0.1238 0.1165 0.1384 0.1490 0.1186 0.1560 0.1820 0.1345 0.1411 0.1872 0.1906 0.1553 0.1757 0.2213 0.2023
%Correct 97.35 97.35 97.35 98.01 97.35 96.69 97.35 97.35 97.35 98.01 97.35 97.35 96.69 97.35 97.35 98.01 97.35 98.01 96.69 97.35
TABLE VIII U NCERTAINTY AND DIVERSITY OBTAINED FROM ENSEMBLES OF PIMA DATA SET
Ensemble 1 2 3 4 5 6 7 8 9 10 11 12 13 14 15 16 17 18 19 20
Uncertainty 0.4465 0.4473 0.4530 0.4549 0.4557 0.4598 0.4598 0.4616 0.4632 0.4632 0.4638 0.4672 0.4673 0.4678 0.4682 0.4696 0.4706 0.4746 0.4776 0.4804
Diversity 0.0586 0.0491 0.0442 0.0479 0.0505 0.0540 0.0691 0.0646 0.0548 0.0592 0.0555 0.0541 0.0546 0.0505 0.0558 0.0572 0.0630 0.0607 0.0467 0.0436
%Correct 78.65 79.69 79.69 80.21 80.21 80.21 80.73 79.69 80.21 80.73 79.69 79.69 78.65 78.65 79.69 79.17 79.69 79.69 79.17 79.17
we know that the best ensemble in the test phase may not be the best ensemble in the real situation. Also, if we create ten ensembles in the real world, we cannot guess that which one is the best ensemble. Therefore, the purpose of our proposed technique does not provide the optimization result; however, it gives us the high possibility that the predicted results of the selected ensemble will be equal to or better than the average result of all ensembles if we select the ensemble based on both uncertainty and diversity values. After the ensemble is selected, we can examine each input pattern whether it is correctly classified or not. Uncertainty of each input pattern can be computed using Equation (11). Table XII shows the ranges of uncertainty values of the selected ensemble of pima data set. Uncertainty values are grouped into three levels each with an equal range. The total number of correct and incorrect outputs in each range are
168
INTERNATIONAL JOURNAL OF MATHEMATICS AND COMPUTERS IN SIMULATION TABLE IX
TABLE XII
U NCERTAINTY AND DIVERSITY OBTAINED FROM ENSEMBLES OF LIVER
U NCERTAINTY LEVEL OBTAINED FROM AN ENSEMBLE OF PAIRS OF DONN S FOR THE TEST SET OF PIMA DATA .
DATA SET
Ensemble 1 2 3 4 5 6 7 8 9 10 11 12 13 14 15 16 17 18 19 20
Uncertainty 0.5702 0.5944 0.5960 0.5977 0.6086 0.6086 0.6098 0.6104 0.6127 0.6128 0.6145 0.6169 0.6169 0.6198 0.6223 0.6241 0.6305 0.6322 0.6327 0.6418
Diversity 0.1095 0.1220 0.1184 0.1276 0.1207 0.1321 0.1546 0.1182 0.0836 0.1351 0.1210 0.1144 0.1239 0.1241 0.1438 0.1280 0.1159 0.1177 0.1476 0.1480
%Correct 79.71 78.26 76.81 79.71 76.81 76.81 76.81 76.81 76.81 73.91 75.36 81.16 73.91 73.91 76.81 76.81 71.01 76.81 73.91 73.91
Uncertainty value level 0.57-0.83 High 0.31-0.56 Med 0.04-0.30 Low Total
lower average uncertainty higher average uncertainty lower average diversity higher average diversity
Pima %correct 80 79.32 79.53 79.79
Liver %correct 77.25 75.36 76.96 75.65
shown together with their percentage of correct classification. It can be seen that the pattern with low uncertainty value has high possibility to be classified correctly. Therefore, the pattern that has high uncertainty value may have to be revisited. V. C ONCLUSION This paper has applied a single pair of duo output neural network and an ensemble of pairs of duo output neural networks based on bagging technique to solve binary classification problems. In each pair, the first duo output neural network is trained to predict a pair of truth and falsity outputs whereas the second duo output neural network is trained to predict a pair of falsity and truth outputs which are organized in reverse order of the first one. The proposed approached are tested based on three UCI data sets. It is found that the proposed approach provide better performance than an ensemble of backpropagation neural networks and an ensemble of complementary neural networks. It is also better than a TABLE XI T HE COMPARISON BETWEEN RESULTS OBTAINED FROM THE SELECTED ENSEMBLES AND RESULTS OBTAINED FROM OTHER ENSEMBLES
Ensemble the the the the
best ensemble worse ensemble average ensemble selected ensemble
Ionosphere %correct 98.01 96.69 97.38 97.35
Issue 4, Volume 4, 2010
Pima %correct 80.73 78.65 79.66 80.73
Liver %correct 81.16 71.01 76.30 76.81
69.74 78.18 96.72 80.73
R EFERENCES
T HE AVERAGE RESULTS COMPARISON Ionosphere %correct 97.42 97.35 97.35 97.42
%correct
single pair of duo output neural networks, a single pair of complementary neural networks, and a traditional backpropagation neural network. Uncertainties in the classification can also be quantified. Diversity can be computed based on these uncertainties. Therefore, both diversity and uncertainty can be used to support decision making in the ensemble selection process. In the future, we will apply our approach to multiclass classification problems.
TABLE X
Ensemble
Number of patterns correct incorrect 53 23 43 12 59 2 155 37
[1] B. A. Malmgren, M. Kucera, J. Nyberg, and C. Waelbroeck, “Comparison of Statistical and Artificial Neural Network Techniques for Estimating Past Sea Surface Temperatures from Planktonic Foraminifer Census Data,” Paleoceanography, vol. 16, no. 5, pp. 520–530, 2001. [2] Y.-M. Wang, S. Traore, and T. Kerh, “Monitoring Event-Based Suspended Sediment Concentration by Artificial Neural Network Models,” WSEAS Transactions on Computers, vol. 7, no. 5, pp. 559–568, May 2008. [3] M. Paliwal and U. A. Kumar, “Neural networks and statistical techniques: A review of applications,” Expert Systems with Applications, vol. 36, pp. 2–17, 2009. [4] C. Botoca, R. Bardan, M. Botoca, and F. alexa, “Prostate Cancer Prognosis Evaluaion Assisted by Neural Networks,” WSEAS Transactions on Computers, vol. 9, no. 2, pp. 164–173, February 2010. [5] P. Hajek and V. Olej, “Municipal Revenue Prediction by Ensembles of Neural Networks and Support Vector Machines,” WSEAS Transactions on Computers, vol. 9, no. 11, pp. 1255–1264, November 2010. [6] D. Meyer, F. Leisch, and K. Hornik, “The support vector machine under test,” Neurocomputing, vol. 55, pp. 169–186, 2003. [7] L. Manevitz and M. Yousef, “One-class document classification via Neural Networks,” Neurocomputing, vol. 70, no. 7-9, pp. 1466–1481, 2007. [8] A. Osareh, M. Mirmehdi, B. T. Thomas, and R. Markham, “Comparative Exudate Classification Using Support Vector Machines and Neural Networks,” in MICCAI ’02: Proceedings of the 5th International Conference on Medical Image Computing and Computer-Assisted Intervention-Part II. London, UK: Springer-Verlag, 2002, pp. 413–420. [9] J. Z. Shah and N. Salim, “Neural networks and support vector machines based bio-activity classification,” in Proceedings of the 1st International Conference on Natural Resources Engineering & Technology 2006, Putrajaya, Malaysia, July 2006, pp. 484–491. [10] I. Maglogiannis, H. Sarimveis, C. T. Kiranoudis, A. A. Chatziioannou, N. Oikonomou, and V. Aidinis, “Radial Basis Function Neural Networks Classification for the Recognition of Idiopathic Pulmonary Fibrosis in Microscopic Images,” IEEE Transactions on Information Technology in Biomedicine, vol. 12, no. 1, pp. 42–54, 2008. [11] T.-K. Wu, S.-C. Huang, and Y.-R. Meng, “Evaluation of ANN and SVM classifiers as predictors to the diagnosis of students with learning disabilities,” Expert Syst. Appl., vol. 34, no. 3, pp. 1846–1856, 2008. [12] H. Sug, “Investigating Better Multi-layer Perceptrons for the Task of Classification,” WSEAS Transaction on Computers, vol. 9, no. 5, pp. 475–484, May 2010. [13] P. Kraipeerapun, S. Amornsamankul, C. C. Fung, and S. Nakkrasae, “Applying Duo Output Neural Networks to Solve Single Output Regression Problem,” in ICONIP (1), ser. Lecture Notes in Computer Science, C. Leung, M. Lee, and J. Chan, Eds., vol. 5863. Springer, 2009, pp. 554–561. [14] S. Amornsamankul and P. Kraipeerapun, “Bagging of duo output neural networks for single output regression problem,” in Proceedings of the 3rd IEEE International Conference on Computer Science and Information Technology (ICCSIT2010), Chengdu, July 2010, pp. 135–139.
169
INTERNATIONAL JOURNAL OF MATHEMATICS AND COMPUTERS IN SIMULATION
[15] G. Zenobi and P. Cunningham, “Using Diversity in Preparing Ensembles of Classifiers Based on Different Feature Subsets to Minimize Generalization Error,” in Proceedings of the 12th European Conference on Machine Learning, 2001, pp. 576–587. [16] L. Breiman, “Bagging Predictors,” Machine Learning, vol. 24, no. 2, pp. 123–140, 1996. [17] A. Asuncion and D. Newman, “UCI machine learning repository,” 2007. [Online]. Available: http://www.ics.uci.edu/∼mlearn/MLRepository.html [18] P. Kraipeerapun and C. C. Fung, “Binary classification using ensemble neural networks and interval neutrosophic sets,” Neurocomputing, vol. 72, no. 13-15, pp. 2845–2856, August 2009. [19] T. G. Dietterich, “Ensemble Methods in Machine Learning,” in Multiple Classifier Systems, 2000, pp. 1–15.
Issue 4, Volume 4, 2010
170