Brief Review of Vibration Based Machine Condition Monitoring
BRIEF REVIEW of VIBRATION BASED MACHINE CONDITION MONITORING
Dubravko, MILJKOVIĆ, Hrvatska elektroprivreda, Vukovarska 37, 10000 Zagreb, Croatia
[email protected]
ABSTRACT - In the process of channeling energy into job to be performed all machines vibrate. Machines rarely break down without giving some previous warning. The signs of impeding failure are generally present long before a machine totally breaks down. When faults begin to develop in the machine, some of dynamic processes in the machine are changed as well, thereby influencing machine vibration level, temporal and spectral vibration properties. Such changes can act as an indicator for early detection and identification of developing faults. This paper briefly reviews the machine condition monitoring based on vibration data analysis. After the review of major, well established and mature approaches, new unsupervised approaches based on novelty detection are also briefly mentioned. Keywords: machine condition monitoring, condition based maintenance, vibration analysis
1. INTRODUCTION Condition monitoring is the process of monitoring a parameter of condition in machinery, such that a significant change is indicative of a developing failure. Machine condition monitoring can be realized by monitoring following characteristics: vibration, aural, visual, operational variables (state of the system), temperature and wear debris (e.g. oil analysis), [1]. Scope of this paper will be limited in consideration to machine vibration. In the process of channeling energy into the job to be performed forces are generated which will excite the individual parts of the machine directly or via the structure. During operation, machine parts are subjected to fatigue, wear, deformation and foundation settlement. When faults begin to develop some of dynamical processes in the machine are changed influencing vibrations produced by the machine (vibration magnitudes in various directions, vibration time domain recording and frequency spectrum and dynamic range). This is the basis for using vibration measurements and analysis in machine condition monitoring, [1-5]. Advantages of vibration monitoring are following: it is capable of detecting, locating and distinguishing faults, it is non-destructive technique, data can be acquired during normal machinery operation, vibration signature
14
contains most information, it can be applied to inaccessible components and it can be used for on-line condition monitoring.
2. VIBRATIONS
Vibration is oscillatory motion about a reference position. It is caused by the transfer or storage of energy within structures, resulting from the action of one or more forces. Vibrations can be categorized as free vibrations and forced vibrations, linear and nonlinear, and deterministic and random, [1]. If no external force acts on a system and system is left to vibrate on its own, such vibration is known as free vibration, [1]. If a system is subjected to external force, as is common in various machines, the resulting vibration is known as forced vibration, [1]. If the value of excitation is known at any momentn the excitation is called deterministic and resulting vibration is deterministic, [1]. If excitation is repeating in a periodic way resulting vibration is periodic. Such periodic vibrations are directly linked to repetitive events in machine operation, that are common in rotating machinery like motors, generators, turbines and reciprocating engines. If excitation is nondeterministic or random the resulting vibration is called random vibration. All machines during its operation vibrate. Even when machines are in
3. MAINTENANCE SYSTEMS
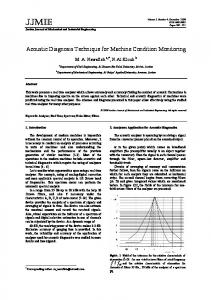
The life of a machine follows the bathtub curve shown in Figure 1, according to [1]. Machine vibration level also follows the shape of the bathtub curve. Probability of failure of the machine decreases during initial running-in period, then increases very slowly during normal operating period due to normal wear.
3.3. On-Condition Maintenance When implemented in off-line mode, vibration levels are measured at fixed predetermined intervals. Once when measurement show increased vibration level as sign of impending problem, frequency of measurements increases as shown in Figure 2, according to [1]. Progress in development of vibration monitoring equipment enables implementation in on-line mode at acceptable cost where integrated hardware and software measures machinery performance 24/7 on-line in real time. Condition Monitoring permits efficient maintenance with a minimum of maintenance cost and minimum of unscheduled production stops. Generally, the off-line implementation is selected due to plant layout logistics against the cost of installing and maintaining an on-line system. On-line diagnostic system with continuous measurements is a choice for diagnostic of strategic high value machinery.
Figure 1 Bathtub curve for the live of the machine
As time progresses, the vibration level continues to increase, leading ultimately to failure or breakdown of machine. Maintenance strategies can be divided in three main categories, [3, 6]:
3.1. Run-to-Break Maintenance (breakdown maintenance) The machines are run until the break down, at which time the failed machine is replaced by a new one. This strategy can be used if machines are inexpensive to replace and breakdown doesn’t cause any additional damage.
Figure 2 Condition based maintenance
4. TYPICAL VIBRATION MONITORING SETUP
Typical setup consists of three main parts: sensors (transducers), signal conditioner with A/D interface and a computer as shown in Figure 3, inspired by [7]. There are several transducers placed on machinery bearings.
3.2. Time Based Preventive Maintenance Maintenance work is performed at fixed time intervals. The intervals are often determined statistically as the period in which no more than 2% (or some other percentage criterion) of the machines will fall from being in new or fully serviced condition. Although this method reduces the chances of unexpected breakdowns, it has been found to be uneconomical.
Figure 3 Typical vibration monitoring setup
15
BRIEF REVIEW of VIBRATION BASED MACHINE CONDITION MONITORING
good condition, they also generate vibrations, [5]. However, most machines produce low levels of vibration when designed properly. When there are signs of impeding failures, overall vibration level, spectral content and its statistical properties change, often quite significantly.
BRIEF REVIEW of VIBRATION BASED MACHINE CONDITION MONITORING
4.1. Transducers Transducers can be accelerometers, velocity and displacement probes, [8, 9]. Choice of a transducer depends on flatness of a signal spectrum in a frequency range of interest, [6, 10]. The most reliable, versatile and accurate vibration transducer is the piezoelectric accelerometer, [8, 9]. Most accelerometers include an integrated circuit preamplifier (IEPE - Integrated Electronics Piezo Electric design).
other domain, as well as with parameters that are statistical constructs, mostly involving signal from time domain. After signal acquisition, data transformation (e.g. FFT) and feature extraction is performed to extract important information in form of various indicators. Finally, the decision process is performed by classification of features, according to values, into two or three categories (e.g. normal operation, caution, and warning).
5. SIGNAL DOMAINS
Signal captured by accelerometers can be analyzed in various domains, [1, 2]:
5.1. Vibration Analysis in Time Domain
Figure 4 Basic accelerometer
Frequency range of one typical accelerometer is shown in Figure 5, according to [8]. Transducers should also fulfill environmental requirements (humidity, temperature, magnetic field, radiation etc.), [9].
Vibration in time domain is measured by successive sampling outputs from vibration transducer. Time domain measurement could be further represented as waveform, orbits and statistical parameters. In the waveform it is necessary to study the following symptoms: amplitude, amplitude symmetry, time symmetry, beats/modulation, impacts (shape and amplitude). Waveforms should be compared to catalogued waveforms for particular type of failure by skillful technician/engineer or in recent time by software aided with artificial intelligence (AI) components. It is good practice to use time waveform to enhance and not to replace spectral data (use both types of analysis), [1, 2, 11, 12].
5.2. Frequency Domain Techniques Figure 5 Frequency range of accelerometer
4.2. Signal Conditioner with A/D Interface Data acquisition hardware for vibration monitoring must meet certain basic criteria. The most significant are sampling rate and dynamic range, which must be assessed to ensure compatibility with the monitoring application. For general purpose machinery monitoring, it is advised to use minimum sampling rate of 25 kHz and dynamic range of 120 dB (24 bits).
4.3. Computer Signal derived from transducers can be analyzed in time, frequency, cepstral or some
16
Spectrum of vibration signal is obtained by Digital Signal Processing (DSP) of vibration signal. It is generally achieved by successive windows on time domain signal, followed by Fast Fourier Transform (FFT). Real and imaginary components of spectrum are used to calculate magnitude and phase shift of each and every frequency component, [1, 2, 6]
5.3. Orbital Domain This is a special case where two signals are from time domain. Orbit diagrams are generated using two noncontact vibration displacement transducers spaced 90º apart in radial direction of the shaft, [1, 2].
5.4. Envelope Demodulation Signal form transducer first pass through low pass filter, then is rectified, after which peak-hold
can reconstruct any signal of finite energy, (6): x(t ) =
∑∑
m∈Z n∈Z
and smoothing is applied (Figure 6), according to [12]. Method is suitable for signals associated with impulse or impact events.
5.5. Quefrency domain (Cepstrum analysis) The application of cepstrum analysis is based on ability of the method to detect periodicity in the spectrum. The cepstrum can be defined as power spectrum of the logarithm of the power spectrum, (1)-(4), [2]: S x (ω ) = F {x(t )}
1 F {x(t )} = T
T 2
∫ x(t )e
−
(1)
2
i ωt
dt
(2)
T 2
c(τ ) = F {log S x (ω )}
2
(3)
c(τ ) = F −1{log S x (ω )}
(4)
(6)
6. DATA PREPROCESSING AND FEATURE EXTRACTION
Data captured by sensors include large amount of information. Data preprocessing, [2], include data normalization, noise floor removal, time domain averaging and windowing (Rectangular, Hanning, Hamming, Blackman). Aims of feature extraction, [12], are identifying significant indicators from data, data reduction (vector dimension reduction) and achieving robustness from noise.
6.1. Time-domain Averaged Waveforms The power of Time-Domain Averaging method, [2], lies in the possibility of relating signal changes to specific kinematic events. Synchronous time averaging uses signal from reference sensor monitoring rotating machinery (and giving ‘tacho’ signal) as shown in Figure 7. The time record length of the averaged signal corresponds to one complete revolution of rotating element.
Cepstrum analysis can be used as a tool for the detection of families of harmonics with uniform spacing [1, 2]. Although groups of harmonics can be seen in spectrum, it is easier to detect such groups in cepstrum.
5.6. Wavelet Transform Wavelet transform is the representation of a function by wavelets. Wavelets are scaled and translated copies of fast-decaying oscillating waveforms. Main difference from Fourier transform is that wavelets are localized in both time and frequency, whereas the standard Fourier transform is only localized in frequency. Wavelet transforms have advantages over traditional Fourier transforms for representing functions that have discontinuities and sharp peaks, and for accurately deconstructing and reconstructing finite, non-periodic and/or non-stationary signals, [13]. Wavelet transform exists in continuous and discrete form. Baby wavelets given in (5): ψ m , n (t ) = a − m / 2ψ (a − mt − nb
)
(5)
Figure 7 Time-domain averaging for gear signal processing
Among features most common are statistical parameters for interpretation of the time-domain waveform, [2, 12]. Detailed description and mathematical interpretation of a comprehensive selection of condition indicators is given in [14]. Some are listed below.
17
BRIEF REVIEW of VIBRATION BASED MACHINE CONDITION MONITORING
Figure 6 Simple envelope detection scheme
x,ψ m , n ψ m , n (t )
6.2. RMS - Root Mean Square Value
1 N
Brief Review of Vibration Based MACHINE Machine Condition Monitoring BRIEF REVIEW of VIBRATION BASED CONDITION MONITORING
RMS =
N
∑x n =1
2 n
yi* =
(7)
The crest factor and kurtosis function are used to describe the shape characteristics of the signal and change together with vibrations produced by machinery.
xi xmax
(10)
yi − ymax ymax − ymin
(11)
xi* =
The RMS value of a vibration signal is an important measure of its amplitude, (7).
xmax is the maximum xi, ymin and ymax are the minimum and maximum yi. The fractal dimension of the waveform (Φ) is then approximated by D as, (12): Φ ≈ D =1+
6.3. Crest Factor PL RMS
(8)
The crest factor calculation tells us how much impacting is occurring in a waveform. Impacting is often associated with roller bearing wear, cavitation and gear tooth wear.
6.4. Kurtosis The fourth order moment, kurtosis, is defined in (9): N
k=
n =1
4
( )
Nσ
2 2
(9)
The kurtosis is sensitive to impulsiveness or “spikeness” of the data. The kurtosis of random signal is 3.0. The vibration signal of a rolling element in good condition is expected to have this value. The kurtosis level rises sharply to around 6 at the onset of discrete damage. The kurtosis value falls as the damage spreads.
6.5. Fractal Dimension Fractal dimension D is a statistical quantity that gives an indication of how completely a fractal appears to fill space, as one zooms down to finer and finer scales. This new feature is becoming popular with novelty detection approaches. A procedure to estimate the fractal dimension of waveforms is given in [15]. If there is a set of N values yi sampled from a waveform between time 0 and tmax with sampling interval, xi normalized abscissa, and yi normalized ordinate defined as, (10), (11):
18
N’=N-1
(13)
6.6. Organizing Data from FFT Analysis into Frequency Beans
where Pl is the signal peak level, (8).
∑ [y(n ) − µ ]
(12)
L is the length of the curve in the unit square and
Crest factor, Cf, is defined as: Cf =
ln( L) ln(2 N ′)
FFT analysis produce results for numerous frequency components. It is beneficial to organize these components into smaller number of frequency beans (e.g. octave analysis) suitable for classification. Bi =
1 N i +1 − N i
N i +1 −1
∑A
j = Ni
i
Bi = 1, N b
(14)
Aj is the amplitude of frequency component j, Bi is value of frequency bean i, Ni and Ni+1 are beginning and end amplitude frequency component for that frequency bean and Nb is number of frequency beans. These are some of the most traditional features used for machinery diagnostics. Some methods are more appropriate for detection of particular class of problems than other.
7. VIBRATIONAL CHARACTERISTICS OF MECHANICAL FAULTS
Following machinery problems can be efficiently diagnosed using vibration analysis, [1-3, 6]: imbalance, misalignment, mechanical looseness, rubs, whirling in rotating machinery, hysteretic whirl, whirl due to fluid trapped in rotor, dry friction whip, fluid bearing whip, rolling element bearings, gears etc. Space permits only most important examples.
7.3. Orbit Displays
It can be used effectively to enhance spectral information in the following applications: low speed applications (less than 100 RPM), indication of true amplitude in situations where impact occurs such as assessment of rolling element bearing defect severity, gears, sleeve bearing machines with X-Y probes (2 channel orbit analysis), looseness, rubs and beats, [11].
A circular orbit is obtained from two sinusoidal waveforms equal in amplitude. Waveforms of different amplitudes produce an elliptical orbit. If two waveforms contain more than one discrete frequency, orbit pattern increases in complexity. This display format shows journal bearing relative motion (bearing wear, shaft misalignment, shaft unbalance, lubrication instabilities [whirl, whip], and seal rubs) extremely well (Figure 9), according to [1].
7.2. Spectrum and Cepstrum In some situations normal spectral and phase data provide better indication as to the source of the problem without the added complexity of time waveform data. Examples include unbalanced and misalignment on normal speed machines. Cepstrum analysis can be used as a tool for the detection of families of harmonics with uniform spacing. Although groups of harmonics can be seen with spectrum, it is easier to detect such groups in cepstrum, [1, 2]. Spectrum and cepstrum of undamaged and damaged gearboxes is shown in Figure 8, from [1].
Figure 9 Shaft orbit (imbalance)
It is a powerful monitoring and diagnostic tool, especially on relatively low-speed machinery.
7.4. Envelope Demodulation Signals associated with impulse or impact events can remain dangerously hidden in a normal vibration spectrum reading (as shown in Figure 10, from [16], illustrating a bearing crack), until a catastrophic stage is reached. These “impact events” are high-energy, high-frequency events of very short duration.
Figure 10 FFT of crack in bearing outer race Figure 8 Spectrum and cepstrum of good and bad gearbox
19
BRIEF REVIEW of VIBRATION BASED MACHINE CONDITION MONITORING
7.1. Time Waveform
Caution, (15):
x > LC
(15)
x > Lw
(16)
Warning, (16):
Brief Review of Vibration Based MACHINE Machine Condition Monitoring BRIEF REVIEW of VIBRATION BASED CONDITION MONITORING
a) Original signal
b) After high-pass filter
c) After demodulation (envelope)
d) After FFT of demodulated signal Figure 11 Demodulation analysis reveals the problem
x is feature value, LC caution level and LW warning level (warning is more serious). There is also choice of another three limits that can be chosen to create an alarm if variable under consideration cross it: Prior experience limits, Concern Level and Non-Operational limit. When setting alarm limits one can choose fixed alarm limits (ISO Standards), [20]. Single indicator generally gives unacceptable accuracy (60-70%). For greater accuracy more indicators should be combined. With help from previous trending data and statistics one can use calculated alarm limits, band alarms and envelope alarms, [21]. When dealing with frequency domain one should specify spectral alarm levels for each frequency bean (Figure 12).
Impact events typically occur in the early stages of rolling element bearing wear, and during gear meshing. Envelope demodulation, [16, 17], (Figure 11), [16], reveals such events.
8. DETECTION TECHNIQUES
The interpretation and correlation of vibration data is difficult task and requires experienced skilled personnel and reference vibration data (e.g. machine reference vibration levels and spectrum), [5, 18]. Automated processing and analysis methods are sometimes sought, [12].
8.1. Conventional Methods Statistical features are commonly used to provide a measure of the vibration level that can be compared to a threshold value indicative of a failed condition. The user specifies what the upper and lower reading levels are in terms of acceptable operating condition. This can be based on experience combined with values from General Machinery Criterion Chart, [5, 9]. Comparison of overall vibration levels to predetermined limits is performed using limit checkers, [19]:
20
Figure 12 Frequency band alarms
Again, for caution and warning alerts the following conditions have to be fulfilled, (17), (18), this time for each particular frequency band:
∃xi
xi > LC
(17)
∃xi
xi > LW
(18)
8.2. Supervised Classification Techniques These techniques are based on pattern recognition adding flexibility and adaptation to conventional decision techniques, [19, 22, 23 ].
Figure 13 Artificial intelligence based vibration analysis
Artificial intelligence tools can classify preprocessed measurement data. Methods used in classifications are decision functions, nearest neighbor classification (1-NN, k-NN), artificial neural networks (ANN), rule based expert system, even those employing fuzzy logic. Basic ANN design is shown in Figure 13.
9. NOVELTY DETECTION
Novelty detection is the identification of new or unknown data that a machine learning system is not aware of during training, [24, 25]. Conventional monitoring of objects’ condition relies on known cases of abnormal condition(s). The availability of these known cases is, however, not guaranteed, and in reality it is often difficult to obtain such data. Examples of abnormal engine behavior are rare, and so the novelty detection approach is taken, in which departures from a model of normality (constructed from normal data) are identified. The goal of novelty detection is maximization of detecting true novel samples and minimizing false positives. To achieve this, one must distinguish normal patterns from outliers. For novelty detection, the description of normality is learnt by fitting a model to the set of normal examples, and previously unseen patterns are then tested by comparing their novelty score (as defined by the model). An outlier would be an observation that deviates so much from other observations as to arouse suspicions that it was generated by a different mechanism. Solutions are data driven and include automatic learning. Possible approaches methods include [24 - 27]: - Density Estimation: Estimate a density based on training data - Quantile Estimation: Estimate a quantile of the distribution underlying the training data - Unsupervised learning including clustering of input data - Unsupervised training of artificial neural networks (Kohonen self-organizing maps and LVQ). Once trained on ‘normal’ data artificial intelligence systems can automatically detect outliers that correspond to impending maintenance problems and interpret measurement results.
Figure 14 Basic ANN architecture of interconnected neurons
Training is usually performed by some variant of backpropagation algorithm and presenting input-output (signal features - output indication) sample pairs until network learns inputoutput mapping. Beside pattern recognition approaches, common are statistical approaches using Hidden Markov models and Gaussian Mixture Models. There also exists model based approach that use mathematical models.
10. APPLICATIONS
Basic problems that can be detected include imbalance, misalignment, journal bearings, rolling element bearings and mechanical looseness. Applications can be found in machinery from all fields [28]: 1. Engines, turbines and generators Vibration analysis for condition assessment and fault diagnostics has a long history of application to power and mechanical equipment.
21
BRIEF REVIEW of VIBRATION BASED MACHINE CONDITION MONITORING
They try to mimic pattern recognition ability of human expert. Higher success rate (>90%) can be achieved. Training is accomplished with normal and faulty data. In general, the system has to be previously trained on numerous examples, usually collected by measurements on the same or similar machinery in the past. Vibration measurement data can be automatically classified in various categories (no damage, moderate or heavy wear, impending damage etc.) Block diagram of AI (artificial intelligence) based vibration analysis instrument for detection of impending problem is shown in Figure 13.
This includes reciprocating engines (e.g. compressors), gas, steam, hydro and wind turbines.
BRIEF REVIEW of VIBRATION BASED MACHINE CONDITION MONITORING
2. Pumps Some of the core equipment issues include cavitation, seal failure, bearing failure and shaft imbalance. 3. Fans Industrial fans are integral components of any industrial plants, particularly automotive, air conditioning, printing, and coating, where fan failure can cause expensive unscheduled plant shutdowns. 4. Gears and gear boxes Detection of localized gear defects, such as tooth fatigue fracture, tooth flank wear (spalling), pitting fatigue, and backlash. 5. Drive belts Drive belts are inexpensive type of power transmission, but prone to many problems. Vibration analysis can be used for early detection of wear/misalignment problems. 6. Transport vehicles Railways, especially those operating mainline passenger and high-speed services, need to be run safely, reliably and efficiently. It is also widely used for jet engine monitoring and helicopters - Health and Usage Monitoring System (HUMS). 7. Quality assurance There is an increasing need for fast, reliable and objective quality assessment of every single unit at the end of the assembly cycle. In order to meet the requirements of quality assurance automatic and in-depth quality end-tests are applied in modern manufacturing
11. CONCLUSION
Vibration analysis is one of the most powerful condition based maintenance method, and is the key element of many predictive maintenance programs. Applying vibration analysis for monitoring the condition of machinery is convenient, inexpensive, and reliable in determining the faults in their early stages and
22
can avoid unscheduled shutdowns and expensive repair costs. The method is based on the fact that with development of most machine faults, there is also a corresponding change in the way machines vibrate. Machine vibrations are picked by vibration transducers (mostly accelerometers). After data preprocessing (that includes data normalization and noise removal) vibration signals can be analyzed in various signal domains (e.g. temporal, spectral, cepstral). Feature extraction is generally further applied (e.g. use of various indicators, frequency beans) to reduce data dimensionality. Fault detection can be performed by a human expert or automatically, using conventional methods (limit checkers), pattern recognition or even novelty detection methods. Early detection of faults allows the user to initiate repairs to prevent costly maintenance and generate maximum revenues at minimum costs. Application of condition monitoring and predictive maintenance provides economic advantages in most industries. Wisely devised maintenance strategies have produced huge savings, as it is very expensive to repair broken machine, hold large reserve of spare parts or machines and reschedule production due to repair delays.
12. REFERENCES
[1] Rao, S. S., ed., Mechanical Vibrations, Prentice Hall, 4th edition, March, 2003 [2] Krishnappa, G., Machinery Condition Monitoring, in Encyclopedia of Acoustics, Vol. II, pp. 869-879, Wiley, 1998 [3] Broch, J. T., Mechanical Vibration and Shock Measurements, Brüel & Kjær, 2nd Edition, April 1984, Denmark [4] Randall, R. B., Machinery condition monitoring, in M. J. Crocker (Ed.), Handbook of noise and vibration control, Wiley, 2007 [5] Randall, R. B., Vibration-based Condition Monitoring: Industrial, Aerospace and Automotive Applications, Wiley, 2011 [6] Bodre, R., Introduction to Machine Vibration, DLI Engineering Corp., 2008, [7] Bandyopadhyay, A., Mandal, S. K. D. and Pal, B., Real-time Condition Monitoring System using Vibration Analysis for Turbine Bearing, Speech and signal processing Group, Calcutta, India [8] Serridge, M. and Llcht, T. R., Piezoelectric Accelerometers and Vibration Preamplifiers, Theory and Application
[19] Miljković, D., Fault Detection Methods: A Literature Survey, MIPRO, Opatija 2011 [20] Robichaud, J. M., Reference Standards for Vibration Monitoring and Analysis, Bretech Engineering Ltd., 70 Crown St., Saint John, NB Canada E2L 3V6 [21] Utete, S. W., Clifton, D. A. and Tarassenko, L., Trending Of Performance Parameters For Aircraft Engine Condition Monitoring, World Congress on Engineering Asset Management and International Conference on Condition Monitoring 2007, 11-14 June 2007, Harrogate, UK [22] Vilakazi, C. B., Marwala, T., Mautla P. and Moloto, E., On-Line Condition Monitoring using Computational Intelligence, WSEAS Transactions On Power Systems, Issue 1, Vol. 1, January 2006 [23] Nandi, A. K., Liu, C. and Wong, M. L. D., Intelligent Vibration Signal Processing for Condition Monitoring, Surveillance 7 Int. Conf., Oct. 29-30, 2013, Chartres, France [24] Markou, M. and Singh, S., Novelty Detection: A Review Part I: statistical approaches, Signal Processing, Vol. 83, Issue 12, December 2003 [25] Miljković, D., Review of Novelty Detection Methods, MIPRO, Opatija 2010 [26] Markou, M. and Singh, S., Novelty Detection: A Review Part II: neural network approaches, Signal Processing, Vol. 83, Issue 12, December 2003 [27] Addison, J. F. D., Wermter, S. and MacIntyre, J., Effectiveness of Feature Extraction in Neural Network Architectures for Novelty Detection, Proceedings of the 9th ICANN, Vol. 2, 1999 [28] Robichaud, J. M., Practical Applications Of On-Line Vibration Monitoring, Proceedings of. the 1st Pan American Conference for Nondestructive Testing PACNDT ‘98, October 1998
23
BRIEF REVIEW of VIBRATION BASED MACHINE CONDITION MONITORING
Handbook, Brüel & Kjær, Denmark, November 1987 [9] Measuring Vibration, Brüel & Kjær, Denmark, September 1982 [10] Vibration Measurement and Analysis, Lecture Note BA 7676-12, Brüel & Kjær, 1998 [11] Dunton, T. A., An Introduction to Time Waveform Analysis, Universal Technologies Inc., 1999 [12] Lebold, M., McClintic, Katherine, Campbell, R., Byington, C. and Maynard, K., Review Of Vibration Analysis Methods For Gearbox Diagnostics And Prognostics, Proceedings of the 54th Meeting of the Society for Machinery Failure Prevention Technology, pp. 623-634, Virginia Beach, VA, May 1-4, 2000 [13] Zabel, W. and Brehm, M., Wavelet Analysis in Structural Health Monitoring and Damage Detection, Proceedings of the SAMCO Summer Academy 2005, Sept. 2005, Zell am See, Austria [14] Zhu, J., Nostrand, T., Spiegel, C. and Morton, B., Survey of Condition Indicators for Condition Monitoring Systems, Annual Conference of the Prognostics and Health Management Society 2014, Fort Worth, Texas, September 27 - October 3, 2014 [15] Sevcik, C., A procedure to Estimate the Fractal Dimension of Waveforms, Complexity International, Vol. 5, pp. 1–19, 1998 [16] Demodulation Analysis Explained, Commtest, October 2005, http://www.commtest.com/support/faq_s/vbseries/vbclassic_ demodulation_analysis [25 December 2015] [17] Envelope analysis for effective rolling-element bearing fault detection – fact or fiction?, Application Note BAN0024-EN-11, Bruel & Kjær, Denmark [18] Machine-Condition Monitoring using Vibration Analysis, Brüel & Kjær, Application Note BO 0253-11, Denmark