chromosomes are considerably shorter in metaphase than in prophase, but only a few numerical data concerning the changes of length are available. Also, it is ...
CHANGEOFLENGTHANDVOLUME O F MITOTIC CHROMOSOMES IN LIVING CELLS By A . BAJER‘ INSTITUTE OF GENETICS, UNIVERSITY OF LUND, SWEDEN
(Received April 28th, 1959)
I. INTRODUCTION
I
N studies on chromosome structure special attention has been drawn to the spiralization cycle of meiotic chromosomes and, to a smaller extent, of mitotic ones. Important reviews on the subject were published by: NEBEL (1939), KUWADA(1939), KAUFMANN(1948), MANTON(1950) and others. Although the studies have shown the existence of the spiral structure of the chromosomes in meiosis and mitosis, the details and especially the mechanism of coiling are incompletely known. Some other aspects of the chromosome changes were studied by a few authors only. It is known from the time of FLEMMING (1882) that the chromosomes are considerably shorter in metaphase than in prophase, but only a few numerical data concerning the changes of length are available. Also, it is not generally known at what stage of mitosis the chromosomes are shortest, and very often the view of DARLINGTON that “in most organisms contraction of the chromosomes reaches its maximum at the last stages of prophase” (DARLINGTON 1937 p. 25) is held. B k ~ ~(1929), ii however, has pointed out that the chromosomes contract very strongly and rapidly during anaphase and telophase. Important data concerning the chromosome length are to be found in the works of BELLING (1928), MANTON (1935, 1939, 1945, 1949), SPARROWet al. (1941), SVARDSON(1945) and WICEBOM(1949). BELLING(1928) and MANTON (1935) studied also the changes in volume of the chromosomes. The difference in chromosome length between normal mitosis and colchicine mitosis was measured by OSTERGREN(1944). All the measurements described in the above papers, except those of B ~ L (1929), A ~ were made on fixed material. Only very fragmentary data permanent address: Laboratory of Plant Physiology, Jagellonian University, Cracow, Poland. 37
- Hereditcia 45
580
A. BAJER
concerning the changes of living chromosomes are available (viz. those from BE*LAG1929). For this reason the present author decided to study the changes in chromosome length and volume by means of measurements made on the films of mitosis in the endosperm of Haemanthus katharinae BAK.and Leucojum aestivum L. (BAJER1957, MOLE-BAJER 1958). The data concern the period from prophase before the nuclear membrane disappears until the formation of the cell plate in telophase.
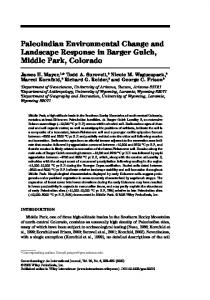
11. MATERIAL AND METHODS The measurements were done only on very flattened cells of Haemunthus katharinae and Leucojum aestivum in which the chromosomes were arranged in a single layer. The method of flattening the living endosperm cells was described previously (BAJER1955, 1957, BaJER and MOLE-BAJER 1956). Time lapse cinemicrography with both 35 mm and 16 mm film was used and measurements were done on enlarged prints (cells Nos. 405, 207, 281) and on drawings (cells Nos. 157, 99). The measurements on Huemcrnthus were done on 3 cells undergoing normal mitosis and on 1 cell dividing under the influence of colchicine (the influence of colchicine on the course of mitosis in living cells of endosperm was described by MOLE-BAJER 1958). Not even in these flattened cells could the changes in length of the whole triploid chromosome set (27 chromosomes) be measured. However, the length of no less than 1 7 chromosomes was measured in three cells and the length of 24 in two other cells. The change of chromosome length was also measured in one cell of Leucojum aestivum (Fig. 9 ) . During the measurements the film was projected many times to avoid errors in the estimation of the position of kinetochores and chromosome ends. This is of particular importance during prophase and prometaphase. The volume of the chromatids from prophase until the beginning of anaphase and of the daughter chromosomes in anaphase, was calculated from measurements of the length and the breadth of the chromatids and daughter choromosomes on the assumption that the cross section of these bodies is a circle. The same assumption was previously made by BELLING(1928), MANTON (1935) and S V ~ ~ R D S(1945). ON 111. RESULTS 1. Chromosome morphology
.
The endosperm of Haemanthus katharinae is a triploid tissue 3n =27. In the haploid chromosome set there are 4 large chromosomes and
Fig. 1 . Flattened cells of Hnemunthus kctfhurinne in the living state. a. Ccll ( N o 405/55) on which the iiieasureinents of rhroniosome lcngtli (Figs. 5-6) and volume (Fig. 8 ) were iiiade. Nos. of ehromosonieb given in micrograph. b. Ccll under thc influence of 50 ppm. of rolchicine in agar. Micrograph from the work of MOLE-UAJER (1938). No measuremeiits were made 011 this cell.
k'ig. 2. Chloniosome N o 2 I'roni I h e cell of Fig. 1 a ; in Fig. 6=I)lack circlc.5.
280' 300'320' 240' Fig. 3. Chromosome No G from the cell of Fig. 1 a; in Fig. 6=11lacB triangles. Also small chromosome No l i ; in Fig. O=black circles.
780' 200' 230' 245'
260'
Fig. 4. Chromosoiiie\ No>. 11 a n d 13 f r o m the cell of Fig. 1 a; in Fig. =black triangles and white circles respectively.
(j
MITOTIC CHROMOSOMES IN LIVING CELLS
581
5 smaller ones. Each of the four large types may be easily distinguished in the living state: they differ in their dimensions and in the position of their kinetochores. At metaphase the arm ratio of the largest chromosome type is approximately 1 : 2 (Figs. 1-2, chromosomes 1, 2 and 3) the second largest type is slightly smaller and has the arm ratio of approximately 1 : 3 (Fig. 1, chromosomes 4, 5, 6 and Fig. 3), the third type is smaller still and its arm ratio is also approximately 1 : 3 (Fig. 1, chromosomes 7, 8 and 9) and the fourth type is approximately of the same size as the third, but it has a subterminal kinetochore (Fig. 1, chromosomes 10, 11 and 12 and Fig. 4 ) . Among the smaller chromosomes at least three types may be distinguished; one chromosome type (Fig. 1, chromosome 13 and Fig. 4) is slightly larger than the others. The remaining two differ in the location of their kinetochores. Because of their small dimensions and the possibility of mistakes in identifying them, no efforts were made to distinguish the homologous types within this latter group. Chromosome morphology in Leucojum was not studied (see however, micrograph of chromosome set in living state, BAJER1955). 2. Changes in chromosome length
Similar changes were found in all chromosomes in all cells of Haernanthus on which the measurements were made. The numerical data were slightly different in different cells during normal mitosis, and the chromosomes were more strongly contracted during colchicine mitosis. In normal mitosis (Figs. 5-6) the chromosomes start a period of rapid shortening a few minutes before the dissolution of the nuclear membrane. They shorten most rapidly during prometaphase at the same time as the chromosomes execute their most vigorous movements before the formation of the metaphase plate. This is similar to the results of SV~~RDSON (1945) on animal material; he found that “the shortening is more marked between pro- and mid-metaphase than between mid- and late metaphase” (1. c. p. 24). At this stage in Haemanthus the largest chromosome may shorten at the ratio of 0.7 pulmin. Gradually the chromosomes shorten more slowly and there is a short time in metaphase when there is almost no change in the large chromosomes and in the smaller ones the change is not measurable. Just before the start of anaphase the chromosomes begin to shorten again and they continue their shortening during the whole of anaphase. This result of the present
582
A. BAJER
70
0
A
60
0
-AAA 0
40i
, I
0 0
' A
8
AA
30
A
A
0
A A
ooooooo
I
0 0
0
I A A A A A A A A A 0 0
0 100 200 300 minuiss Fig. 5. The change of chromosome length. N.M.D.=dissolution of the nuclear membrane; A=beginning of anaphase; C. P. F.=beginning of the formation of the cell plate. Cell No 405/55; cf. also Figs. 1 a, 2 and 4.
study is contrary to the observations of MANTON (1939) who found in mitosis of O S ~ U R that ~ C Ithe chromosome length in anaphase is greater than that in metaphase. In the endosperm of Haemanthus katharinae the chromosomes reach their maximum contraction at the transition stage between anaphase and telophase, a result in full agreement with the observations of B ~ L A &
583
MITOTIC CHROMOSOMES IN LIVING CELLS
/1L
00
80
70
60 +++++
+.I
0 0
50
40
30
20
10
0
100
200
300
minutes
Fig. 6. Continuation of Fig. 5. Some chromosomes from the same cell.
(1929). During telophase i.e. simultaneously with the beginning of cell plate formation, there seems to be no further change of chromosome length in some cells, while in others they continue to shorten. However, as a result of structural changes which make the outlines of the chromosomes appear blurred, measurements are not possible in most cases. The change in length is approximately proportional to the initial length of the chromosomes in prophase. This is clearly shown when the
584
A, BAJER
TABLE 1. Chromosome length of Haernanthus kathurinne (cell 405/55) The length in p of the chromosomes and of their arms (where a r m measurements were possible) is given. Homologous chromosomes: the longest - A, 1, 2 and 3, long - B, 4, 5 and 6, medium - C, 7, 8 and 9, medium with subterminal kinetochore - D, 10, 11 and 12. The percentage of change in length calculated according to the fomula: --
- 100
4
where I,=length
at 0 time, 1,=length at time x. Nuclear membrane
disappears between 70 and 80 mins. Anaphase begins between 255 and 260 mins., cell plate begins to form between 320 and 330 mins. ~~
~~~~
C h r o m o s o m e t y p e I$
Chromosome type A
Time (initis.)
1
3
2
4
5
6
85
84 55+29
81 57+27
68
-
-
82 (3.5 %) 54+28
82 (2.4 % ) 53 29
- -
78 (7.1 % )
67 (1.4 %)
62 (4.5 %)
77 (9.4 % )
78 (7.6 7;) 51.5+26.5
75 (10.7 %) 49+26
63 (7.2 %)
- _
- _
58 (10.7 70)
58 (6.4 %) 39+19
60 (29.4 %
62 (26.2 % ) 4i+ai
59 (29.7 % ) 30 20
45 (33.8 % )
39+21
46 (29.2 % ) 34+12
45 (27.4 %) 35+10
120
19 (42.3 % 32+17
50 (40.4 % ) 34.5+ 15.5
52.5 (37.5 %) 32 (52.7 %) - 35+17.5
37 (43 % ) 28+9
40.5 (34.6 %) 29+11.5
150
42 (50.5 % 29+13
42 (50 "/c)
43 (49 % ) 28.5+ 14.5
30.5 (55.1 % 23.5 7
+
30.5 (53 % ) 25+5.5
30.5 (50.8 %)
28+14
39 (54.1 % 27+12
38.5 (54.1 %) 28+10.5
38 (54.7 % ) 25+13
28 (58.6 % ) 22+6
29 (55.3 % ) 22+7
29.5 (52.4 % ) 21+8.5
- -
36 (56.4 %)
37 (55.9 %) 27+10
36 (57.1 %) 24 12
28 (58.6 % 22+6
28 (56.9 % ) 21+7
28.5 (54 %) 21+7.5
240
35 (58.6 % ) 24+ll
35.5 (57.7 %) 26+9.5
34 (59.7 %) 22+12
27 (60.3 % 21+6
26 (60 % ) 20+6
27.5 (55.6 %) 20+7.5
270
32 (62.3 %) 22 10
32 (61.7 %) 23.5+8.5
31 (63 % ) 22+9
23 (66.1 %)
22.5 (65.3 %)
300
28.5 (66.4 %) 19+9.5
28.5 (66 % ) 19.5+9
27 (67.8 %) 21+6
21 (69.1 % ) 17.5+3.5
330
24 (71.7 % 17.5+6.5
24 (71.4 % ) 16+8
- -
24 (71.7
21 (75 5) 14+7
- -
34 (71.7 % _ -
- _
0
30 60
90
180 210
345 350
- -
+
+
21 (75 3 ) )
+
+
62
65
- _
- _
-
_
60 (3.2 %) 11+19
- _
22.5 (63.7 % )
18+4.5
- _
21.5 (66.9 % ) 18+3.5
21.5 (65.3 %) 18+3.5
19.5 (76.9 % ) 19.5 (71.3 %) 16+3.5 15.5+4
19.5 (70 % ) 16+3.5
18 (70.9 % ) 15+3
18 (58.5 %)
19 (70.7 % ) 15+4
16 (74.1 %) 13.5 2.5
18 (78.5 %)
- _
- -
19 (72 % )
- -
19 (72 % )
- _
19 (70.7 5)
- -
+
17 (72.5 %)
- _
585
MITOTIC CHROMOSOMES I N LIVING CELLS
Table 1 (continued) Chromosome type C 7
8
9
Ii
Chromosome typc D
lo
12
11
II 0
53
30
-
-
53
-
-
52
52 49+3
-
-
50 (4 % I 48+2
55 (0 %I 52+3
- -
46 (11.5 %)
48 (7.6 %) 46+2
54 (1.8 %) 51+3
- -
38 (26.9 %)
40 (23 % ) 38+2
- -
39 (26.4 %) 37+2
33 (40 %) 31+2
- -
27.5 (50 %) 26+1.5
30 (43.4 %) 27+3
24.5 (52.8 %) 25 (51.9 %) 22.6 2.5
25.5 (53.5 %) 23.5+2
27.5 (48.1 % 25+2.5
24.5 (52.8 %) 23 (55.7 %) 20.5+2.5
24 (56.3 %) 22.5 1.5
+
24.5 (53.7 % 22+2.5
55
53
-
- -
52 (1.8%)
-
-
48 (9.4 %) 31 17
- -
38 (28.3 %)
38 (28.3 %) 25+13
- -
31.5 (40.5 % )
33 (37.7 %) 24+9
32.5 (37.5 %) 31 (40.3 % 29+2
27 (49 %)
27 (49 %) 20.5 +6.5
27 (48 %)
24 (54 %)
26 (50.9 % 19.5 +5.5
- _
21 0
23 (56.6 %
24 (54.6 % 18+6
- -
240
22 (58.4 %
- -
23 (56.6 %) 17.5 +A5
- _
23 (65.7 %)
22 (57.6 %) 20.5 1.5
+
23 (58.1 %) 22+1
23 (56.6 %) 21 +2
20 (62.2 %
20.5 (61.3 %)
21 (69.6 % )
21 (56.9 %) 19.5 1.5
20 (63.6 %) 19+ 1
20.5 (59.6 % 19+1.5
19 (63.4 %)
19 (63.4 %) 18+1
18.5 (66.3 % ) 17+1.5
19 (64.1 o/o) 18+1
15 (71.1 %)
13 (77.9 %) 12+1
15 (72.7 % ) 13.5 $1.5
17 (67.9 %) 15.5+ 1.5
60
90 120 150 180
270 300 330 345 350
- -
- - -
- -
- -
- -
+
-
- -
- -
15.5+5.5
- _
18 (66 %)
18 (M% ) 13.5+4.5
- -
14.5 (72.6 %)
15 (73.5 %) 13+2
- _
- - -
14 (73.5 %)
- -
15 (75.4 %)
- -
28 (41.6 %) 26+2
+
+
38.5 (30 %
53 (0 %I
52 (1.8 %)
33 (37.7 %)
15 (71.1 %)
-
ia+z
- _
-
- -
-
- -
15 (71.1 %)
-
- -
14 (73.5 %)
15 (71.6 %)
1 4 (73.5 %)
change in length is expressed as percentage - Table I, and especially when logarithmic values of chromosome length are plotted (Figs. 9 and 10). This result seems to be quite different from that found by W A R D SON (1945) and WICKBOM (1949) - cf. discussion. In the endosperm the chromosomes of different length behave in the same general way. However, there are differences in the finer details of the course of contraction, even between homologous chromosomes in the same cell;
586
A. BAJER Toble 1 (continued)
~
Time niins.)
0
S ni a 11 c h r o m o s o m e s
16
15
13
18
17
26 18+8
19 10.5+8.5
25 (3.8%) 17+8
_ _
- -
24 (7.6 %) 17+7
_ _
16 (16.7%)
20 (23%) 13.5+6.5
15 (21 %) 9+6
_ -
- -
15 (42.3 %
12 (36.8 %) 6.5+3.5
11 (42.1 %) 7.5+5.5
- -
12.5 (51.9%)
10 (47.3P) 5.5+4.5
10 (47.3%) 6.5+3.5
9 (52.6%)
9.5 (27.2%)
6+3
-
9 (52.6%) 5+4
8 (57.8 %)
8.5 (55.2 % 6+2.5
8.5 (52.7%)
6+2
_ _
9.5 (54.7 70) 7+2.5
- -
11.5 (55.7%)
8.5 (55.2%) 5+3.5
8 (57.8%) 5+3
8 (57.8%) 6+2
8 (55.5%)
9 (57.1 %)
11.5 (55.7%) 7.5 4
8.5 (55.2%) 5+3.5
7 (63.1%) 4.5+2.5
8 (57.8%) 6+2
7 (61.1 %)
_ -
9 (57.1 %)
270
11 (57.6%) 7+4
8 (57.8%) 4.5+3.5
6.5 (65.7% 4.5+2
7 (63.1%) 5.5+1.5
- -
300
9 (65.3% 6.5 +2.5
7 (63.1%) 4.5 +2.5
6.5 (65.7% 4.5+2
6.5 (65.7%) 5+1.5
- -
330
- -
5 (73.6 %)
4+1
6 (68.4%) 4 +2
6.5 (65.7%) 5+1.5
- -
- -
30
60 90
120 150 180 210 240
345
- - _
12 (53.8%)
- -
+
- -
- -
19 (0 %)
19
19
- _
_ -
21
-
-
-
19 (0 %)
19 (0 %) 15+4
- -
_ -
18 (5.2%)
18 (5.2%) 14.5+3.5
_ _
16 (11.7%)
21 (0%) 14+7
13 (27.7%)
16.5 (21.4%) 11.5+5
12+6 13 (31.5%)
12.5 (34.2%)
lo (47.3 %)
7 (63.1%) 5+2
350
18
20
_ -
7 (63.1 %)
- -
-
17 (5.8%)
- _ - - _ -
_ -
21 ( 0 % )
12 (42.8% )
- -
11.5 (42.5%) 9+2.5
7+2 6.5f2.5
6.5 (63.8%)
9 (57.1%) 6.5+2.5
6 (66.6%)
9 (57.1%) 6+3
5 (72.2%)
8 (61.9%) 6+2
_ _ - -
- -
- - -
9 (57.1%)
9 (57.1 % )
- -
their dimensions at the same stages may not be exactly the same. It should therefore be stressed that though the general course of the changes is the same, different chromosomes may shorten slightly differently. During c-mitosis caused by the influence of colchicine the chromosomes are more strongly contracted already in prophase than they are during normal mitosis. Furthermore, the duration of c-mitosis is much
100 200 300 400 min change of chromosome length under the influence of 50 ppm. of colchicine in agar. N.M.D.=nuclear memb ce. A=c-anaphase, i. e. the sudden lapse of chromatid pairing and formation of “ski pairs”. The micrographs cell are in the work of MOLE-BAJER (1958), cell No 207/56.
jaa
A. BAJER
longer. For this reason the rate of the changes in chromosome length is much slower (Fig. 7). Also, as the contraction of chromosomes in cmitosis was studied in a single cell only, it is difficult to judge whether or not, there are consistent differences from normal mitosis in certain features of the contraction pattern. In early metaphase there is during c-mitosis a period of relatively rapid contraction that most probably corresponds to the rapid prometaphase contraction of normal mitosis. In the cell studied this contraction period occurs later than in normal mitosis relative to the breakdown of the nuclear membrane. After a period of relatively slow contraction during most of the c-metaphase there are distinct indications of a short period of rapid contraction at the beginning of c-anaphase, similar to that occurring at the beginning of normal anaphase. The contraction pattern during c-mitosis is not clearly different from that of normal mitosis, except in so far as the occurrence of a strong contraction already in prophase is concerned. A difference of this kind is in agreement with the suggestion of OSTERGREN(1944, 1951) that colchicine may have a direct influence on the contraction mechanism of the chromosomes. 3. Changes in volume
After the length had been measured, attempts were made to calculate the volume of the chromosomes: i.e. the volume of the single chromatid until the beginning of anaphase and of the daugther chromosome (two half-chromatids) in anaphase and telophase. The two chromatids of the chromosome can be distinctly seen from prophase until metaphase. In anaphase and especially in telophase the structure is not so clear, cf. discussion p. 594. The thickness of two chromatids seen lying side by side at prophase and metaphase was measured and then divided by two to get the thickness of a single one. The measurements of the thickness varied in accuracy because the outlines of the chromosomes were seen more distinctly in later than in earlier stages. Two valumes were always calculated, corresponding to the highest and lowest possible values of the measured thickness e.g. for the diameter 1.6 p and 1.7 ,u the two extreme values of the chromosome diameter in prophase being in this case 3.2 ,u and 3.4 ,u. -4graph of the changes in chromatid thickness and in the volume of the single chromatid is given in Fig. 8. The volume of a chromatid increases immediately after the dissolution of the nuclear membrane and reaches a maximum in metaphase, just before the beginning of
MITOTIC CHROMOSOMES IN LIVING CELLS
589
2 7
700
w3
60
40
20
0 100 200 300 mr'nutes Fig. 8. A. The change of volume of the chromatid (until beginning of anaphase) and of the chromosome during anaphase. The two ends of each line represent the two volumes calculated for the two possible extreme values in the estimation of the thickness of the chromosome. B. The change in the thickness of the chromatid. The thickness of the whole chromosome (until the beginning of anaphase) was measured and divided by two to obtain the value for the chromatid.
anaphase, when the chromosomes begin to decrease in length again. The volume begins to decrease simultaneously with the start of chromosome contraction just before anaphase and it decreases during the whole of anaphase. The volume of the chromatid of chromosome no. 2 (Figs. 1, 2 and 8) is about 50 pa in prophase, about 105 pa in metaphase just before the beginning of anaphase, and about 70 pa at the start of the cell plate formation. The changes in late anaphase and telophase are more complicated. The thickness of the chromatids is much less uniform than in other
590
A. BAJER
stages. This may be a result of structural changes in the chromosomes: in anaphase the chromosomes, each consisting of a single chromatid, are probably divided into two half-chromatids, and the half-chromatids may separate at the ends of the chromosomes. Thus, the thickness of some chromosome arms, especially at the distal parts, is larger, e.g. Fig. 2 time 320’, 340’, and Fig. 3, chromosome No. 6, time 300’-340’ and others. IV. DISCUSSION There are three factors which may influence thelength of the chromosomes: 1. changes in chromonema length, 2. the course of the spiralization cycle and, 3. changes of chromosome volume. I. Changes in chromonema length
Detailed studies on the changes of chromonema length in meiosis were done by BELLING(1928), MANTON (1939) and SPARROWet nl. (1943). They all conclude that the chromonema length diminishes in certain stages. It was suggested, however, that in mitosis the chromonema length does not change (SAXand SAX1935, MANTON 1939). At present, however, MANTON does not support this statement (accordingto personal communication). The present author considers that the data in the literature do not permit any conclusion as to whether the chromonema changes in length during mitosis or not. 2. The spiralbation cycle
This factor is partly responsible for changes in length of the meiotic chromosomes. The increase in diameter of the chromonema spiral and the decrease in number of its gyres causes a shortening of the chromosomes at meiosis in Osrnunda (MANTON 1949). This factor may also play an important role in mitosis. The diameter of the chromatids increases in mitosis, but so far no data concerning the number of chronionema gyres are available. In the endosperm of Haernanthus the lengths of the individual telophase chromosomes change approximately in the same way, but even homologous chromosomes in the same cell are often of slightly different dimensions. This is also indicated by the measurements of POWERS (1942) who made very precise measurements of chromosome length (error 0.08 p). However, in the opinion of the present author the differences are by far too small to indicate that the coiling in the different parts of the
MITOTIC CHROMOSOMES IN LIVING CELLS
591
chromosomes in Haemanthus is not the same. Differences larger than 10 % occurred in 5 chromosomes, only, out of 24 measured (Table 1) and they never surpassed 16 %. It should be stressed that these differences of 10 ”/. and more were found in homologous chromosomes. In the author’s opinion these differences are too large to be considered as due to the error of measurement, which though difficult to estimate, probably is not greater than a few percent. The measurements were made on very flattened cells and, even though the mechanical conditions permit the general course of mitosis to be normal, the shortening of the chromosomes may meet with some difficulties. The mechanical condition in flattened cells are not uniform in different parts of the cell, which may explain the differences in length between homologous chromosomes. It is possible that there may exist some types of changes in chromosome length which are characteristic of different species. Thus, the pattern of the change of chromosome length in prophase of Leucojum differs considerably from that of Haemanthus (Fig. 9). MANTON (1939) found that the length of anaphase chromosomes of Osmunda is larger than that of the metaphase ones, while in the endosperm of Haernanthus they decrease in length continously throughout mitosis except for a short interval in metaphase. LONGLEY(1941) found that the coiling system of some chromosomes in a set may be different, thus, e.g. the B-chromosomes in maize show distinctly a premature shortening. The opinion that the pattern of coiling may be different in different materials is also suggested by a comparison of the measurements on Haemanthus and Leucojum with those on animal material made by SVARDSON (1945) and WICKBOM (1949). SVARDSON made very exact measurements on fixed chromosomes of Salmo alpinus between late prometaphase and the beginning of anaphase. He found that the chromosomes shorten between these stages and that chromosome arms of different size shorten at different rates, the long arms of the chromosomes showing a greater relative contraction than the short ones. He suggests that: “the contraction in both arms proceeds independently of one another, i. e. the contraction cannot pass the centromere. Thus if the two arms of the chromosome are of unequal length, the index showing the relative length of the arms will be modified’’ (p. 25). He explains this on the assumption that the shorter chromosomes iniatially contract more rapidly than the longer ones. SVARDSON was unable to measure the chromosomes of the earlier stages but this was done by WICKBOM on Bufo bufo (early prophase to metaphase) , Salamandra salamandra and Hyla arborea.
I
T/#E
sured from each cell plotted against the time. Time scale different for different cells, to make them compa e between N. M. D (dissolution of ihe nuclear membrane) and A (beginning of anaphase) is the same time; sc h scale corresponding to 1 hr. The arrows mark the beginning of cell plate formation. Haemanthus kathar 281 and 405 (normal) and 207 (colchicine treated); Leucojnm aestiuum - No 99. The curve for cell No 2 log unit below the scale. The pattern of change of length in all Haemanthus cells including the colchine tre milar. The change in prophase in Leucojum shows some differences i. e. there is no change in lhe rate of d in length at the disappearance of the nuclear membrane.
593
MITOTIC CHROMOSOMES IN LIVING CELLS
P
L09
80 1.8 A
50
Z6
30 14
20 12
1.0
t
TO
0.8
,
60
120
180
240
\
,
300
minutes Fig. 10. Chromosome length plotted on a logarithmic scale against the time. Each of the four upper curves represents mean values of three homologous chromosomes (Fig. 5 4 ) i. e. groups A, B, C, and D (Table I ) . The lowest curve, mean values of the chromosomes Nos: 13, 15, 16, 17, 18 and 20. N . M . D . - nuclear membrane disappearance. A - beginning of anaphase.
He found that "between early prophase and metaphase all chromosomes are shortened by the same percentage irrespective of length. Between mid-prophase and metaphase the shortening is proportionally much greater in 10116 chromosomes than in small ones. Thus between early prophase and mid-prophase the opposite must have taken place. The shortening must have been proportionally stronger in small chromosomes than in long ones" (p. 247-248). This supports SVARDSON'S findings and hypothesis. In Haernanthus the measurements performed on living chromosomes between late prophase and telophase indicate, on the contrary, that all the chromosomes shorten in a similar way in all the stages independently of their dimensions. This is especially nlnnvlrr rhnwn rvhnn t h n 1nunr;thmir- v n l i i n c nf t h e l n n a t h nf l n n u and
594
A. BAJER
short chromosomes are plotted against the time (Fig. 10). The curves are approximately parallel, which supports this conclusion. The data (Table 1) on the length of different arms in Haemanthus do not permit any conclusions as to whether there is a change of the arm ratios during the progression of mitosis, because the error in the measurements of the position of the kinetochore is much greater, especially in prophase, than the error in the measurements of the whole length of the chromosomes.
3. Changes in chromosome volume
The calculation of chromosome volume contains an error which is difficult to estimate. It was assumed in the present study that the cross section of the chromatid is a circle as was done by BELLING(1928), MANTON (1935) and SVKRDSON (1945). In the endosperm of Haemanthus this may not be true during late anaphase and telophase as the chromosomes then appear to be composed of two half-chromatids which may separate from one another at the ends, This error is probably especially important during the later stages. Furthermore, the diameter of a chromosome may not be the same all along its length. Therefore in the author’s opinion the graphs given here show only the general course of the changes in chromosome volume and the numerical data are only approximate. The changes of volume may be caused by changes in the chemical composition of the chromosomes. There is a rapid drop of chromosome mass before the disappearance of the nuclear membrane and during prometaphase until metaphase (RICHARDSand BAJER,1960). There is also a continuous incrase of chromosome concentration (per unit area of a chromosome) from prometaphase until late anaphase, when it shows a tendency to decrease (AMBROSE and BAJER,1960). A change of RNA content during anaphase was shown to occur in the chromosomes of animal cells by JACOBSONand WEBB (1952). SHIMAMURA and OTA (1956) demonstrated this change also in plant cells. In Haemanthus the changes in volume may be caused either by the release of some substances from the chromosomes during anaphase, or by the swelling or shrinkage of certain parts of the chromosomes, i.e. by changes of water content. The processes of hydration and dehydration seem to play an important role in mitosis, as was stressed especially by Japanese workers. A review on the subject was given by KUWADA (1939).
MITOTIC CHROMOSOMES IN LIVING CELLS
595
Acknowledgmentr. - It is a great pleasure for the author to express his deepest gratitude to Miss AUDREY M. GLAUERT of Strangeways Research Laboratory, Cambridge, England, Dr. BRIANRICHARDSof Biophysics Research Unit, King’s College, of Institute of Genetics, London, England and especially to Dr. GUNNAROSTERGREN Lund, Sweden, for very valuable suggestions, kind and constructive criticism and much help during the preparation of this paper.
SUMMARY (1) Measurements of the changes in length of the chromosomes during
mitosis in living cells and calculations of their volumes, from prophase to telophase, were made. Endosperm of Haernanthus katharinae and Leucojum aestiuum was used as the material. The measurements of the length were made on four cells undergoing normal mitosis and on one cell under the influence of colchicine. (2) The chromosomes begin to decrease rapidly in length before the dissolution of the nuclear membrane and continue to decrease in length until metaphase. In metaphase there may be a short period when the chromosomes do not change their length. They start to decrease in length again before the start of anaphase and continue to decrease throughout the whole of anaphase. It is possible that under the influence of colchicine the contraction pattern is slightly modified. (3) Homologous chromosomes may have slightly different lengths in different cells (and even in the same cell) at corresponding stages and also the course of changes may not be exactly the same. (4) The volume of the chromosomes increases until late metaphase when it reaches a maximum, begins to decrease before the start of anaphase and continues to decrease during the whole of anaphase. (5) Some factors which may be responsible for the changes of volume and length of the chromosomes are discussed.
Literature cited AMBROSE,J. E. and A, BAJER.1960. (in preparation). BAJER,A. 1955. Living smears from endosperm. - Experientia (Basel) ff:221. - 1957. Cine-micrographic studies on mitosis. 111. The origin of the mitotic spindle. - Exptl. Cell Research 13: 493-502. BAJER, A. and J. MoLB-BAJER. 1956. Cine-micrographic studies on mitosis in endosperm. 11. - Chromosoma (Berl.) 7: 558-607. BELA&,K. 1929. Beitriige zur Kausalanalyse der Mitose. 111. Z. Zellf. 10: 73-131. BELLING,J. 1928. Contraction of chromosomes during maturation division in Liliurn and other plants. - Univ. California Publ. Botany 14:335-343.
-
38 - Heredltar 45
596
A. BAJER
DARLINGTON, C. D. 1937. Recent advances in cytology. 2nd ed. London. FLEMMING,W. 1882. Zellsubstanz, Kern und Zellbildung. F. C. W. Vogel, Leipzig, pp. 424. JACOBSON, W. and M. WEBB. 1962. The two types of nucleoproteins during mitosis. Exptl. Cell Research 3: 163-183. KAUFMANN,B. P. 1948. Chromosome structure in relation to chromosome cycle. Bot. Rev. 14:57-126. KUWADA, Y. 1939. Chromosome structure. A critical review. - Cytologia (Tokyoj 10: 213-256. LONGLEY, A. E. 1941. Chromosome morphology in maize and its relatives. - Bot. Rev. 7: 263-289. MANTON,I. 1935. Some new evidence o n the physical nature of plant nuclei from intraspecific polyploids. - Proc. Roy. SOC. London. Ser. B. vol. 118: 5 2 2 4 4 7 . 1939. Evidence on spiral structure and chromosome pairing in Osmunda regalis L. - Phil. Trans. Roy. SOC.London. Ser. B. 230: 179-215. 1943. Observations on the spiral structure of somatic chromosomes in Osmundu with the aid of ultraviolet light. - Ann. Bot. 8: 195-212. 1945. Chromosome length a t the early meiotic prophases in Osmunda. - Ann. Bot. 9: 155-178. 1949. Observations made with the ultraviolet microscope on the minor spiral of the chromosomes in Osmunda. Bioch. Bioph. Acts 3:570-584. 1950. The spiral structure of chromosomes. - Biol. Rev. 25:486-508. NEBEL, B. R. 1939. Chromosome structure. - Bot. Rev. 5:563--626. OSTERCREN,G. 1944. Colchicine mitosis, chromosome contraction, narcosis, and protein chain folding. - Hereditas 50: 429-467. - 1951. Narcotized mitosis and the precipitation hypothesis of narcosis. C. N. R. S. Colloques Internationaux vol. 26. MBcanisme de la narcose pp. 77-88. POWERS,PH. B. A. 1922. Metrical studies o n sperniatogonial chromosonies of Acrididae (Orthoptera). - J. Morph. 71:523-57G. RICHARDS, B. and A. BAJER.1960. (in preparation). SAX, H.'J. and K. SAX. 1935. Chromosome structure and behaviour in mitosis and meiosis. - J. Arnold Arbor. 16: 4 2 3 1 3 9 . SPARROW, A. H., HUSKINS,C. L. and G. B. WILSON. 1941. Studies on chromosome spiralization cycle in Trillium. - Canadian, J. Res. 19: 323-350. SVXRDSON, G. 1945. Chromosome studies o n Salmonidae. - Med. fr. Stat. Unders. 0 . Forsoksanst. f. Sotvatt. 23: 1-151. SHIMAMURA, T. and T. OTA. 1956. Cytochemical studies on the mitotic spindle and Exptl. Cell. Research 11: 3 4 6 3 8 1 . the phragmoplast of plant cells. WICKBOM, T. 1949. The time factor of chromosome spiralization. - Hereditas 35: 245-248.
-
-