38
IEEE JOURNAL OF OCEANIC ENGINEERING, VOL. 36, NO. 1, JANUARY 2011
Coherence-Based Underwater Target Detection From Multiple Disparate Sonar Platforms J. Derek Tucker, Student Member, IEEE, and Mahmood R. Azimi-Sadjadi, Senior Member, IEEE
Abstract—This paper explores the use of multichannel coherence as a tool for detection of underwater targets from imagery captured from multiple disparate sonar systems. The use of multiple disparate sonars allows one to exploit a high-resolution sonar with good target definition while taking advantage of the clutter suppression abilities of a low-resolution broadband (BB) sonar coregistered over the same region to provide much better detection performance comparing to those of the single-sonar cases. In this paper, the standard Neyman–Pearson detector is extended to the dual disparate sonar case allowing target detection across two sensory channels simultaneously. A novel distributed detection system is also developed that exploits the use of multiple dual-sonar detectors for multiplatform target detection. Test results of the proposed detection methods are also presented on an underwater synthetic aperture sonar (SAS) imagery database containing data from three different imaging sonars operating at three different frequencies and resolutions. Test results illustrating the effectiveness of different coherent-based detection systems will be presented and benchmarked against those of two other detection methods in terms of probability of detection, false alarm rate, and the receiver operating characteristic (ROC) curve. Performance gains of about 23% in probability of detection were achieved over the benchmarked methods. Index Terms—Binary hypothesis testing, disparate sensor platforms, two-channel coherence analysis, underwater target detection.
I. INTRODUCTION ETECTION of underwater objects in sonar imagery is a complicated problem due to various factors such as variations in operating and environmental conditions, presence of spatially varying clutter, and variations in target shapes, compositions, and orientation. Moreover, bottom features such as coral reefs, sand formations, and vegetation may obscure a target or confuse the detection process. Consequently, the development of a robust detection system that is able to quantify changes between the returns from the bottom and any target activity in sonar images is highly desirable.
D
Manuscript received June 30, 2009; revised July 20, 2010; accepted November 15, 2010. Date of publication January 20, 2011; date of current version March 18, 2011. This work was supported by the U.S. Office of Naval Research (ONR) under Contract N00014-08-1-0142. Associate Editor: D. A. Abraham. J. D. Tucker was with the Department of Electrical and Computer Engineering, Colorado State University, Fort Collins, CO 80523-1373 USA. He is now with the Naval Surface Warfare Center Panama City Division, Panama City, FL 32407-7001 USA (e-mail:
[email protected]). M. R. Azimi-Sadjadi is with the Department of Electrical and Computer Engineering, Colorado State University, Fort Collins, CO 80523-1373 USA (e-mail:
[email protected]). Color versions of one or more of the figures in this paper are available online at http://ieeexplore.ieee.org. Digital Object Identifier 10.1109/JOE.2010.2094230
The existing work in the area of target detection from sonar imagery is primarily focused on using only one sonar system. Dobeck [1], [2] utilized a nonlinear matched filter to detect mine-size regions that match the target template in a sidescan sonar image. For each detected region, several features were extracted based on the size, shape, and strength of the target return. A stepwise feature selection process was then used to determine the subset of features that maximizes the probability of detection and classification. A -nearest neighbor and an optimal discrimination filter classifier were used to classify each feature vector and the decisions of the two classifiers were fused to generate the final decision. In [3] and [4], the adaptive clutter filter detector in [5] is individually applied to three different sonar images varying in frequency and bandwidth. Final decision making is done using an optimal set of features using the log-likelihood ratio test where the decisions of the individual classifiers are fused. Chandran presented [6] the use of a matched filter designed to capture the target structure. Higher order spectra were then extracted from the phase of the Fourier transform as features to classify objects. A -nearest neighbor classifier, a minimum distance classifier, and a threshold-based classifier were used. The outputs of the three classifiers were fused to yield a final decision. However, the use of a matched filter is not ideal as a detector, as targets can vary greatly in shape, composition, and orientation in the sonar images, hence leading to missed detections. Vera recently presented [7] a method based on the Hilbert transform where he used the transformed image to detect highlight and shadow structures with target size priors. Geometrical features were then extracted and subsequently classified using a classification tree. Recently, the canonical correlation analysis (CCA) method [8]–[10] has been applied to underwater target detection and classification from sonar backscattered data [11]. The CCA method not only quantifies the amount of linear dependence or coherence [8] between two data channels (e.g., two sonar pings with certain ping separation) but also determines the coherence pattern of the two data channels via the extracted canonical correlations. These correlations and the corresponding canonical coordinates allow one to quantify the changes between the returns from the bottom and when target activities are present. Additionally, the canonical correlations provide useful features for target classification without the need to perform separate detection and feature extraction. More specifically, coherence patterns represented by these features are shown to be different for pairs of pings that contain mine-like objects than those that contain nonmine-like objects hence allowing good mine-like versus nonmine-like discrimination. In [12], this coherence
0364-9059/$26.00 © 2011 IEEE
TUCKER AND AZIMI-SADJADI: COHERENCE-BASED UNDERWATER TARGET DETECTION FROM MULTIPLE DISPARATE SONAR PLATFORMS
analysis method was extended to the frequency domain by measuring coherence between the same frequency subbands in two sonar pings. Comparing to the time-domain coherence-based features [11], these frequency-domain features are shown to provide substantially better detection and classification results. Additionally, the frequency-domain coherence-based feature extraction method offers a more rigorous way of generating acoustic-color for possible target identification from multiple-sonar pings. The application of CCA method for the underwater target detection from sonar imagery was first explored in [13]. In this work, canonical correlations and coordinates were extracted from consecutive columns of a region of interest (ROI) within a sonar image and used to perform target detection. From the detected ROIs the corresponding canonical correlations may also be used for target classification. The issue faced with all of the aforementioned detection and classification systems is that they rely on observations made from only one sensory system (in this case one sonar) and hence the performance is limited to only one field of view (FOV). This makes the detection of weak targets particularly challenging and limits any possible improvement in the detection performance. Detection using multiple disparate sensors, on the other hand, offers a promising solution to overcome these shortcomings as it allows for significantly better capture of the target characteristics, because the targets are viewed from different aspect, grazing angle, range, frequency, and perhaps sensing modalities. This principle is true regardless of how the data are processed at the fusion center. However, the network-centric sensor analysis mode (NSAM) requires careful considerations of the local (sensor-level) computational requirements, communication network bandwidth limitations, and more elaborate search planning when sensors (e.g., sonar or electro-optical) are on multiple disparate autonomous underwater vehicles (AUVs). Moreover, since preliminary decisions and feature extraction are often carried out independently at each platform, the fusion center may only have access to partial or incomplete information hence resulting in loss of overall performance. Collaboration among disparate decision makers reduces this uncertainty in decision making in real-time NSAM situations while fully exploiting the limited communication and processing resources. However, this comes at the price of somewhat more complicated sensor management strategies. To allow collaborative decision making among multiple sensor platforms, it is essential to detect and further scrutinize the information-bearing parts of the data collected by various sensory systems. This involves detecting, isolating, and representing (in terms of some pertinent attributes) the coherent information among the multiple data sets. This is a challenging problem due to disparate nature of this problem. Thus, new algorithms are needed to: 1) collaboratively detect and agree on threats occurring within the FOV of the sensors; 2) perform feature extraction to capture common target attributes from multiple sensor platforms; and 3) develop a single integrated target assessment picture based upon the detected and localized targets from multiple disparate platforms. With these goals in mind, this paper develops a composite two-channel Gauss–Gauss detector for underwater target detection from dual sonar systems. In this framework, the CCA
39
channels contain composite vectors associated with either background alone ( or null hypothesis) or target plus background ( or true hypothesis). This is in contrast to the standard CCAbased detector [10], which uses the assumption that one of the CCA channels is always signal only and the other channel is the observation. With these changes in the two hypotheses, new expressions for the log likelihood and -divergence are derived taking into account the composite nature of this two-channel hypothesis testing. The goal here is to relate these measures to their single-channel counterparts [10], [14] for ease in impledisparate mentation. To extend this framework to multiple sonar platforms and hence greatly improve the detection performance, by using more observations from the environment, a distributed detection system is also developed. In this system, the composite two-channel Gauss–Gauss detector for dual sonar is employed as the local decision maker at each platform. This distributed detection system is particularly useful in scenarios where there could be multiple AUVs in a surveillance area each equipped with two sonar (or any other sensory) systems. Each decision maker on a platform transmits its decisions to a fusion center where a final decision making takes place. Thus, this distributed multiple-sonar platform detection system requires minimum communication bandwidth since only decisions and some local features are transmitted to the fusion center. Additionally, the proposed system is simple to implement, versatile, and modular as it can easily incorporate any number of sensor platforms with possibly different sensor properties in the detection and localization of the threats. We will demonstrate the usefulness of both systems in improving the overall detection performance on a sonar imagery data set provided by the Naval Surface Warfare Center Panama City Division (NSWC PCD, Panama City, FL). This data set consists of sonar imagery from a high-resolution high-frequency (HF) synthetic aperture sonar and two broadband (BB) synthetic aperture sonars with images that are coregistered over the same region. These images contain either no targets, one target, or multiple targets. This paper is organized as follows. Section II provides a review of the standard Gauss–Gauss detection and its relation to CCA. Section III develops the composite two-channel Gauss–Gauss detector for dual sensor problems in the CCA framework. The distributed detection system together with the corresponding fusion rule is also presented in Section III. In Section IV, the effectiveness of the proposed systems is demonstrated on the acquired multiple-sonar data set. Finally, conclusions and observations are made in Section V. II. REVIEW OF GAUSS–GAUSS DETECTION In this section, a brief review of the standard Gauss–Gauss detection method [14] is presented first by defining the hypotheses and formulating the log-likelihood ratio decision rule and -divergence detectability measure. These formulations are then expressed [10] in terms of the canonical coordinates and correlations using the CCA framework. , which is repreAssume we have an observation sented by a normal random vector with zero mean and covariance matrix . A classical detection problem is to test between , i.e., noise alone and hypothesis hypothesis , i.e., signal plus noise, where
40
IEEE JOURNAL OF OCEANIC ENGINEERING, VOL. 36, NO. 1, JANUARY 2011
is the covariance matrix of the signal and is the covariance matrix of the noise alone. It is assumed that the noise and signal are uncorrelated. For this Gauss–Gauss detector, the log-likelihood ratio test, which minimizes the risk involved in deciding and , can be given [14] as between
where with is the likelihood ratio function and is the detection threshold. The matrix can be written as [14] (1) where , which is known as the signal-to-noise ratio (SNR) matrix, is defined as (2) Now, we can rewrite the log likelihood
as
Thus, we only need to solve the eigenvalue problem in (6) to and eigenvalues for computing obtain the eigenvectors the log-likelihood ratio in (8) and the -divergence in (7). A. Gauss–Gauss Detection in CCA Framework CCA offers a suitable framework for Gauss–Gauss detection in which the log-likelihood ratio and -divergence measure defined in Section II are expressed in terms of the canonical coordinates and canonical correlations [10]. This allows one to determine the contribution of each canonical correlation to the log-likelihood and the -divergence detectability measure. For a review of CCA, the reader is referred to the Appendix. In the two-channel CCA-based detection framework, channel corresponds to signal alone data; i.e., with covariance matrix whereas channel could (i.e., ) with covariance matrix be either noise under or signal plus noise under (i.e., ) with . Thus, under hypothcovariance matrix esis , the composite vector has a covariance matrix
(3) where is clearly a normal random vector with zero under , and under mean and covariance matrix i.e., and , where is the expectation operation under , and is the expectation . operation under The -divergence [14] between the two hypotheses, which can be used as a measure of detectability, is
(9) Additionally, under hypothesis
, matrix
can be rewritten
as (10) Now, it can easily be shown [10] that the log likelihood in (3) may be rewritten as
(4) where matrix
denotes the trace operation on a matrix. The SNR can be decomposed as (5)
where is a diagonal matrix with diagonal elements that are the eigenvalues of , and is the eigenvector matrix containing the corresponding eigenvectors in its column space. This implies that solves the following generalized eigenvalue problem [14]: (6) Using (5) and the cyclic property of the trace, the -divergence in (4) can be rewritten as
(11) where is the canonical correlation matrix with diagonal elements that are the canonical correobtained from the singular value decomposition lations (SVD) of the coherence matrix , is the canonical coordinate vector and ) with canonical coordinates , for the channel, (under i.e., . It can also be shown [10] that the -divergence between and may be expressed in terms of the matrix or canonical correlations as (12)
(7) Using the eigenvalue decomposition of , the log-likelihood ratio may also be rewritten as (8)
is nonincreasing in the interval where the function . The -divergence between the two hypotheses considering -dominant canonical correlations is then (13)
TUCKER AND AZIMI-SADJADI: COHERENCE-BASED UNDERWATER TARGET DETECTION FROM MULTIPLE DISPARATE SONAR PLATFORMS
where is the composite observation vector and with . The covariance matrices and , are given by under hypotheses
41
and
,
(16)
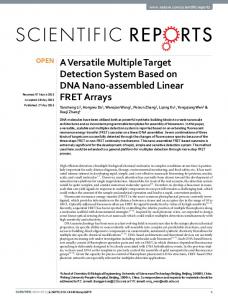
Fig. 1. Coherence-based detector for composite channel hypothesis case.
(17) Consequently, the rank- detector that maximizes the divergence is the detector that uses the canonical coordinates corresponding to the -dominant canonical correlations, i.e., or those that are sufficiently close to one. That is, for building low-rank detectors, only the dominant canonical coordinates need to be retained.
respectively. Note that and are the covariance matrices defined in Section II for the single-channel detector. The expectation of the likelihood leads to the composite -divergence [15]
(18)
III. COMPOSITE TWO-CHANNEL GAUSS–GAUSS DETECTION As mentioned before, to develop a coherent-based detector for detection from two disparate sonar platforms, the composite channel contains either background noise vectors or target (signal) plus background noise vectors. In this section, we will develop the hypotheses and then derive the log-likelihood ratio and -divergence expressions for the composite hypothesis testing problem. Fig. 1 illustrates this hypothesis testing problem where the composite channel for the two hypotheses is
Using (17), we can relate the composite -divergence and or to the SNR matrix in the stanin (18) to dard Gauss–Gauss detector in Section II. Let us first express in (18) as (19) where was defined in (2) with eigenvalue decomposition (5). by rewriting as Next, we express
(20)
(14)
Under certain conditions, it is possible to relate the formulations of the log likelihood and -divergence for this composite two-channel detection problem to the corresponding ones in the standard single-vector case presented in Section II. This will result in reduction in the dimensionality of the channels and hence considerable computational savings. Additionally, it would provide much better insight into the relationship between coherence measures in the composite two-channel and singlechannel cases. The conditions and assumptions that must be satisfied include: 1) mutually uncorrelated , , and , i.e., and , for , ; 2) signal (target) contributions in both sonar platforms are the ; and 3) both channels contain uncorresame with , lated noise (background) with the same covariance matrix i.e., , for . Clearly, these assumptions may not be true in real dual disparate sonar situations, in which case one can always use the method in [14] where the data vector is the concatenated version of the two sensory channels. In Section IV-B, we will compare the results of the method developed in this section to those of the general one in [14]. For this composite hypothesis testing, the Gauss–Gauss detection test becomes (15)
Now, using the matrix inversion lemma [16, p. 50] and after simplification, we get
(21) Applying the matrix inversion lemma again to the common term gives
Thus, the diagonal blocks in (21) can be rewritten as
leading to
(22)
42
IEEE JOURNAL OF OCEANIC ENGINEERING, VOL. 36, NO. 1, JANUARY 2011
Now, using (19) and (22), the composite -divergence in (18) becomes (23) Using the eigenvalue decomposition of
in (5), we get
(24) Since the eigenvalues of , , are related to the squared of the single-channel problem by canonical correlations [10], we can rewrite the composite -divergence in (24) in terms of these canonical correlations as (25) To express the log likelihood in use the result in (20) for
in terms of
and , we . This gives Fig. 2. Block diagram of the distributed detection system for multiple-sonar platforms. (a) Overall layout. (b) Fusion center.
(26) If we choose
then (27) where . The log likelihood is now rewritten from the standard single-channel detector in terms of and in Section II. in terms of the squared Now expressing coherence matrix of the single-channel problem and using yields (28)
where
is the composite canonical coordinate vector
under hypothesis when both channels consist of signal plus noise. This expression relates the composite two-channel log likelihood to the single-channel (see Section II-A) canonical and canonical coordinate vectors and ascorrelations and , respectively, i.e., with two sociated with . different noise realizations, under
A. Extension to Multiple Disparate Sonar Platform and Distributed Detection To extend the composite CCA-based detector to multiple disparate sonar platforms where each platform contains two sonar systems (e.g., one HF sonar and one BB sonar), we propose the distributed detection system as shown in Fig. 2 where a local and at each decision maker. decision is made between This system is inspired from the work in [17, Ch. 3.3] and [18]. In the proposed system, each local decision maker, denoted by where is the number of platforms, makes its independent observation from the environment. The motivation behind this approach is that by using multiple distributed composite CCA-based detectors (one on each AUV platform) one can greatly reduce the false alarm rate and increase the overall detection rate by using more observations from the environment. Moreover, by performing the image-based detection at each of the local decision makers and only transmitting their local decisions, one can greatly reduce the amount of data that needs to be transmitted from the disparate platforms to the fusion center, which could be on another more equipped AUV or on the mother ship. We will assume that the prior probabilities of the two hyand are and , respectively. Each local potheses decision maker then receives a composite observation vector , . These observations are assumed to be conditionally independent with respect to each decision maker and , , . have known conditional densities to The local decision makers then send their local decisions the fusion center where, based upon the received local decisions from the environment, and an additional observation vector
TUCKER AND AZIMI-SADJADI: COHERENCE-BASED UNDERWATER TARGET DETECTION FROM MULTIPLE DISPARATE SONAR PLATFORMS
the fusion center makes a final aggregated decision . The obcan be any observation made either by the servation vector sensor on the platform with the fusion center, if it happens to be in the same surveillance area, or in practice could be any other measurements (e.g., some statistical measures) taken from the same environment (e.g., by one of the AUV designated as the team head). Clearly, in the former case, one does not need to transmit these additional data, while in the latter case, these auxiliary measurements need to be transmitted to the fusion center. However, since the number of such measurements is very small, the impact on the communication load is minimal. , Let us denote the decision rule of the fusion center as and denote as the where . decision rule of the th local decision maker, i.e., Furthermore, let us assume that the overall cost is a function and the true hypothesis. In other of only the final decision be the cost of decision by the fusion center words, let is true. We will make the assumption that when hypothesis the cost of making erroneous decisions is greater than the cost and . Therefore, of a correct decision such that the expected cost we need to find the decision rule is minimized where the expectation is over the team of local decision makers. If we assume that the decision rules of the local decision makers are given, then the optimal strategy for the fusion rule is a likelihood ratio test using the centralized Neyman–Pearson lemma [19, Ch. 3.2]. Here we assume that the decisions and are conditionally independent, and therefore the likelihood ratio test is given by [17, Ch 3.3] (29) where
is the fusion decision threshold and is defined as
43
and that are posteriori conditional densities generated at the outputs of the PNN or the BPNN. This gives
(32) The PNN, which implements the Parzen nonparametric probability density function estimation and Bayes decision rule, can . The PNN be used to estimate the conditional densities consists of three feedforward layers: the input layer, the pattern layer, and the summation layer [22]. Data vectors are applied to the input layer, which passes them to each neuron in the pattern layer. The pattern layer consists of pools of pattern neurons, where is the number of hypotheses (in this case ). , there are pattern neurons, each of In each pool which represents exactly one pattern from the training set for , . For the input observation vector hypothesis with dimension , the output of each pattern layer neuron is
(33) is the weight vector of the th neuron in the th pool, where and the nonlinear function represents the activation functions of the neurons. In the summation layer, the th neuron as, , forms the weighted sum sociated with hypothesis of all the outputs from the neurons in the th pool in the pattern layer. The weights in the summation layer are determined by the decision cost function and the prior hypotheses probabilities. For the “0–1” cost function and equally likely hypotheses, the weights will be one for all the neurons in the summation layer. For the input pattern of an unknown hypothesis, a final decision is made through a simple comparison of the PNN out, i.e., puts if
(34)
(30)
For the local decision makers, since we assumed that the observations are conditionally independent and further the fusion rule is known, the optimal decision rule for the th local decision maker becomes a likelihood ratio test given by [20, Ch. 2.2], [17, Ch. 3.3] (31) where is the local decision threshold at the th decision maker. Note that since the coherence-based detector used at each decision maker is a likelihood ratio test, the above fusion rule will be optimal. and for To find the conditional densities the fusion rule, one may use a density estimator such as the probabilistic neural network (PNN) or backpropagation neural network (BPNN) [21, Ch. 4], [22]. To make the fusion rule more suitable for the neural-network-based density estimators, one may use Bayes’ rule to rewrite the fusion rule in terms of the a
or otherwise. Under certain conditions [21], [22], the outputs of the PNN correspond to the a posteriori conditional probabilities, i.e., , when , i.e., the weight vector of the th neuron in pool 1 is set to the training sample belonging to hypothesis . Although this training process is very fast, a very large network may potentially be formed, especially if the number of samples in the training set is large. To generate the likelihood ratio needed in (32) from the two PNN outputs for the binary hypothesis problem, we simply use , where “ ” means normalized such that . This accounts for numerical inaccuracies in estimating the conditional densities as PNN can produce , which is not acceptable. Thus, the case implies that the PNN strongly believes , means that the PNN strongly believes while . In the case when , i.e., tie case, is chosen to avoid missing weaker targets. , , , that The conditional densities represent the confidence in local decision maker’s decisions
44
IEEE JOURNAL OF OCEANIC ENGINEERING, VOL. 36, NO. 1, JANUARY 2011
can be generated using a BPNN [21]. Once the BPNN-based ’s probability estimator has received , it estimates such that (35) where is the th output of the BPNN for the decision . The BPNN is trained to capture this mapping between the local decisions in the training data set and the hypothesis . It is well known [21, Ch. 4] that, if properly trained, the BPNN performance approximates an optimal Bayesian estimator. Using the trained PNN and BPNN, the final decision rule in (32) can then be implemented and used to make a final decision based on all the local decision makers’ local decisions and the observation vector from the environment. IV. TEST RESULTS ON MULTIPLE-SONAR IMAGERY In this section, we discuss the results of applying the proposed coherence-based detection methods to a multiple-sonar data set provided by the NSWC PCD. The characteristics of this data set are described next. A. Data Description The multiple-sonar data set consists of a high-resolution HF synthetic aperture sonar image as well as two BB sonar images coregistered over the same region of the seafloor with the images captured from multiple target fields. The two BB sonar images are actually formed from one BB sonar by bandpass filtering the returns to capture two different nonoverlapping parts of the frequency band. The coregistration is easily accomplished as the two sonar systems are mounted on the same AUV and use the same receive hydrophone array. The pinging for the HF and BB sonar systems is done simultaneously as they are sufficiently far apart in frequency such that the returns are easily separable. More information on high-resolution HF and BB sonar can be found in [23], [24] and in [25], [26], respectively. The sonar images in this data set are complex-valued and are generated by a -space or wave number beamformer [27], [28, Ch. 6.2], which computes the 2-D Fourier transform of the raw or range-compressed sonar data in the delay-time/aperture domain. This converts the data into the spatial frequency/ -domain where it is multiplied by the power wave number spectrum of the transmitted waveform. A change of variables is done by Stolt interpolation [29]. This change of variables -domain into the wave maps the frequency/wave number number domain . The inverse 2-D Fourier transform is then taken of the mapped data to form the complex image. For more information on the -space/wave number beamformer the reader is referred to [28, Ch. 6]. As mentioned before, the sonar images captured by different sensor systems are coregistered so that the pixels correspond to the same section on the seafloor. This is important, because each sonar is operating at a different frequency and beamwidth and has different spatial resolution hence providing a different size image. Thus, for this data set, disparateness is in frequency, resolution, and beamwidth of these sonar systems but not in the location. Examples of HF and BB sonar images in the data set are presented in Fig. 3(a) and (b), respectively.
Fig. 3. Example of (a) HF (2400 pixels) sonar images.
2 2061 pixels) and (b) BB (800 2 4122
This data set contains 59 images from each of the three sonar systems. There are 53 different targets with some sonar images containing more than one target. It must be pointed out that the areas covered by these sonar images do not overlap on the seafloor and further there are not multiple looks at the targets. Moreover, the images in the data set are captured from multiple target fields. The HF sonar images are 2400 2061 pixels, while the BB images are 800 4122 pixels. The average target size encountered in this data set is found to be 65 100 pixels and 20 208 pixels for the HF and BB sonar images, respectively. The backgrounds in these images correspond to extremely rough bottom with large amounts of rock and coral structures, sand ripples, and sea grass (see Fig. 3). Thus, the motivation behind using this multiple-sonar data set is to reduce the false alarm rate caused by the challenging bottom conditions. This improvement in the detection performance is expected, because the HF sonar provides higher spatial resolution and better ability to capture target details and characteristics. In the HF sonar image, the highlight, dead zone, and shadow
TUCKER AND AZIMI-SADJADI: COHERENCE-BASED UNDERWATER TARGET DETECTION FROM MULTIPLE DISPARATE SONAR PLATFORMS
45
than those of the targets. Therefore, the use of multiple disparate sonar systems allows one to exploit a high-resolution HF sonar with good target definition while taking advantage of the clutter suppression ability of a low-resolution BB sonar coregistered over the same region to provide potentially much better detection performance comparing to those of the single-sonar cases. We will first present the results of the dual disparate sonar detector in Section III that uses one HF sonar image and one BB sonar image. We will then present the results of distributed detector for multiple (3) sonar images and compare the results with those of the single dual-sonar detector. B. Dual-Sonar Detection Results
Fig. 4. Example of HF and BB target snippets. (a) HF (72 BB (24 224 pixels).
2
2 112 pixels). (b)
structures typically have good definitions with each having a definite shape and adequate number of pixels. Fig. 4(a) demonstrates this structure for HF sonar image target example of size 72 112 pixels, where the highlight corresponds to the bright pixels, the shadow is the dark pixels, and the dead zone is the small band of light pixels in-between. Nonetheless, these structures will be prominent for structured clutter as well (e.g., coral reefs and sand ripple). In a BB sonar image, however, the target structure is not as well defined. More specifically, a target will primarily show up as a highlight with no prominent dead zone or shadow structure. Fig. 4(b), which is one of the BB sonar images of the same target (24 224 pixels) in Fig. 4(a), illustrates this lack of dead zone and shadow structure. Nonetheless, the signature of the clutter is also suppressed hence leading to substantially lower number of detected contacts in BB sonar images. However, some structured clutter will show up as bright spots, though they tend to be at a smaller magnitude and size
The block diagram of the dual-sensor detector, which uses an HF and a BB sonar images, is shown in Fig. 5. Although the HF and BB sonar images observe the same area at different resolution, beamwidth, and frequency characteristics, the target returns in these two images are more coherent than those of the background (detection hypothesis). The CCA-based detector exploits this high coherence between the two sonar images when targets are present. A side benefit of the CCA-based detector is that the canonical correlation features that capture the coherence remain somewhat unchanged [8] to linear perspective transformation on the images, which could be caused by variations in grazing angle and elevation of the platform. Additionally, in [10]–[12] and [18], these canonical correlation features were used to classify the underwater objects into mine-like versus nonmine-like classes. For the dual-sonar detector, the pair of HF and BB sonar images is partitioned into ROIs with a 50% overlap along both range and cross-range directions. The ROI sizes for the HF and BB sonar imagery were experimentally determined to be 72 112 pixels and 24 224, respectively, based upon the average sizes of targets encountered in these images and is a logical design choice. Each ROI is then channelized (for the two-channel CCA) by a rectangular blocking scheme with the dimension of the blocks for the HF and BB sonar images being 6 4 and 2 8 pixels, respectively. The block sizes are chosen according to the size of the ROIs or the resolution of the sonar images. The blocks are taken in a raster-scan fashion from a ROI, where each block is vectorized into a column vector or depending on the channel (see Fig. 5). These blocks form realizations of the two channel data in the CCA process. The canonical coordinates and correlations are then computed for each pair of ROIs using these samples and subsequently used in (25) and (28) to compute log-likelihood ratio and the -divergence, respectively. To show the separability (hence prove our detection hypothesis) of the dominant canonical correlations for ROIs that contain targets over background and those that contain only background, a test was conducted on a set of 72 target ROIs and 72 background ROIs, which were selected at random. Note that owing to the 50% overlapping in the range and cross-range directions there are 212 possible ROIs that contain targets. Thus, this subset contained about 1/3 of the possible target ROIs. The selected background ROIs consisted of a mix of structured and nonstructured clutter. This subset is a very small portion of all possible background ROIs in this data set. Fig. 6 shows the mean
46
IEEE JOURNAL OF OCEANIC ENGINEERING, VOL. 36, NO. 1, JANUARY 2011
Fig. 5. Coherent-based detection and feature extraction block diagram for disparate sonar platforms.
Fig. 6. Plot of statistical distribution of canonical correlations for target and background for dual-sonar HF–BB.
and standard deviations computed for all 16 canonical correlausing ROIs containing targets and those tions containing background only. Mean values are shown by “x” for target and “o” for no target and the length of each bar represents the corresponding standard deviation. As can be seen, there is good separation between targets and background, especially for dominant canonical correlations, which are the first five correlations, as the means are highly separated. This can be attributed to the greater coherence between and channels (or between HF and BB sonar images) across the target ROIs versus those over background clutter where there is more randomness. This is shown in Fig. 6 by how close the dominant target canonical correlations are to 1; the closer is to 1, the more coherent is to (see the Appendix and [8]). Fig. 7 shows the histogram of the log-likelihood ratio values for a single target ROI and a single background ROI in the dual HF–BB detector. Using the training set described above, which consists of the 72 target and the 72 background ROIs, a detection threshold (shown by the dashed vertical line in Fig. 7) . This threshold is found by was determined to be forming the receiver operating characteristic curve (ROC) for this training set and then finding the threshold corresponding to
Fig. 7. Histogram of example log-likelihood values for target and background for HF–BB.
the knee point, where , on the ROC which typically corresponds to the detector operating point [30]. This detection threshold is then used for the detection process on all the ROIs in all the sonar images in the data set. That is, for each pair of blocks within a ROI pair, if the log-likelihood ratio falls above this prespecified detection threshold the block is flagged as a target block for that ROI pair. Note that the same threshold can be used on other similar data sets as long as the sonar properties do not change. A detection score is then created for the ROI pair based on the percent of their constituent block log-likelihood measures that fall above the detection threshold. A detection score 50% signifies (i.e., more than 50% of the constituent blocks in the ROI pair are declared as target) presence of a target within that pair of ROIs. The dual HF–BB detector was then applied to the entire data set. This system detected 51 of the 53 targets with an average of 10.13 false detections per image, which is acceptable due to the difficult bottom conditions in this data set. The ROC curve for the dual-sonar HF–BB detector is presented in Fig. 8 by the solid curve. The ROC was generated by sweeping the detection threshold in (15) for the block-wise log-likelihood measure. Note that the ROI-based detection score of 50% is not changed as it is independent of detection threshold . At
TUCKER AND AZIMI-SADJADI: COHERENCE-BASED UNDERWATER TARGET DETECTION FROM MULTIPLE DISPARATE SONAR PLATFORMS
47
Fig. 9. Block diagram of the multiple-sonar platform distributed detection system.
Fig. 8. ROC curve for the HF–BB detector and comparisons.
the knee point of the ROC curve, we have 95% and 5%. It was observed for those targets that were missed that the coherence was low, because the target only appeared in one of the images. The performance of our coherence-based detector was compared to the standard Gauss–Gauss detection method presented in Section II-A, where we concatenated the with the BB channel to formulate the deHF channel tection problem as a one-channel problem and implemented the detector in the same manner as described previously with the . This detection threshold chosen experimentally to be standard Gauss–Gauss detector detected only 42 of the 53 targets with an average of 56 false alarms per image, which is not acceptable. The ROC curve for this detector is also presented in Fig. 8 by the dashed curve where at the knee point of the ROC 70% and 30%. It is interesting to curve we have note that though in Section III we made several simplifying assumptions to develop our composite Gauss–Gauss detector, the performance of our detector is by far better than the standard counterpart. This can be attributed to the ability to utilize the coherence between the two sonar images. Additionally, we have also compared our detection results to those generated using the detector recently proposed by Vera [7]. This detector uses Hilbert transform and target size priors to perform detection on a single-sonar image. To compare the results of the detector with ours we ran Vera’s detector on the entire data set by taking the Hilbert transform of the image, thresholding the resulting image, and then rejecting any object that was three times greater in size than our average target size. We then computed the number of objects detected per image. Using the same training data, the detection threshold for this detector was chosen to be 0.1131. This detector detected 49 of the 53 targets with an average of 50 false alarms per image. The ROC curve produced by this method on the entire data set is shown by the dashed–dotted curve in Fig. 8. At the knee point 72% and 28%, which is subof this ROC, we have stantially inferior to those generated using the proposed composite Gauss–Gauss detector in Section III. Overall, our coherence-based detector performed extremely well given the small
number of samples used to form the detection threshold. Moreover, the number of false alarms per image generated by our detector is very reasonable and much smaller than those of the benchmarks. This would greatly reduce the load on the subsequent classification step, which classifies the detected ROIs into mine-like versus nonmine-like objects. To improve the overall detection performance and increase the practical feasibility of the coherence analysis framework in realistic multiple disparate sonar systems the use of multiple decision makers is a necessity. The motivation behind the proposed distributed detection setup is that by using multiple AUVs each equipped with two sensor systems and a local detector one can perform high confidence target detection. In Section V, we demonstrate effectiveness of the proposed distributed detection framework in Section III-A on this multiple-sonar data set. C. Multiple-Sonar Platform Distributed Detection Results The block diagram of the multiple-sonar detection system that uses three sonar images is presented in Fig. 9, in which the three sensor systems are on the same platform as described in Section IV-A. As can be seen, the first dual-sonar detector uses the HF image and one of the BB sonar images with a different spatial resolution, while the second dual-sonar detector uses that same BB and the second BB sonar image with the same resolution but different frequency characteristics. The nonoverlapping frequency bands of BB and BB span the frequency band of the BB sensor as described before. These dual-sonar detectors become the two local decision makers in the distributed detection system in Fig. 2. We refer to these local decision makers by HF–BB and BB –BB , respectively. The reason for using two BB sonar images in the second detector is that the coherence information can be exploited to suppress clutter ROIs and detect potential targets, while the coherence information in the first detector solidifies the decision in the second one by verifying the joint presence of the target in both the HF and BB images. The detection process at each dual-sonar detector (or decision maker) is the same as that described in Section IV-B. That is, the log-likelihood ratio is computed for the corresponding blocks within the ROI pair for HF–BB and BB –BB detectors using the extracted canonical coordinates and correlations for each pair. The outputs of each dual-sonar detector is then fused to generate a final decision using the fusion rule in (32), hence
48
IEEE JOURNAL OF OCEANIC ENGINEERING, VOL. 36, NO. 1, JANUARY 2011
Fig. 11. Histogram of example log-likelihood values for target and background for both detectors. (a) HF–BB detector. (b) BB–BB detector. Fig. 10. Plot of statistical distribution of canonical correlations for target and background for both detectors. (a) HF–BB detector. (b) BB –BB detector.
leading to reduced number of false alarms and missed detections comparing to those of the individual detectors. To show the separability of the principal canonical correlations that contribute the most to the separability of the two hypotheses, a test was conducted on the training set ROIs described in the dual-sonar case with the corresponding ROIs of the third sonar included. Again, the mean and standard deviations of each of the 16 canonical correlations are computed and presented in Fig. 10(a) and (b) for the HF–BB and BB –BB detectors, respectively. As can be seen, for both pairs of sonar images, there is reasonable separation among the canonical correlations formed from target over background ROIs and those from background only ROIs. This is especially evident for the first five dominant canonical correlations. The detection threshold for each dual-sonar platform detector was determined experimentally based upon the training data set
using a similar procedure described before. Using this expanded training set (with respect to the second BB sonar), the appropriate thresholds for the local dual-sonar detectors were deterfor the HF–BB and for the mined to be BB –BB , respectively. Fig. 11(a) and (b) shows the histograms of the log-likelihood ratio values for a single target ROI and a single background ROI in the HF–BB and BB –BB cases, respectively. The detection thresholds are shown by dashed vertical lines in Fig. 11(a) and (b). The process of choosing the appropriate detection threshold is as described in Section IV-B. These detection thresholds were then used to perform detection on all the ROIs within the data set. That is, any pair of blocks within a ROI pair whose log-likelihood ratio falls above the corresponding threshold is flagged as a target block in either HF–BB or BB –BB detectors. of the two detectors are then sent as The local decisions the local decisions to the fusion center as shown in Fig. 9. The fusion rule also uses the observation of the fusion system
TUCKER AND AZIMI-SADJADI: COHERENCE-BASED UNDERWATER TARGET DETECTION FROM MULTIPLE DISPARATE SONAR PLATFORMS
from the three ROIs and the two local decisions from the local decision makers to yield the final decision . To generate the final decision , we need to estimate the conditional densities needed for the fusion rule in (29) and (32). As described in Section III-A, two different neural networks, namely a PNN and a BPNN, are used to accomplish this task. The training, validation, and testing subsets for these networks were randomly selected from the possible 212 target ROIs and 212 randomly select background ROIs (out of possibly thousands) described in Section IV-B. These subsets contain 1/3, 1/6, and 1/2 out of total of 212 ROI pairs, respectively, hence resulting in a training set (for the networks) consisting of 72 triple target and 72 triple background ROIs. Equal numbers of target and background samples are used to avoid biasing the density estimators. The validation and testing subsets were formed similarly yielding 40 triple target and 40 triple background ROIs for the validation set and 100 triple target and 100 triple background ROIs for the testing set. The decisions from the two CCA-based local decision makers are then computed for the training set and used to train a two-layer BPNN with two inputs, four hidden layer neurons, and two output neurons. For training of the BPNN, five random weight initializations were tried and the network that performed the best on the validation set was selected for testing. For the PNN that generates the likelihood ratio for the fusion center observation vector , again three subsets of the data were used for training, validation, and testing. The input to the PNN is a 9-D observation vector from the environment. This is a set of statistical attributes, namely mean, variance, and skew taken from the three ROIs over target and background. The same set of target and background samples as with the BPNN is used for training, validation, and testing of the PNN as well. Since the weights in the pattern layer are fixed for the PNN, ten different initializations of the variance of the Gaussian kernel were used for the training of the PNN. The network that performed the best on the validation set was then selected for testing. The resulting trained PNN is relatively small due to the binary hypothesis problem as the PNN consists of only two pools of neurons in the pattern layer each containing 72 neurons. To determine the threshold for the fusion rule in (29), a and “1-0” cost function is used, i.e., . Additionally, the prior probabilities are considered to . Therefore, the threshold for the be equal, i.e., fusion rule in (29) and (32) is . The system is then tested on the entire multiple-sonar imagery data described before. The individual coherence-based local decision makers performed marginally well. More specifically, the HF–BB detector detected 51 of the 53 targets with an average of 10.13 false detections per image, while the BB –BB detector performed a little worse with detection of 49 of the 53 targets and an average of 9.86 false detections per image. However, when the decisions of these two detectors are fused using the developed distributed detection system in Section III-A, the performance was greatly improved. After the fusion process, the system successfully detected all the 53 targets with an average of only 7.1 false detections per image. The ROC curves for the individual detectors and the fusion of the two are presented in in Fig. 12. To generate the ROC, the thresholds , , and
49
Fig. 12. ROC curves for the individual detectors and the fusion.
(30) and (31) were swept for the fusion center, HF–BB detector, and the BB –BB detector, respectively. As before, the decision score was chosen to be 50% and was fixed. At the knee 95% point of the ROC for the HF–BB detector, we have and 5%, while for the BB –BB detector, the knee point 92% and 8%. After the fusion of the two exhibits detectors at the fusion center, the knee point of the fused ROC 99% and 1%, which demonstrates excellent gives overall detection performance of the proposed distributed detection system. Closer investigation revealed that the targets that were missed by the local decision makers were at very close range and had faint signatures in all the three images. This is because these targets were close to the track of the AUV. Consequently, the signature was dark and hard to visually discern in all three sonar images hence leading to overall low coherence and subsequent missed detection. Nonetheless, after the fusion even the faint target signatures were detected and this can be attributed to the fusion center using its own observation of the environment. Overall, the distributed detection system performed extremely well given the small number of target and background samples used to form the detection thresholds. Moreover, this system showed vast improvement over the dual disparate detector in Section IV-B. V. CONCLUSION AND OBSERVATIONS In this paper, a new composite two-channel coherence-based detector was developed for dual disparate sensor systems. Due to the nature of the problem, the resulting detection hypotheses contained two data channels that both capture target or background. This is in contrast to the standard detection problems where both hypotheses contain one channel only. Thus, new formulations for the log-likelihood ratio and -divergence were derived to account for these major differences. A distributed detection system was also developed where several dual-sensor detectors are used to generate local decisions. The fusion center receives local decisions together with its own observation to generate a final decision. The incorporation of the observation
50
IEEE JOURNAL OF OCEANIC ENGINEERING, VOL. 36, NO. 1, JANUARY 2011
vector in the fusion rule helps to greatly increase the probability of detection and decrease the false alarm rate. By using multiple dual-sensor detectors, one is able to take advantage of more than two observations from the environment hence providing a higher confidence detection decision at the fusion center. For 95% for a the single dual-sensor detector, we achieved a 5% with an average ten false detections per image. Moreover, when we benchmarked our method against the standard Gauss–Gauss and Vera’s Hilbert detector, our method achieved for an extremely lower number of false alarms a much larger per image. When the developed distributed detection system was tested on the multiple-sonar data set provided by the NSWC PCD it was shown that this system significantly improved the probability of correct detection while reducing the incidence of false alarms when compared with the results of the single dual-sonar detectors. All targets were detected with an average of only seven false detections per image on the entire data set. For a of 5%, comparison with the results of the indicommon vidual dual-sonar detectors indicated a 13% and an 18% imover the individual HF–BB and BB –BB provement in the detectors, respectively, which is a substantial reduction in the number of false alarms over either of the individual detectors. Clearly, this indicates that the use of multiple-sonar types improves the detection performance by better capturing the target characteristics. Moreover, the distributed detection system for a network of sensor platforms can offer effective multiplatform detection by reducing the amount of information that needs to be transmitted to a remote fusion center while offering high probability of detection and low false alarm rate. The systems developed in this paper can be applied to any realistic distributed network-centric environment involving multiple small sensor platforms (e.g., AUVs and autonomous aerial vehicles) where bandwidth and processing time constraints must be considered. APPENDIX REVIEW OF CCA METHOD CCA was proposed by Hotelling [9] for the analysis of linear dependence between two data channels. CCA decomposes the linear dependence between the two channels into the linear dependence between the canonical coordinates of the channels, where this linear dependence is easily determined by the corresponding canonical correlations [8]. consisting of two Consider the composite data vector and , i.e., random vectors
If and are now replaced by their corresponding whitened vectors, then the composite vector is (38) where and written as
is a square root of with . The covariance matrix of
may be
(39) where
(40) is called the coherence matrix of and [8]. Therefore, the coherence matrix is the cross-covariance matrix between the whitened versions of and . Now, the SVD of the coherence matrix gives
and (41) where Ch. 2.5], i.e., , and
and
are orthogonal matrices [16, and
(42) is a diagonal singular value matrix, with and . We then use the orthogonal matrices and to transform the whitened composite vector into the canonical composite vector
(36) For the remainder of the derivations, it is assumed that , represents the Hermitian operation. and also the notation Assume that and have zero means and share the composite covariance matrix
(37)
(43) The covariance matrix for the canonical composite vector becomes
(44)
TUCKER AND AZIMI-SADJADI: COHERENCE-BASED UNDERWATER TARGET DETECTION FROM MULTIPLE DISPARATE SONAR PLATFORMS
51
REFERENCES
Fig. 13. Transformation from standard coordinates x and y to canonical coordinates u and v .
The elements of are referred to as the canonare ical coordinates of and the elements of the canonical coordinates of . The diagonal cross-correlation matrix
(45) is called the canonical correlation matrix of canonical corre. Thus, the lations , with canonical correlations measure the correlations between pairs of ; corresponding canonical coordinates. That is, , , with being the Kronecker delta. The canonical correlations are also the singular values of the coherence matrix . Using the orthogonality of and , the can be written as squared coherence matrix
(46) where is the squared canonical correlation matrix of the squared canonical correlations . That is, the squared canonical correlations are the eigenvalues of the squared coherence . matrix Fig. 13 illustrates the transformation from standard coordinates and to coherence coordinates and and then to canonical coordinates and . It can be noted that the transformation from standard coordinates and to canonical coordiand nates and can be represented by where and . In this case, and are known as the canonical mapping matrices. It can be shown [8] that the coherence measure between the two channels and is given by
(47) i.e., the coherence is represented in terms of the canonical correlations , which measure the dependence between the corresponding canonical coordinates. The channels and are per, and noncoherent iff . The th fectly coherent iff , term of the product on the right-hand side of (47), i.e., gives the contribution of the th canonical correlation to the total coherence measure . ACKNOWLEDGMENT The authors would like to thank J. T. Cobb and G. Dobeck at the Naval Surface Warfare Center Panama City Division (NSWC PCD) for providing technical support on this project.
[1] G. J. Dobeck, J. Hyland, and L. Smedley, “Automated detection/classification of sea mines in sonar imagery,” Proc. SPIE—Int. Soc. Opt. Eng., vol. 3079, pp. 90–110, Apr. 1997. [2] G. J. Dobeck, “Fusing sonar images for mine detection and classification,” Proc. SPIE—Int. Soc. Opt. Eng., vol. 3710, pp. 602–614, Apr. 1999. [3] T. Aridgides and M. F. Fernandez, “Automated target classification in high resolution dual frequency sonar imagery,” Proc. SPIE—Int. Soc. Opt. Eng., vol. 6553, Apr. 2007, DOI: 10.1117/12.717739. [4] T. Aridgides and M. Fernandez, “Enhanced ATR algorithm for high resolution multi-band sonar imagery,” Proc. SPIE—Int. Soc. Opt. Eng., vol. 6953, Mar. 2008, DOI: 10.1117/12.773304. [5] T. Aridgides, P. Libera, M. Fernandez, and G. J. Dobeck, “Adaptive filter/feature orthogonalization processing string for optimal LLRT mine classification in side-scan sonar imagery,” Proc. SPIE—Int. Soc. Opt. Eng., vol. 2765, pp. 110–121, Apr. 1996. [6] V. Chandran, S. Elgar, and A. Nguyen, “Detection of mines in acoustic images using higher order spectral features,” IEEE J. Ocean. Eng., vol. 27, no. 3, pp. 610–618, Jul. 2002. [7] J. D. R. Vera, E. Corias, J. Groen, and B. Evans, “Automatic target recognition in synthetic aperture sonar images based on geometrical feature extraction,” EURASIP J. Adv. Signal Process., vol. 2009, 2009, 109438. [8] L. Scharf and C. Mullis, “Canonical coordinates and the geometry of inference, rate, and capacity,” IEEE Trans. Signal Process., vol. 48, no. 3, pp. 824–891, Mar. 2000. [9] H. Hotelling, “Relations between two sets of variates,” Biometrika, vol. 28, pp. 321–377, 1936. [10] A. Pezeshki, L. L. Scharf, J. K. Thomas, and B. D. Van Veen, “Canonical coordinates are the right coordinates for low-rank Gauss-Gauss detection and estimation,” IEEE Trans. Signal Process., vol. 54, no. 12, pp. 4817–4820, Dec. 2006. [11] A. Pezeshki, M. R. Azimi-Sadjadi, and L. L. Scharf, “Undersea target classification using canonical correlation analysis,” IEEE J. Ocean. Eng., vol. 32, no. 4, pp. 948–955, Oct. 2007. [12] N. Wachowski and M. R. Azimi-Sadjadi, “Buried underwater target classification using frequency subband coherence analysis,” in Proc. MTS/IEEE OCEANS Conf., Sep. 2008, DOI: 10.1109/OCEANS.2008. 5151821. [13] J. D. Tucker, M. R. Azimi-Sadjadi, and G. J. Dobeck, “Canonical coordinates for detection and classification of underwater objects from sonar imagery,” in Proc. IEEE OCEANS Conf. Eur., Jun. 2007, DOI: 10.1109/OCEANSE.2007.4302270. [14] L. L. Scharf and B. D. Van Veen, “Low rank detectors for Gaussian random vectors,” IEEE Trans. Acoust. Speech Signal Process., vol. 35, no. 11, pp. 1579–1582, Nov. 1987. [15] M. R. Azimi-Sadjadi and J. D. Tucker, “Target detection from dual disparate sonar platforms using canonical correlations,” Proc. SPIE—Int. Soc. Opt. Eng., vol. 6953, Mar. 2008, DOI: 10.1117/12.776465. [16] G. H. Golub and C. F. Van Loan, Matrix Computations, Third ed. Baltimore, MD: The Johns Hopkins Univ. Press, 1996. [17] P. K. Varshney, Distributed Detection and Data Fusion. New York: Springer-Verlag, 1996. [18] J. Cartmill, N. Wachowski, and M. R. Azimi-Sadjadi, “Buried underwater object classification using a collaborative multi-aspect classifier,” IEEE J. Ocean. Eng., vol. 34, no. 1, pp. 32–44, Jan. 2009. [19] E. L. Lehman, Testing Statistical Hypotheses. New York: Wiley, 1986. [20] H. L. Van Trees, Detection, Estimation, and Modulation Theory Part I. New York: Wiley, 1968. [21] S. Haykin, Neural Networks, 2nd ed. Upper Saddle River, NJ: Prentice-Hall, 1999. [22] D. F. Specht, “Probabilistic neural network,” Neural Netw., vol. 3, pp. 109–118, 1990. [23] N. A. Rimski-Korsakov, Y. S. Russak, and R. B. Pavlov, “Simple digital system for side-scan sonar data imaging,” in Proc. MTS/IEEE OCEANS Conf., Sep. 1994, vol. 1, pp. 643–645. [24] W. H. Key, “Side scan sonar technology,” in Proc. MTS/IEEE OCEANS Conf., Sep. 2000, vol. 2, pp. 1029–1033. [25] S. C. Butler, “Triply resonant broadband transducers,” in Proc. MTS/ IEEE OCEANS Conf., Oct. 29–31, 2002, vol. 4, pp. 2334–2341. [26] S. C. Butler, “High frequency triply resonant broadband transducer array development at NUWC,” in Proc. MTS/IEEE OCEANS Conf., Sep. 22–26, 2003, vol. 5, pp. 2380–2385. [27] R. Bamler, “A comparison of range-Doppler and wavenumber domain SAR focusing algorithms,” IEEE Trans. Geosci. Remote Sens., vol. 30, no. 4, pp. 706–713, Jul. 1992.
52
IEEE JOURNAL OF OCEANIC ENGINEERING, VOL. 36, NO. 1, JANUARY 2011
[28] M. Soumekh, Synthetic Aperture Radar Signal Processing. : Wiley, 1999. [29] R. H. Stolt, “Migration by Fourier transform,” Geophysics, vol. 43, no. 1, pp. 23–48, 1978. [30] T. Fawcett, “ROC graphs: Notes and practical considerations for researchers,” HP Laboratories, Palo Alto, CA, Tech. Rep. No. HPL2003-4, 2004 [Online]. Available: http://www.hpl.hp.com/techreports/2003/HPL-2003-4.pdf
J. Derek Tucker (S’04) received the B.S. and M.S. degrees from Colorado State University, Fort Collins, in 2007 and 2009, respectively, both in electrical engineering, with an emphasis on statistical signal processing. Currently, he is working towards the Ph.D. degree in electrical engineering at Colorado State University. He is a Research Engineer in Automatic Target Recognition at the Naval Surface Warfare Center Panama City Division (NSWC PCD), Panama City, FL. His research interests include digital signal/image processing, target detection, classification, feature extraction methods, and statistical learning methods.
Mahmood R. Azimi-Sadjadi (S’81–M’81–SM’89) received the M.S. and Ph.D. degrees from the Imperial College of Science and Technology, University of London, London, U.K., in 1978 and 1982, respectively, both in electrical engineering with specialization in digital signal/image processing. Currently, he is a Full Professor at the Electrical and Computer Engineering Department, Colorado State University (CSU), Fort Collins. He is also the Director of the Digital Signal/Image Laboratory, CSU. His main areas of interest include digital signal and image processing, wireless sensor networks, target detection, classification and tracking, adaptive filtering, system identification, and neural networks. His research efforts in these areas resulted in over 300 journal and referenced conference publications. Prof. Azimi-Sadjadi served as an Associate Editor of the IEEE TRANSACTIONS ON SIGNAL PROCESSING and the IEEE TRANSACTIONS ON NEURAL NETWORKS.