14th European Signal Processing Conference (EUSIPCO 2006), Florence, Italy, September 4-8, 2006, copyright by EURASIP
COLOR IMAGE SEGMENTATION IN RGB USING VECTOR ANGLE AND ABSOLUTE DIFFERENCE MEASURES Sanmati S. Kamath and Joel R. Jackson Georgia Institute of Technology 85, 5th Street NW, Technology Square Research Building, Atlanta, GA 30308. phone: + (001) 404-247-0894, email: sanmati,
[email protected]
ABSTRACT This paper introduces a multi-pronged approach for segmentation of color images of man-made structures like cargo containers, buildings etc. A combination of vector angle computation of the RGB data and the absolute difference between the intensity pixels is used to segment the image. This method has the advantage of removing intensity based edges that occur where the saturation is high, while preserving them in areas of the image where saturation is very low and intensity is high. Thus, unlike previous implementations of vector angle methods and edge detection techniques, relevant objects are better segmented and unnecessary details left out. A novel method for connecting broken edges after segmentation using the Hough transform is also presented. 1. INTRODUCTION Image segmentation is a crucial first step for object recognition, image registration, compression etc. Edge detection techniques on grayscale images typically exploit intensity discontinuities and use difference measures on adjacent pixels. In color images, additional color information available can be utilized. The Hue, Saturation and Intensity (HSI) and the Hue, Saturation and Value (HSV) models closely resemble the human visual systems perception of color. Both these models employ the polar co-ordinate space. The Red, Green and Blue (RGB) model is based on physical interpretation of color. Various other models like the YCbCr (Y is the luminance and Cb and Cr are the chrominance values) and the CMY models are also popular. The HSI and HSV color spaces are of interest because the hue values are independent of intensity or luminance. This has the advantage of intensity variations due to illumination being ignored. However, this also has the disadvantage of being insensitive to differences between objects and their shadows when the shadow has the same color as the object. In both the HSI and the HSV color spaces, hue stands for the color which is represented by a circular wheel and varies between 0 − 360o . In the HSI space (also called the Hue, Saturation and Lightness - HSL space), a maximum value for I indicates the color white. The brightest color has an intensity value of exactly half the maximum [1]. In the HSV space, saturation and value are depicted as a triangle. The horizontal axis of the triangle gives the saturation (S) and the vertical axis gives the value (V). In this space, both saturation and value range from 0 − 100%. A maximum value for intensity indicates that the color is at its brightest and zero indicates the color black. Thus, a maximum value for intensity in the HSV color space indicates the brightest hue, while a maximum value
for intensity in the HSI space indicates the color white. This is one major difference between the two color spaces. The saturation values indicate the degree of purity of hue. This means that the higher the saturation, the more relevant the hue information and low saturation values indicate grayscales. When saturation is low, color information is low and intensity becomes more relevant [3]. 2. COLOR SEGMENTATION Utilization of the HSI domain for color segmentation has been fairly popular. Hue gives color information. One of the earliest works obtained hue differences and used them to develop an edge detector jointly using HSI values [3]. A sigmoid function was used on all pixels of the saturation image to decide on hue relevance as shown in Equation 1.
α (s) =
1 1 + e−slope(S−o f f set)
(1)
where slope controls the rate of decent and o f f set is the midpoint at the transition of the sigmoid function. Both the slope and offset were set empirically. Equation 2, is used to make a decision on whether to obtain hue differences. If two adjacent pixels s1 and s2 in the saturation image S, are both highly saturated, ρ (s1 , s2 ) is obtained used as a weighing term by being multiplied with the hue differences to obtain a hue gradient as given in Equation 3. This gradient is used with different combinations of the saturation and intensity gradients to obtain color gradient operators. p (2) ρ (s1 , s2 ) = α (s1 ) · α (s2 ) 4H(H1 , H2 ) = ρ (s1 , s2 ) · δ H(H1 , H2 )
(3)
where, δ H(H1 , H2 ) is the hue difference obtained by taking the difference between adjacent pixels H1 and H2 in the hue image H. Another work used the K-means clustering on hue and intensity for segmentation [4]. Here both the hue and intensity are clustered using Euclidean distance measures and a fuzzy membership function is used to further cluster and segment the image. 2.1 Vector Angle Computation on RGB Data Instead of using the Euclidean measure for edge detection, the vector angle between the RGB components was chosen in [5]. As the RGB to HSI conversion involves use of cosines, it is computationally expensive. Using the vector angle of the RGB data avoids this conversion. Moreover, the vector angle depicts the hue and saturation information well, though
14th European Signal Processing Conference (EUSIPCO 2006), Florence, Italy, September 4-8, 2006, copyright by EURASIP
it is insensitive to intensity changes [6]. The vector angle computation on the RGB data is as given in Equation 4.
sinθ =
q
s (1 − cos2 θ ) =
1−(
~vTrgb1 ·~vrgb2 k~vrgb1 kk~vrgb2 k
)2
(4)
Sine of the angle is used instead of the cosine due to the convention of strong edges (with angular values close to 90o ) being represented by 1 and non-edges (with smaller angles) by 0. Thus Equation 3 gets modified to Equation 5. 4H(H1 , H2 ) = ρ (s1 , s2 ) · sinθ
(a)
(b)
(c)
(d)
(5)
Using the vector angle results in intensity invariant segmentation where hue segmentation is better than that obtained by segmenting in the HSI domain. A method that uses both vector angle and Euclidean distance measures is described in [6]. Here, the vector angle is used for large values of ρ (s1 , s2 ) and the Euclidean measure is used for small values of ρ (s1 , s2 ). Wesolkowski and Jernigan utilized pixel saturation strengths to compute the vector angle distance measure when both pixels had high saturation, and Euclidean distance measure otherwise. This method is henceforth referred to as the VA-Euclidean method in this paper. The VAEuclidean method concluded that the vector angle approach is better suited for applications like robot vision. 3. PROPOSED METHOD: THE VECTOR ANGLE WITH ABSOLUTE DIFFERENCING (VA-D) In [6] it was concluded that the vector angle approach is best suited for applications like robot vision. The VAEuclidean method fails to segment properly images with low hue spread. For such images most of the edges are detected by the Euclidean difference measure instead of the vector angle. This results in noisy segmentation as seen in Figures 2c and 3c. Instead of taking the Euclidean distance for all pixel combinations that have low saturation, if a simple absolute difference is obtained only for pixels that have very low saturation a less noisy segmentation is achieved. This also has the advantage that image parts with good color content are given a higher priority during segmentation. For applications such as images from port surveillance, such a segmentation helps retain relevant information and segment out redundant data. This method uses a combination of both the vector angle and the absolute difference measures and is called the VAD method in this document. Here we adopt the vector angle approach, using Equations 4 and 5. The saturation information (from the HSV color space) is used for decisions regarding the hue. When saturation is weak, intensity is considered. This combination works well in capturing edges due to hue and high intensity variations. 3.1 Saturation and Value based Combination As hue is considered more important than intensity for container segmentation only highly saturated pixels are considered (α (s) > 0.5) initially. Thus vector angle is not computed for all pixels. The sigmoid function given in Equation 1 is applied to the saturation image in advance and for function values larger than a threshold, the vector angle is
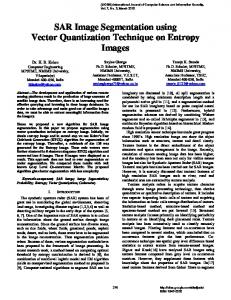
Figure 1: a)’Still1’ image b)Figure showing Canny edge detector result c)Figure showing the result of running the VAEuclidean method described in [6] d)Figure showing result from running the proposed VA-D method. Table 1: Decision (D) for test images Image
Hue Variance
Still1 Container2 Container3 Container4
0.0275 0.0097 0.0008 0.0181
Hue Standard Deviation 0.1657 0.0983 0.0291 0.1341
Percent Pixels Saturated 0.26 0.03 0.32 0.17
Decision Measure D 0.043 0.003 0.009 0.022
computed. The segmented (vector angle) result is converted to binary by applying a threshold for corner detection. Result from using this approach is shown in Section 4, Figure 1d. However, there are images with narrow hue spread and not too many saturated pixels. For pixels with low saturation, Euclidean distance measure has been used in the VAEuclidean method given in [6]. However, the Euclidean distance measure tends to be overly sensitive to noise. Hence, a modification to the vector angle method is proposed. A decision measure D is developed using the hue variance Hvar and the percent of pixels Ps that are highly saturated as shown in Equation 6. A pixel is considered to be highly saturated if it is greater than 0.5. D = Hvar · Ps
(6)
The decision values for a set of test images are shown in Table 1. The values in bold indicate the images for which the saturation is low and hue is not well spread. For such images, the sigmoid function is applied to the value image also to obtain α (v). These sigmoid functions for saturation and value are checked for all pixels. If saturation is low and value is very high, the Difference Vector Edge Detector1 is applied using absolute differences between α (v), else the pixel is set to zero. Thus, for all pixels, • IF D > T hreshold, – IF ρ (s1, s2) > κs apply the Vector Angle version of the Difference Vector Edge Detector. 1 See
Appendix A
14th European Signal Processing Conference (EUSIPCO 2006), Florence, Italy, September 4-8, 2006, copyright by EURASIP
• ELSE IF D < T hreshold, – IF ρ (s1, s2) > κs apply the Vector Angle version of the Difference Vector Edge Detector. – IF ρ (v1, v2) > κv apply the Difference Vector Edge Detector using absolute differences between α (v) for respective pixels. – Set all remaining pixels to zero. More formally, for the case of (D < T hreshold) the segmentation can be a function fVAD of the form fVAD (ρ (s), ρ (v)) where fVAD must fulfill the following conditions: 1. If ρ (s1, s2) > κs , then then Vector Angle should contribute to the function. 2. If ρ (v1, v2) > κv , then only the absolute distance between α (v1) and α (v2) should contribute towards the function. The following function (Equation 7) is modeled to achieve the above conditions. (ρ (s1,s2)−κs ) · ρ (s1, s2) · sin(θ ) e fVAD =
ifD > τ
e(ρ (s1,s2)−κs ) · ρ (s1, s2) · sin(θ ) ifD < τ +eε (ρ (v1,v2)−κv ) · |α (v1), α (v2)|
(7) Where τ is a threshold set to 0.3 empirically based on different test images (see Table 1). κs is set to 0.5 in order to include pixels with good saturation and κv is set to 0.8 to including pixels with good intensity. ε is empirically set to 4, to keep the contribution of the absolute difference measure to a minimum, when saturation is good. This method has the advantage of giving priority to pixels with good hues and including edges that might be present in areas of high luminance. Edges that do not meet any of these criteria are ignored. Some results based on this algorithm are given in Figures 2d and 3d in Section 4. 3.2 Connecting Broken Line Segments As the target scenario for the proposed video data analysis mainly pertains to man-made structures, straight line edges are given importance. The Hough transform using the straight line equation in normal form (as shown in Equation 8) is considered. x · cosθ + y · sinθ = r
(a)
(b)
(c)
(d)
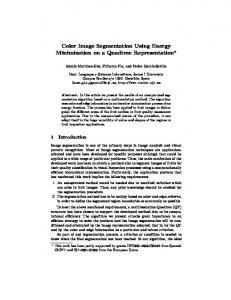
Figure 2: a)’Container4’ image [8] b)Figure showing Canny edge detector result c)Figure showing the result of running the VA-Euclidean method described in [6] d)Figure showing result from running the proposed VA-D method. The proposed algorithm is as follows: • Create a new empty image R. • Obtain the binary vector angle image (call it VA). • Apply the Canny detector on the saturation (S) image (Call it L). • If (VA(i, j) > 0) Obtain (r, θ ) using Hough transform. Call this data VAr,θ . • If (L(i, j) > 0, Obtain (r, θ ) using Hough transform. Call this data Lr,θ . • ∀ θ values in VAr,θ , if (θL == θVA ) AND (rL ≤ rVA + range) AND (rL > rVA − range) if set to 1 the respective pixels from L which have (rL , θL ) values in the final result R. In summary, all lines in the Canny result which are within a range and have the same slope θ as the vector angle result are considered. Using the vector angle image in combination with the Canny detected image helps in running the transform only for relevant pixels thus reducing computation and connecting only the broken line segments which have an association with an edge.
(8)
The perpendicular distance form the origin r is computed for angle θ values ranging from +90 to -90. All collinear pixels will have the same r and values or can be approximated to be within specific ranges of [r, θ ] [7]. 3.3 Proposed Method: Line Connecting algorithm using the VA-D and Canny Results (LC) Thresholding the vector angle image results in an image with some broken edges. This is inconvenient for processes like corner detection and object recognition. Hough transform is an effective way to obtain connected components. However, it is computationally expensive and may end up connecting pixels that are not actually part of an edge. A novel method is proposed which addresses these problems while effectively connecting broken edges. We call this the LC algorithm in this document.
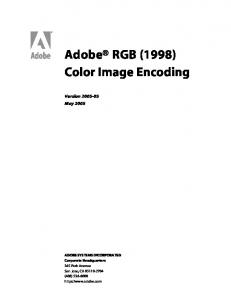
4. RESULTS The aim of the proposed segmentation is to keep colored information intact. In Figure 1b, 1c, and 1d, the results of Canny edge detection, the VA-Euclidean and the results of the proposed VA-D method are shown. In Figure 1a, the objects of interest are the three containers. The Canny detector detects almost all edges, but additional processing would be needed to segment out un-necessary details. The VAEuclidean method performs well in this case as the image has good contrast and highly saturated colors. For example, in Figure 3b, the antenna shows up in the Canny result, but is segmented out in the VA-D result shown in Figure 3. This image does not have good contrast and here we see that the VA-Euclidean method does not give good results. This is further demonstrated in Figure 2c and 3c where the results of the VA-Euclidean method are not very useful. The proposed VA-D method however, accomplishes two things
14th European Signal Processing Conference (EUSIPCO 2006), Florence, Italy, September 4-8, 2006, copyright by EURASIP
(a)
(b)
Figure 4: a)Broken segments after VA computation b) Segments reconnected after applying LC algorithm to connect lines
5. CONCLUSIONS
(a)
(b)
A method to segment color images is presented in this discussion. This method eliminates image data with low color information while preserving saturated color and high intensity information. For connecting broken segments, a technique is presented using Hough transform that reconnects lines without reintroducing unwanted edges. 6. APPENDIX A
(c)
(d)
Figure 3: a)’Container7’ image [9] b)Figure showing Canny edge detector result c)Figure showing the result of running the VA-Euclidean method described in [6] d)Figure showing result from running the proposed VA-D method.
in one - segmenting out background and edge detection on remaining objects. The results from the VA-D system in conjunction with the LC algorithm can be further used for container detection and recognition. Figure 5 shows the broken segments after the segmentation process and the connected lines using the LC algorithm. In Figure 4 the broken segments are reconnected while the edge due to variations in the intensities (seen in the Canny image on the bigger container) and the chairs in the background are left out.
(a)
(b)
Figure 5: a)Broken segments after VA computation b) Segments reconnected after applying LC algorithm to connect lines.
The Difference Vector Edge Detector (Equation 9), also used in the VA-Euclidean method, is adapted to the Vector Angle and the absolute difference measures. This edge detector obtains the maximum difference between pixels across the center pixel in the diagonal, the horizontal and the vertical directions. d = max(~p(i−1, j) −~p(i+1, j) ,~p(i, j−1) −~p(i, j+1) , ~p(i−1, j−1) −~p(i+1, j+1) ,~p(i−1, j+1) −~p(i+1, j−1) )
(9)
where, p(i, j) is the center pixel and p(i−1, j) , p(i+1, j) , p(i, j−1) , p(i, j+1) are the pixels in the horizontal and vertical directions and p(i−1, j−1) , p(i+1, j+1) , p(i−1, j+1) and p(i+1, j−1) are pixels across the diagonal from the center pixel. REFERENCES [1] “Advanced color imaging on the M AC OS,” in http://developer.apple.com/documentation/mac/ACI/ACI48.html, Apple Computers Inc., 1996. [2] “HSV color space,” in http://en.wikipedia.org/wiki/HSV color space, Wikimedia Foundation Inc., 2005. [3] P. Lambert. T. Carron, “Color edge detector using jointly hue, saturation and intensity,” IEEE International Conference on Image Processing, vol. 3, pp. 977–981, 1994. [4] P. Wang. Chi Zhang, “A new method of color image segmentation based on intensity and hue clustering,” 15th International Conference on Pattern Recognition, vol. 3, pp. 613–616, 2000. [5] S. Wesolkowski. R.D. Dony, “Edge detection on color images using RGB vector angle,” Engineering Solutions for the Next Millennium. IEEE Canadian Conference on Electrical and Computer Engineering, vol. 2, pp. 687– 692, 1999. [6] E. Jernigan. S. Wesolkowski, “Color edge detection in RGB using jointly euclidean distance and vector angle,” Vision Interface, pp. 9–16, 1999.
14th European Signal Processing Conference (EUSIPCO 2006), Florence, Italy, September 4-8, 2006, copyright by EURASIP
[7] R. Woods. R. Gonzales, “Digital image processing,” in Addison-Wesley Publishing Company, Reading, MA, 1993. [8] “Image titled Container4 downloaded from http://www.eurocentre.fr/index.php,” Eurocentre Inc. [9] “Image titled Container7 downloaded from http://www.arch.columbia.edu/studio/spring2003/up/accra /photo%20gallery/markets,%20vendors,%20and %20businesses/index.htm,”Graduate School of Architecture, Columbia University, New York, NY 10027.