Compositional modeling of C mineralization of organic materials added to soils Parent, Serge-Étienne. email:
[email protected] Karam, Antoine. email:
[email protected] Parent, Léon Etienne. email:
[email protected] Authors are from ERSAM, Department of Soils and Agrifood Engineering, Paul-Comtois building, Laval University, Quebec, Canada G1V 0A6. Abstract Linear or multiple techniques for the prediction of C mineralization in agricultural soils are important for sound management of organic materials added to soils. However, they are spoiled by spurious correlations in the compositional space since components (biochemical C fractions, N, ash) forms a simplex of strictly positive data bounded by 0 and 100%. At least one component is not independent because it can be computed by difference between 100% and the sum of others. In addition, values below zero or above 100% about confidence intervals are theoretically impossible although statistically computable. In order to remove spurious correlations and constrain confidence intervals within the simplex, compositional data analysis using sequentially arranged isometric log-ratios (ilr) can be used to portray the decomposition process. Our objective was to compare classical and compositional methods relating the biochemical composition of organic products to C mineralization by multiple regression analysis using a published dataset of 17 organic products. Correlation tables showed that raw proportions had sub-compositional incoherence due to spurious correlations while ilr values were coherent across compositions. The prediction of C mineralization was slightly improved using ilr ( 0.94) compared to raw proportions ( 0.88) but the regression was more easily interpretable. We concluded that the ilr coordinates should be used preferably to raw proportions to model the C dynamics of organic products in soils. Keywords : multiple linear regression model, compositional data, biochemical C pools Introduction Principal component analysis of compositional data is widely used as data reduction tool in soil fertility and plant mineral nutrition (Parent et., 1993; Parent et al., 2009). The compositional space of proportions is made of strictly positive data constrained between 0 and 100%. At least one component of the simplex is not independent from the others since it can be computed by difference between 100% and the sum of other components. The trivial case is a 2-compositional system where the correlation coefficient between components must be exactly -1. Classical multivariate models using raw proportions are thus distorted by spurious correlations (Aitchison, 1986). Compositional data analysis (CDA) using log-ratio transformations avoid these difficulties (Egozcue and Pawlowski-Glahn, 2006) and preserve sub-compositional coherence in the analysis (Greenacre, 2010). Isometric log-ratios (ilr) are coordinates with orthonormal basis that can be arranged in a way to describe the system under study (Egozcue et al., 2003). Our objective was to compare raw proportions and ilr transformations of biochemical composition of organic products in multiple regression models of C dynamics in soil using a published dataset (Thuriès et al., 2002). Methods Model parameters of C mineralization in a sandy soil as a function of biochemical composition of 17 organic materials (OM) were defined by Thuriès et al. (2002). The first order two-compartment model (m4) comprised labile and refractory C pools. The soluble
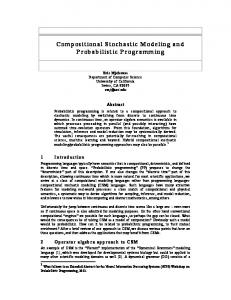
(SOL), hemicellulose (HEM), cellulose (CEL) and lignin plus cutin (LIC) organic inputs were determined using the van Soest NDF-ADF-ADL procedure (Van Veen et al., 1991). The ash content was obtained by loss on ignition. Total C and N were analyzed by combustion (CNSLeco2000). CDA was conducted using a compositional space that comprised biochemical fractions, total N content, and/or ash content (the independent variables in the compositional multiple regression). Isometric log ratio transformations were based on balanced contrasts between two groups of fractions. Balance coefficients for partitions refer to positive, negative, and null codes; s is the number of negative components in the contrast, r is the number of positive components, and (r+s) is the total number of components to be partitioned. Partitions were selected to represent the order of decomposability of biochemical components (Fig. 1). The ith ilr coordinate, , was computed as a contrast between two groups of components (Egozcue and Pawlowsky-Glahn, 2006) as follows : (1) and are the geometric means of components in group and . For where example, if fractions of added C in organic product are 0.31 for the labile C pool and 0.69 for the refractory C pool (where refractory C pool is the complement of labile C pool in a 2dimensionnal simplex), the ilr for labile C is computed as follows (D = 2; r = 1 and s = 1): 1 0.31 (2) ln 0.566 2 0.69 This ilr is negative since there is less labile C than refractory C in this organic product. x
C
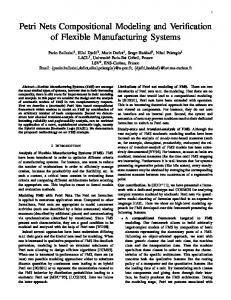
The labile C pool as fraction of added C in model m4 (dependent variable) was predicted from composition of organic products (independent variables) expressed either as proportions or ilr coordinates. Correlation and regression analyses were conducted using the R software environment. Spurious correlations were detected using two compositions, i.e. proportions expressed on total mass or organic products (full composition) or ash-free basis (sub-composition excluding ash content in the organic product). Results and Discussion Pearson correlation coefficients (data not shown) among raw proportions and between them and the labile C pool were not coherent in terms of number and sometimes also of significance or sign whether the proportions were expressed on the basis of total mass of the organic product (including ash) or organic matter alone (LOI) (data not shown). In other words, raw proportions depended on the scale of measurement (either total mass including ash or LOI alone) and generated sub-compositional incoherence due to spurious correlations. The ilr coordinates were coherent whichever sub-composition was examined (i.e. correlation coefficient was the same across sub-compositions) (Table 1). Thus, using ilr, the C labile pool did not depend on the scale of measurement (whether ash is considered or not) but only on the balance between biochemical components and their relationship with total N. Since stepwise regression selects variables from partial correlations, raw proportions that generate spurious correlations produced less robust linear statistical models compared to ilr coordinates. As shown by Fig. 2, variation in labile C was largely explained by total N, SOL, and ash ( 0.88) although SOL may contain refractory polyphenolic compounds such as humic substances and that HEM and CEL are labile C pools. On the other hand, the labile C pool was mostly ( 0.94) explained by the ratio between C sources and total N (ilr2), a surrogate of the C/N ratio, the ratio between labile and refractory C sources (ilr3), and the ratio between two labile C pools (ilr5), one being more labile (HEM) than the other (CEL), thus indicating that ash would not be a significant component in C dynamics. Accordingly, the wet and dry grape berry pellicles cakes, coffee cake, olive cakes, sheep manure, native fine feather, and composts were the most refractory organic products, and cocoa cakes,
hydrolyzed feather meal, guano, chicken manure, and organic fertilizers, the most labile. These findings indicate that the ilr coordinates provided an efficient log-ratio transformation to interpret C dynamics from composition of organic products since they are pre-defined on a theoretical basis, scale-invariant and free from spurious correlations. Conclusion Due to its pre-defined theoretical framework and its mathematical construction, compositional data analysis using isometric log ratio transformations should be conducted preferably to raw proportions to conduct linear multivariate analyses. Acknowledgements We thank the Natural Sciences and Engineering Research Council of Canada (RDCPJ 385199-09) for financial support. References Aitchison, J. (1986). The statistical analysis of compositional data. Chapman & Hall, London. Egozcue J. J, Pawlowsky-Glahn V., Mateu-Figueraz G., Barceló-Vidal C. (2003). Isometric logratio transformations for compositional data analysis. Mathematical Geology, 35 (3), 279300. Egozcue J.J., Pawlowsky-Glahn V. (2006). Simplicial geometry for compositional data. In: Compositional data analysis in the geosciences: from theory to practice, A. Buccianti, G. Mateu-Figueras and V. Pawlowsky-Glahn (eds), Geological Society, London, Spec. Publ. 264, pp. 145-159. Greenacre M. (2010). Log-ration analysis is a limiting case of correspondence analysis. Mathematical Geosciences, 42 (1), 129-134. Parent L. E., Karam A. and Visser S.A. (1993). The compositional nutrient diagnosis of the greenhouse tomato. Hortscience, 28 (10), 1041-1042. Parent L. E., Natale W. and Ziadi N. (2009). Compositional Nutrient Diagnosis of Corn using the Mahalanobis Distance as Nutrient Imbalance Index. Canadian Journal of Soil Science, 89 (4), 383-390. Thuriès L., Pansu M., Larré-Larrouy M.C. and Feller C. (2002). Biochemical composition and mineralization kinetics of organic inputs in a sandy soil. Soil Biology and Biochemistry 34 (2), 239-250. Van Veen J. A., Robertson J. B. and Lewis B. A. 1991. Methods for dietary fiber, neutral detergent fiber, and nonstarch polysaccharides in relation to animal nutrition. Journal of Dairy Science, 74 (10), 3583-3597. Table 1. Pearson correlation coefficient matrix between ilr coordinates and labile C pools (data from Thuriès et al., 2002). ilr1
ilr2
ilr3
ilr4
ilr5
ilr2
0.353
-
-
-
-
ilr3
-0.137
0.030
-
-
-
ilr4
0.595*
0.708**
0.029
-
-
ilr5
-0.040
0.341
0.614**
0.001
-
Labile C pool -0.284 -0.862**
-0.388
-0.764** -0.339
*,** Significant at the 0.05 and 0.01 levels, respectively; otherwise not significant.
Order of decomposition C
ilr 1 2 3 4 5
SOL
HEM
1 1 -1 -1 0
1 1 -1 1 -1
CEL
LIC
Balance coefficient 1 1 1 1 -1 1 1 0 1 0
N
Ash
1 -1 0 0 0
-1 0 0 0 0
Figure 1. Theoretical framework of the C dynamics of biochemical components in soils along ilr coordinates as follows: organic vs. mineral components, C pools vs. N content, and increasingly less labile vs. more labile C pools.
Figure 2. Predicted vs. observed values of labile C pool of 17 organic materials added to soil (data from Thuriès et al., 2002).