Crossed Clustering method on Symbolic Data tables Rosanna Verde1 and Yves Lechevallier2 1
2
Seconda Universit` a di Napoli - P.zza Umberto I, 81043 Capua - Italy Email:
[email protected] INRIA - Rocquencourt, Domaine de Voluceau - Rocquencourt - B. P. 105 78153 Le Chesnay Cedex - France, Email:
[email protected]
Abstract. In this paper we propose a crossed clustering algorithm in order to partition a set of symbolic objects in a predefined number of classes and to determine, in the same time, a structure (taxonomy) on the categories of the object descriptors. The procedure is an extension of the classical simultaneous clustering algorithms proposed on binary and contingency tables. Our approach is based on a dynamical clustering algorithm on symbolic objects. The criterion optimized is the chi-square distance computed between the description of the objects by modal variables (distributions) and the prototypes of the classes, represented by marginal profiles of the objects set partitions. The convergence of the algorithm is guaranteed at the best partitions of the symbolic objects in r classes and of the categories of the symbolic descriptors in c groups, respectively. An application on the web log data from INRIA web server allows to validate the proposed procedure and to suggest it as an useful tool in the Web Usage Mining framework.
Keywords: Dynamic Clustering, Symbolic Data Analysis, Web Mining.
1
Introduction
A generalization of the clustering dynamic algorithms (Diday, 1971, Celeux et al. 1989) has been proposed (Chavent, 1997; Chavent et al., 2003; De Carvalho et al., 2001; Verde et al. 2000) in the Symbolic Data Analysis (SDA) in order to partition a set E of symbolic objects (hereafter denoted SO’s) in a predefined number k of homogeneous classes. As in the classical clustering algorithm the criterion optimized is based on the best fitting between classes of objects and their representation. According to nature of the symbolic data, the first phase of the proposed algorithms consists in choosing a suitable representation of the classes of objects. In the context of SDA, we propose to represent the classes by prototypes which summarize the whole information of the SO’s belonging to each of them. Each prototype is even modelling as a SO described by multi-values variables: intervals, multi-categories, with associated distributions. Furthermore, related to the representation of the clusters, every element of E is assigned to a class according to its proximity to the prototype.
2
Verde and Lechevallier
In the context of SDA, several distances and dissimilarity functions have been proposed as assignment. In particular, whereas either the SO’s to cluster and the prototypes are described by interval variables, the most suitable distance, defined between intervals, is given by the Hausdroff distance (Chavent et al., 2003); while, if they are describe by modal variables, the dissimilarity measure can be chosen as a classical distance between distributions (e.g. chi-squared) or, as one of the context dependent measures (De Carvalho et al., 2001). Moreover, if the SO’s descriptors are of different nature (intervals, multi-categories, distributions) they can be retrieved in modal ones. The convergence of the algorithm to a stationary value of the criterion is guaranteed by the best fitting between the type representation of the classes and the properties of the allocation function. Different algorithms, even referred the same scheme, has been proposed according to the type of SO’s descriptors and to the choice of the allocation function. The generalized dynamic algorithm on symbolic objects has been proposed in different contexts of analysis, for example: to cluster archaeological data, described by multi-categorical variables; to look for typologies of waves, characterized by intervals values; to analyze similarities between the different shapes of micro-organism, described by both multi-categorical and intervals; to compare social-economics characteristics in different geographical areas with respect to the distributions of some variables (e.g.: economics activities; income distributions; worked hours; etc). The main advantage to use a symbolic cluster algorithm is to get a tool for comparing and clustering aggregated and structured data. In this perspective, we generalize a crossed clustering algorithm (Govaert, 1977, 1995) to symbolic data. Such algorithm performs iteratively a cluster on the rows and on the variables of a symbolic data table.
2
General scheme of dynamical clustering algorithm
Let E a set of symbolic objects s described by p symbolic variables yj (j = 1, . . . , p)and a weight µs > 0. According to the standard dynamic clustering algorithm (Celeux et al.,1989) we look for the partition P ∈ Pk of E in k classes, among all the possible partitions Pk , and the vector L ∈ Lk of k prototypes (g1 , . . . , gi , . . . , gk ) representing the classes in P , such that, a criterion ∆ of fitting between L and P is minimized: ∆(P ∗ , L∗ ) = M in{∆(P, L) | P ∈ Pk , L ∈ Lk } This criterion is defined as the weighted sum of the dissimilarities δ(xs , gi ) between the descriptions of the SO’s of E collected in a vector xs and the prototype gi representing the cluster Ci , for all the clusters Ci (i = 1, ..., k) and for all the objects s of Ci : ∆(P, L) =
k X X i=1 s∈Ci
µs .δ 2 (xs , gi ) Ci ∈ P, gi ∈ Λ
Crossed Clustering method on Symbolic Data tables
3
The dynamic algorithm is performed by the following steps: a) Initialization; a partition P = (C1 , . . . , Ck ) of E is randomly chosen. b) representation step: P for j=1 to k, find gh associated to Ch such that xs ∈Ch µs .δ 2 (xs , gh ) is minimized c) allocation step: test ←− 0 for all xs do find m such that Cm is the class of s of E find l such that: l = arg minh=1,...,k δ(xs , gh ) if l 6= m test ←− 1; Cl ←− Cl ∪ {xs } and Cm ←− Cm − {xs } d) if test = 0 then stop, else go to b) Then, the first choice concerns with the representation structure by prototypes (g1 , . . . , gk ) for the classes {C1 , . . . , Ck } ∈ P . The criterion ∆(P, L) is an additive function of the k clusters and of the N SO’s of E. Therefore, the criterion ∆ decreases under the following conditions: • uniqueness of the affectation cluster for each element of E; • uniqueness of the prototype gh which minimizes the criterion ∆ for all the cluster Ch for (h = 1, . . . , k) of the partition P of E.
3
Crossed dynamical clustering algorithm
In order to find a structure in the symbolic data, we perform a crossed dynamical clustering algorithm. The data are described in a symbolic data table X=[X 1 , . . . , X v , . . . , X p ] . Along the rows of X we find the descriptions of the symbolic objects xs (s = 1, ..., N ) of E, the columns of X v contain the distributions of the symbolic variables yv (v = 1, ...,Sp). The set of categories p of the symbolic variable yv is denoted Vv and V = v=1 Vv . The general scheme of the dynamical algorithm, described above, is followed in order to cluster the rows of the symbolic data table X in a set of homogeneous classes, representing typology of SO’s or groups of categories. According to our aim to obtain rows partition, a classification of the symbolic descriptors is accomplished. Some authors (Govaert, 1977, Govaert and Nadif, 2003) proposed the maximization of the χ2 criterion between rows and columns of a contingency table. In our context we extent the crossed clustering algorithm to look for the partition P of the set E in r classes of objects and the partitions Q in c column-groups of V , according to the Φ2 criterion on symbolic modal variables. It worth to notice that the criterion optimized in such algorithm is additive:
4
Verde and Lechevallier
∆(P, (Q1 , . . . , Qp )) =
p X
Φ2 (P, Qv |Q)
v=1 v
where Q is S the partition S associated to S the modal variable yv and Q = p p p (Q1 , . . . , Qc ) = ( v=1 Qv1 , . . . , v=1 Qvk , . . . , v=1 Qvc , ). The cells of the crossed tables can be modelling by marginal distributions (or profiles) summarizing the classes descriptions of the rows and columns. The criterion ∆(P, Q, G) optimized in the crossed algorithm is consistent with the clustering one and iteratively optimizes the two partitions P and Q and the related representation G. x1v1 · · · x1vj · · · x1vm .. .. .. .. .. . . . . . g11 · · · g1c p (X1 , . . . , Xv = xsv1 · · · xsvj · · · xsvm . . . , X ) ⇒ G = · · · gik · · · . . . . . gr1 · · · grc .. .. .. .. .. xN v1 · · · xN vj · · · xN vm The value gik of the matrix G represents the aggregation of the set of rows belonging to the class Pi with the set of columns belonging to the class Qk is computed by the following formula:
gik =
p X X X
xsj =
v=1 s∈Pi j∈Qv k
X X
xsj
(1)
s∈Pi j∈Qk
We denote the marginal profiles of the G matrix as follows: g.k =
r X
r X X X
gik =
i=1
xsj =
N X X
xsj =
j∈Qk s=1
i=1 s∈Pi j∈Qk
X
x.j
j∈Qk
The φ2 distance between a row vector of X and the row vector gi = (gi1 , . . . , gic ) of G is computed with respect to the aggregated x ˜s ’s rows x ˜vs = (˜ xvs1 , . . . , x ˜vsc ) belonging to the partition Qv , for each variable yv , where: φ2 (˜ xvs , gi ) =
µ v ¶2 c X gik 1 x ˜sk − g.k x ˜vs. gi.
with
(2)
k=1
gi. =
c X
x ˜vsk =
gik
X
xsj
x ˜vs. =
j∈Qv k
k=1
2
d (˜ xs , gi ) =
p X v=1
c X X
xsj
j=1 j∈Qv k
φ2 (˜ xvs , gi )
(3)
Crossed Clustering method on Symbolic Data tables
5
The φ2 distance between a column vector of X and the column vector g = (g1k , . . . , grk ) of G is computed with respect to the aggregated x ˜j ’s j 1j rj column x ˜ = (˜ x ,...,x ˜ ) belonging to the partition P , where: µ ij ¶2 r X 1 x ˜ gik 2 j k φ (˜ x ,g ) = − with (4) g x ˜.j g.k i=1 i. k
g.k =
r X i=1
gik =
N X X s=1 j∈Qk
xsj
x ˜ij =
X
xsj
x ˜.j =
s∈Pi
r X X
xsj = x.j
i=1 s∈Pi
The Crossed Dynamic Algorithm is performed by the following steps: a) Initialization; a partition P = (P1 , . . . , Pr ) of E and p partitions (Qv = (Qv1 , . . . , Qvc ), v = 1, . . . , p) are randomly chosen. b) Block model representation step: The prototype table G is computed by the formula (1). c) Row allocation step: test row ←− 0; for all objects s of E do Such that Pi is the class of s, find i∗ which verifies : i∗ = arg mini=1,...,r d(˜ xs , gi ) where d is defined by (3) if i∗ 6= i test row ←− 1; Pi∗ ←− Pi∗ ∪ {s} and Pi ←− Pi − {s} d) Block model representation step: The prototype table G is computed by the formula (1). e) Column allocation step: test column ←− 0 for all variables yv do for all categories j of V v do Such that Qvk is the class of j, find j ∗ which verifies : j ∗ = arg mink=1,...,c φ(˜ xj , g k ) where φ is defined by (4) ∗ if j 6= j test column ←− 1; Qkv ∗ ←− Qvk∗ ∪ {j} and Qvj ←− Qvk − {j} f) if test row = 0 and test column = 0 then stop, else go to b) Using the theorem of the decomposition of the inertia we have the following relations : Φ2 (E, Q) = ∆(P, Q, G) + Φ2 (P, Q) Φ2 (P, V ) = ∆(P, Q, G) + Φ2 (P, Q)
(5) (6)
For the row allocation step b) the partition Q P and the block P prototype r 2 model are fixed also the criterion ∆(P, Q, G) = xs , gi ) i=1 s∈Pi xs. .d (˜ decreases during this step. By the relation (5) the criterion φ2 (P, Q) increases. For the column allocation step e) the partition P P and P the prototype block c model are fixed also the criterion ∆(P, Q, G) = x.j φ2 (˜ xj , g k ) k=1 j∈Qv k decreases during this step. By the relation (6)the criterion Φ2 (P, Q) increases. Globally the criterion φ2 (P, Q) increases in each step of this process.
6
4
Verde and Lechevallier
Application
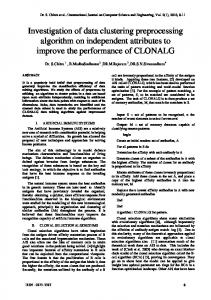
A direct extension of the dynamical algorithms is hereafter proposed in the context of the Web Usage Mining (Sauberlich and Huber, 2001). In particular, the application has performed on the Web Logs Data, coming from the HTTP log files by the INRIA web server (Lechevallier et al., 2003). This study aims to detect the behavior of the users and, in the same time, to check the efficacy of the structure of the site. Behind the research of typologies of users, we have defined a hierarchical structure (taxonomy) over the pages at different levels of the directories. The analyzed data set has concerned the set of page views by visitors that were connected to the INRIA site from the 1st to the 15th of January, 2003. Globally, the database contained 673.389 clicks (like page views in an user session), which have been already filtered from robot/spider entries and accesses of graphic files. A very important aspect in the analyzing of logfiles is the navigation which is a set of clicks belonging to the same user. A further cleaning of the logfile has been performed in order to keep the navigations on both URL: www.inria.fr and www-sop.inria.fr. Moreover, only long navigations (duration ≥ 60s, the ratio duration/number of clicks ≥ 4sec. and number of visited pages ≥ 10) has been taken into account for the analysis. Therefore, the number of selected navigations was 2639, corresponding to 145643 clicks. For sake of brevity, in this context, we have restrained our analysis just to two web sites at the highest level. The visited pages were collected in semantic topics according to the structure of the two web sites. In particular the clicks on the web site www.inria.fr were referred to 44 topics; while the clicks on the web site www-sop.inria.fr, to 69 topics. Thus, we have consider the 2639 as symbolic objects described by two symbolic multi-categorical variables: www.inria.fr and www-sop.inria.fr having 44 and 69 categories respectively. The data are collected in a symbolic tables where each row contains the descriptions of a symbolic object (navigation), that is the distribution of the visited topics on the two websites. Following our aim to study the behavior of the INRIA web users, we have performed symbolic clustering analysis to identify an homogeneous typology of users according to the sequence of the visited web pages, or better, according to the occurrences of the visited pages of the several semantic topics. The results of the navigation set partition in 12 classes and of the topics one in 8 classes, constituted by the two partitions Q1 and Q2 , are shown in the Table 1. For the example, the Topic 5 associated to the group Q5 is composed by two subgroups, one for each website, Q51 ={travailler, formation, valorisation} for the website www and Q51 ={formation, recherche} for the website sop. It is worth to notice as the 8 topics groups correspond to different typology of information. In particular, the 8 groups can be identify as follows: T-group 1 → INTRANET; T-group 2 → Scientific information: Conferences, project activities; T-group 3 → Dissemination; T-group 4 → dias; T-group 5 →
Crossed Clustering method on Symbolic Data tables Topic 1
Topic 2
Topic 3
/www/partenaires /www/agos-sophia /www/modeles /sop/partenaires /sop/agos-sophia /sop/color /sop/interne-sophia /sop/wiki /sop/modeles /sop/sapr /sop/didacticiel /sop/ctime /sop/freesoft
/www/projets /www/rrrt /www/w3c /www/manifestations /sop/projets /sop/sophia /sop/site-eng /sop/externe /sop/colloquium /sop/horde /sop/manifestations /sop/international
/www/presse /www/dias /www/actualites-siege /sop/dias /www/multimedia /www/icons /www/fonctions /sop/chir /sop/direction
Topic 5
Topic 6
/www/travailler /www/formation /www/valorisation /sop/formation /sop/recherche
/www/rapports /www/semir /sop/rapports /sop/semir /sop/rmi
7
Topic 4
Topic 7
Topic 8
/www/recherche /www/accueil-siege /www/personnel /www/intro-inria /www/publications /www/cgi-bin /www/ra /www/interne-siege /www/international /www/site-beta /www/sophia-antipolis /www/thesauria
/www/sophia /www/site-old /sop/cgi-bin /sop/commun /sop/accueil-sophia /sop/intro-sophia /sop/actualites-sophia /sop/rev /sop/intech /sop/services /sop/challengeTV /sop/xml
Table 1. topic descriptions groups
Training; T-group 6 → Research activity; T-group 7 → Headquarter (www.inria.fr); T-group 8 → Headquarter - Sophia research activity.
From the classification Table 2 we can remark as: the topics-group 2 represents the set of the most visited topics by the users; mainly the users of the class 8 visited this group attentively; the topics-group 1 represents the set of topics specially visited by the users of the class 3; the topic group 1 contains the internal internet users of INRIA. Then, analyzing the classes of navigations: the class 3 contains the navigations with an high number of pages visited; the users of this class visited different topic groups (1,2,6 and 7); the class 4 contains the navigations which visited only the topics group 5. This topics group represents the general topics of INRIA (training, researchers, scientific manifestations, etc.)
Navigation 1 Navigation 2 Navigation 3 Navigation 4 Navigation 5 Navigation 6 Navigation 7 Navigation 8 Navigation 9 Navigation 10 Navigation 11 Navigation 12 Total pages
Topic 1 Topic 2 Topic 3 Topic 4 Topic 5 Topic 6 Topic 7 Topic 8 222 1470 587 34 611 80 18757 143 78 2381 254 7 3094 80 2055 249 8578 7767 425 309 448 2749 2091 1386 29 280 115 7 3387 7 347 91 209 242 9 26 23 2544 221 55 29 1185 3204 28 1247 19 2670 82 43 140 22 795 39 47 218 636 288 35742 920 90 594 308 2174 1101 186 1040 136 106 283 72 370 3739 24 39 6 2786 2 25 49 210 175 7630 606 87 574 326 10227 257 4 231 3088 4 96 8 179 10 9865 58147 9372 4279 10398 6265 39358 7959
pages 21904 8198 23753 4263 3329 8464 1940 41217 5932 3141 19882 3620 145643
Table 2. Contingence table of the navigations and topic groups
8
Verde and Lechevallier
The achieved results by the proposed algorithm must be considered just as a bref example of an automatic clustering procedure to structure complex data to perform simultaneously typologies of navigation and groups of topics, homogenous from a semantic point of view. An extension of our approach to more web sites, or in general to more symbolic variables, allows to take in account a hierarchical structure of the complex data descriptors. According to our example, if we had to take into account rubriques at lower level of the web architecture, in the grouping of the topics, their belonging to a higher level rubriques of the web site must be considered in the clustering process. In conclusion, the most relevant difference of the crossed clustering algorithm on complex data with respect to the one on classical data, is surely in its extension to multi-valued categorical variables with a hierarchical structure associated.
References CELEUX, G., DIDAY, E., GOVAERT, G., LECHEVALLIER, Y., RALAMBONDRAINY, H. (1989): Classification Automatique des Donn´ees, Environnement statistique et informatique. Bordas, Paris. CHAVENT, M., DE CARVALHO, F.A.T., LECHEVALLIER, Y., VERDE, R. (2003): Trois nouvelles m´ethodes de classification automatique de donn´ees symboliques de type intervalle. Revue de Statistique Appliqu´ees, n. 4. DE CARVALHO, F.A.T, VERDE, R., LECHEVALLIER, Y. (2001): Deux nouvelles m´ethodes de classification automatique d’ensembles d’objets symboliques d´ecrits par des variables intervalles. SFC’2001, Guadeloupe. DIDAY, E. (1971): La m´ethode des Nu´ees dynamiques Revue de Statistique Appliqu´ee, 19, 2, 19–34. GOVAERT, G. (1977): Algorithme de classification d’un tableau de contingence. In Proc. of first international symposium on Data Analysis and Informatics, INRIA, Versailles, 487–500. GOVAERT, G. (1995): Simultaneous clustering of rows and columns. Control Cybernet., 24, 437–458 GOVAERT, G., NADIF M. (2003): Clustering with block mixture models. Pattern Recognition, Elservier Science Publishers, 36, 463-473 LECHEVALLIER, Y., TROUSSE, B., VERDE, R., TANASA, D. (2003): Classification automatique: Applications au Web-Mining. In: Proceeding of SFC2003, Neuchatel, 10–12 September. SAUBERLICH, F., HUBER K.-P. (2001) : A Framework for Web Usage Mining on Anonymous Logfile Data. In : Schwaiger M. and Opitz O.(Eds.): Exploratory Data Analysis in Empirical Research, Springer-Verlag, Heidelberg, 309–318. VERDE, R., DE CARVALHO, F.A.T., LECHEVALLIER, Y. (2000) : A Dynamical Clustering Algorithm for Multi-Nominal Data. In : H.A.L. Kiers, J.-P. Rasson, P.J.F. Groenen and M. Schader (Eds.): Data Analysis, Classification, and Related Methods, Springer-Verlag, Heidelberg, 387–394.