Data-Driven Framework for Detecting Anomalies in Field Failure Data Satnam Singh Senior Researcher - Diagnosis & Prognosis Group India Science Lab, General Motors Global Research and Development GM Technical Centre India Pvt Ltd, Creator Building, International Tech Park Ltd. Whitefield Road, Bangalore - 560 066, INDIA Ph: 91-08041184076,
[email protected] Clifton Pinion CI Engineering Quality EGM - Electrical GM, Warren Technical Centre Campus, 30001 Van Dyke, Bldgs 2-10 PO Box 9020, Warren-48090, MI, USA Halasya Siva Subramania Former- Senior Researcher - Diagnosis & Prognosis Group India Science Lab, General Motors Global Research and Development GM Technical Centre India Pvt Ltd, Creator Building, International Tech Park Ltd. Whitefield Road, Bangalore - 560 066, INDIA Abstract— This paper discusses the design of a data-driven framework for detecting anomalies in the automotive field failure and repair data. The anomaly detection framework detects anomalies at two levels: 1) It detects anomalies in repair data using system-level fault model (or fault dependency-matrix) and diagnostic reasoner; 2) It detects anomalies in diagnostic trouble code (DTC) data using operating sensory parameter identifiers (PIDs) data mining. The system-level fault model provides a way to capture causal relationships between failures and symptoms of a given system. A repair is declared as anomalous if it does not match the repair recommended by the fault model and diagnostic reasoner. The PIDs data mining detects anomalies in DTC data by detecting patterns in the associated PIDs using various statistical techniques such as scatter plots, clustering and decision trees. The DTC anomalies could be either due to errors in the preconditions under which the DTCs are designed to set or errors while implementing them in the software. The PIDs data mining module provides a focused feedback to engineers for detecting the errors in DTC software algorithms and enhancing the diagnostic design of DTCs during the early stages of vehicle production. We demonstrate the datadriven framework on automobile fuel vapor pressure sensor problem 1 2.
Detecting Anomalies in Claims Data ......................... 4 Level-2: Detecting Anomalies in DTCs using PIDs Data mining ..............................................................6 Freeze Frame Data (or PIDs data) ............................ 6 4. CASE STUDY: EVAPORATIVE EMISSION CONTROL SYSTEM .....................................................................9 Level-1: Anomaly Detection in Claims Data using Fault Model ............................................................10 Level 2: Anomaly Detection in DTC Data using PIDs Data Mining ............................................................11 Root Cause of VP Sensor Failures ...........................12 5. SUMMARY........................................................12 ACKNOWLEDGEMENTS .............................................13 REFERENCES ...........................................................13
1. INTRODUCTION Technological advances in electronics, wireless communications, and telematics are providing capabilities to collect data from nearly every part of an automobile. The collected data provides an excellent opportunity to monitor the vehicle health and perform data-driven fault diagnosis and prognosis of the vehicle. Currently, vehicle diagnosis is a fairly manual process and OEMs have limited fault diagnosis support tools for both on-board and off-board diagnostics. Aside from simple tool such as volt/ohm meter, dealer service technicians rely primarily on the scan tools to read the diagnostic trouble codes (DTCs) which are set and then they use published service procedures categorized by DTCs, technical bulletins and previous experience to figure out the root cause. If there are multiple interacting faults or multiple DTCs, technicians often have difficulty in finding the root cause of the problem which leads to excessive time in solving the problem, repeat visits, and increased customer dissatisfaction.
TABLE OF CONTENTS 1. 2. 3.
1 2
INTRODUCTION.................................................. 1 LITERATURE SURVEY ........................................ 3 ANOMALY DETECTION FRAMEWORK ................. 4 Fault Model ................................................................ 5 Fault Model Development.......................................... 6 Diagnostic Inference .................................................. 6
978-1-4244-7351-9/11/$26.00 ©2011 IEEE. IEEEAC paper #1221, Version 2, Updated January 3, 2011
1
Data: DTCs, PIDs, Claims, etc.
OEM’s Database
1. Data collection via telematics services
Automobile field failure data
1. Data collection via diagnostic tools at dealer shops
Figure 1: Field Failure Data Collection System for Automobiles Automotive field failure data typically includes customer complaints, diagnostic data (such as diagnostic trouble codes (DTCs), and freeze frame sensory parameter data) and repair action claims as reported by the respective automotive dealerships. The DTCs are fault codes that are recorded in the electronic control units (ECUs) when faults occur in a specific sensor, electrical circuit, and ECU. Depending on the DTC type, it may set the check engine light on or it may just get recorded in the ECU. For DTCs related to automobile engine, a snapshot of the operating parameters (freeze frame data) is also recorded when the DTCs are set in the vehicle. Automotive dealerships, report this field failure data (DTCs and freeze frame data) to the automotive original equipment manufacturers (OEMs) through a service reporting system. The automotive OEMs employ the field failure data to monitor the warranty and improve the quality, reliability, and durability (QRD) of the automobiles.
Typically, if a vehicle has a problem, the customer either contacts the service advisor via the telematics services or visits the authorized service repair center. When a vehicle is brought to a service repair center, such as a service department at a dealership, the technician communicates with the customer to address the customer complaint. If it is a common mechanical failure, routine tune-up or body damage then technicians can handle it using their experience. However, if an electrical component has failed then the technician has to run a diagnostic check on the vehicle. For example, when the check engine light is on, technicians have to run a diagnostic check on the vehicle by communicating with one or more processors in the vehicle (e.g. engine control module). Each of the electronic control units (ECUs) in the vehicle includes a memory unit or utilizes remote memory units that store DTCs when the vehicle experiences a problem and a malfunction is detected. Storing the DTCs in the ECU memory enables the service technician to troubleshoot the problem without trying to recreate the problem in the vehicle, particularly if the vehicle is not currently symptomatic of the problem. Rather, the service technician can review the history of DTCs and operating sensory parameters that have been stored in the memory of the vehicle to determine what issues were present in the vehicle when the problem occurred. The DTCs are alphanumeric codes that are used to identify a problem that occurs with various subsystems within the vehicle. Such DTCs may be related to various vehicle malfunctions that include, but are not limited to, engine operation, emissions, braking, powertrain, and steering. Each subsystem may have its own ECU for
The field failure data also contains details of the repair actions (or claims) which are represented by unique repair codes or labor codes that indicate the components that are being replaced/repaired, the troubles identified within the components, and the cost of the repairs. For each repair action performed, a repair code is entered along with customer complaints and diagnostic data into the service reporting system. With the advent of modern data wireless networks and communication technologies, automotive OEMs can now obtain field failure data in several ways. Figure 1 shows a typical field failure data collection system.
2
community, Schimert has proposed dimension reduction techniques to detect anomalies in multivariate time series sensory data of the Boeing aircrafts [2]. Schimert employed data-driven techniques principal component analysis (PCA) and independent component analysis (ICA) to summarize the multivariate data into components that explain the variance in the normal operating data. Using these components, he detected the faults by projecting the new observation onto the components learned using normal operating data. An alert occurs if the Mahalanobis distance between the new observation and PCA or ICA model is beyond the 95% or 99% confidence bounds. Next, he employed a contribution plot to analyze the changes in the contributions of parameters before and after the alert. The anomaly detection problem has been also studied to detect anomalies sensory data of spacecrafts. In [3], Yairi et al. employed locally stationary autoregressive model and spectral ordering method to detect the change points in time series telemetry data. The results were demonstrated using several visualization techniques.
monitoring faults of the subsystem operation or an ECU may be responsible for monitoring faults of several subsystems. The DTCs assist the service technician in pinpointing the area of concern. To retrieve a DTC, the service technician uses a scan tool to retrieve DTCs stored in an ECU, for a current or past driving cycle. Typically, a DTC when triggered indicates a fault in an ambiguity group of 3 serviceable parts: 1) component 2) wire or connectors connecting component to the electronic control unit (ECU) 3) ECU itself. This is due to the fact that DTCs are recorded in the ECUs and they just indicate a circuit failure, which could be anywhere within the component, ECU or wire harness. Using the service documents, technicians need to perform appropriate manual circuit tests to isolate the fault to a single serviceable part. In addition to the DTCs, due to governmental regulations and for root cause analysis, the ECUs are also programmed to record a snapshot of relevant operating sensory parameter identifiers (PIDs) concurrent with triggering of the DTCs. This snapshot is called a failure record or a freeze frame. The vehicle speed, engine speed, engine torque, control module voltage, ignition voltage, ambient temperature, etc. are several such PIDs which get recorded when a DTC is triggered. Generally, the freeze frame data enables the technicians to set up a road test to replicate the operating conditions during which the DTC was triggered. This is a fairly limited usage of the data. This data is very useful for OEMs to do an offline reconstruction of critical DTC related failures that can provide them with clues for improving the design of DTCs. These clues can be in the form of wrong calibration of these operating parameters at the design stage, a bug in the DTC diagnostic algorithm that causes anomalous triggers of DTCs or some external factors causing malfunctioning of the sensors.
The anomaly detection is also a leading concern for electronics manufacturers. Michael et al. [4] have applied Mahalanobis distance (MD) based approach to detect anomalies in electronic products. The authors learned baseline MD distribution of healthy products by normalizing the data and computing MD values. Then, the test data was normalized with the mean and standard deviation (SD) of the baseline. The MD values of the test data was computed using the correlation matrix from the baseline data. To detect the anomalies, the MD values of the test data was compared with the baseline MD values. If the test data has MD values outside 3SD then it indicated the anomalous behavior. The authors demonstrated the approach on electronic products data obtained using experiments.
In this research, we make following contributions: • We developed a hierarchical framework to automatically detect anomalies in automotive field failure data. The framework has two levels: (1) it detects anomalies in the repair data using system-level fault model and (2) it detects anomalies in DTCs using statistical plots and decision trees. • A novel combination of fault model and decision tree is proposed to detect anomalies in field failure data of test fleet and production vehicles.
There have been recent efforts on monitoring health of fleet vehicles. In [5] Saxena et al. have proposed a dynamic case-based reasoning framework to maintain health of critical systems. They developed a natural language processing technique to extract information from the textual descriptions and demonstrated the technique on an automobile dataset. The data-driven fault detection and diagnosis has been also proposed for automobiles. Namburu et al. [6] proposed a systematic data-driven framework to detect and diagnose faults in automotive engines. They applied the data-driven framework to an experimental system consisting of a Toyota Camry engine running with manual transmission on a dynamometer test stand. The automotive field failure data has been also analyzed in our previous work [7] where we employed dimension reduction and clustering techniques to detect anomalies in DTCs. In this paper, we focus on detecting anomalies in repair and failure data of automobiles. Our objective is to detect anomalies and report to quality and service engineers so that they can take appropriate measures.
2. LITERATURE SURVEY The anomaly detection problem has been widely studied in the aerospace and electronic products fault diagnosis community. Yu et al. have discussed a statistical and fuzzy logic based approach to detect anomalies in GE commercial aircraft engines [1]. The authors analyzed time series performance parameters to identify the most prominent problem shift to select the dataset before and after the shift. The parameter shifts were evaluated against a pre-defined set of fuzzy membership functions that capture the expected parameter shift for a specific failure. In aerospace 3
Figure 2: Anomaly Detection Framework DTC anomalies). There could be several ways of interactions between Level-1 (fault model) and Level-2 (PIDs data mining) anomaly detection modules. Sometimes, SMEs want to use the Level-1 and Level-2 in a sequential manner i.e. the anomalies from Level-1 are fed to Level-2. In the early stages of vehicle production, Level-2 anomaly detection (PIDs data mining) could be analyzed independently to detect the anomalies in the DTC data. In this section, we explain the details of anomaly detection at each Level.
3. ANOMALY DETECTION FRAMEWORK Traditionally, the SMEs detect the anomalies by manually sorting the field failure data using spreadsheets. This is labor-intensive and time consuming process. In this research work, we develop a data-driven framework which automates the anomaly detection and saves a significant amount of SME time. The objective of the framework is to provide the tool to SMEs so that they could spend more time on the analyzing anomalies and taking appropriate corrective actions.
Level-1: Detecting Anomalies in Claims data using Fault Model
Figure 2 shows the data-driven framework for anomaly detection. At Level-1, we detect the anomalies in claims data using the fault modeling tool. This is accomplished by first combining two different data sources i.e. repair data (claims) and diagnostic data (DTCs and PIDs). By combining two data sources, we derive sets of {RepairSymptom} on a specific vehicle. The {Repair-Symptom} set is provided to the fault model and then to a diagnostic reasoner. Using the fault model and the symptoms present in the component, the diagnostic reasoner recommends repairs to perform on the component. Next, we compare the recommended repair with the actual repair performed on that component. If the recommended repair does not match the actual repair then we term it as an anomaly. This type of periodic analysis provides a framework for early detection as to whether the appropriate diagnosis and repairs are being made or whether misdiagnoses leading to inappropriate repairs are occurring in the field. The distribution plot of appropriate and anomalous claims repairs provide a visual illustration to the SMEs by identifying early trends occurring for anomalous repairs. The Level-2 anomaly detection digs deeper and involves using information from PIDs to detect anomalies in the DTC data. Here, we perform data mining of PIDs data to detect anomalous conditions that set DTCs inappropriately (also called as,
As explained earlier in this Section, we employ a datadriven fault model to detect the anomalies in the claims data. The fault model and diagnostic reasoner analyzes the symptoms present in a specific vehicle and recommends a ranked list of repairs. If the repair suggested by the fault model does not match the repair performed on a specific vehicle then that specific vehicle repair is declared as an anomaly. In this Section, we first explain the anomalies in claims data followed by an introduction to the fault model and the process to develop it. Detecting Anomalies in Claims Data Using the fault model and diagnostic reasoner [8, 9], we use following criteria to label a field failure data as an anomaly: • If {Repair-Symptom} set in the field data does not match with the {Repair-Symptom} in the data-driven fault model i.e. technician performed a repair which was not listed as a potential fix. • If service of a failure was not performed properly and there is a repeat visit for the vehicle to address the failure then also it is labeled as an anomaly. The fault modeling identifies mismatches (or anomalies) in the field failure data. The SMEs analyze the reports for 4
Table I: Example of Fault Model Text Symptoms
Serviceable Parts and Failure modes
DTCs
PIDs
Manual tests (technician tests, scan tool results)
D1
D2
D3
SYM1
SYM 2
SYM 3
PID 1
PID 2
PID 3
PID 4
T1
T2
T3
T4
Comp A
FM 1
1
1
0
1
0
0
0
0
1
0
0
0
0
1
Comp B
FM 1
0
1
0
0
1
1
0
0
0
1
0
0
0
0
FM 2
0
0
0
0
0
0
1
0
0
0
0
0
0
0
Comp C
FM 1
1
1
0
0
0
0
0
0
0
0
0
0
1
0
FM 2
1
1
0
1
0
0
0
0
0
0
1
0
1
0
FM 3
0
0
0
0
0
0
1
0
0
0
0
0
0
0
Comp D
FM 1
0
0
1
0
0
0
0
0
0
1
0
0
0
1
FM 2
1
0
0
0
0
0
0
1
0
0
0
0
0
0
Comp E
FM 1
1
0
1
0
0
1
0
0
0
0
0
0
0
0
FM 2
0
0
0
0
0
0
0
0
0
0
0
1
0
0
FM 1
0
1
0
0
0
0
0
1
0
0
0
0
0
0
Comp F
identifying the repairs having an increasing trend in number of anomalies. The SMEs further categorize the anomalies into following types: 1. Misdiagnosis by a service technician: This could be because technician is inexperienced and insufficiently trained. Sometimes the technicians over-corrects the problem (e.g. replaces a control module instead of a circuit/wiring repair) to get more incentives. 2. Errors in Service Procedures: Development of service documents requires lot of interactions among various departments of OEM such as service and engineering departments. Sometimes, during such interactions the errors get into the service procedures. These errors could result into ambiguous testing procedures or improper fix which in turn results into anomalies. 3. New failure mode: This kind of anomaly refers to the failures which are not envisaged during the design phase. The repairs for such failures are not listed in the service documents which results into anomalies. These kinds of anomalies provide a learning loop to design engineers to detect new failure modes from the field and improve the diagnostic design. 4. Use of wrong repair code by the technician: Many times, the technicians use wrong repair code to claim the warranty. This results into an anomaly. A typical example of such anomaly is when the technician uses the component repair code for a wiring repair. If large no. of such anomalies occurs then quality engineers issue a technical service bulletin to prevent the escalations of such anomalies. 5. Errors in the fault model: Another possible reason of anomaly is that certain failure modes could be missed out while developing the fault model. Fixing such anomalies requires updating the fault model.
Fault Model Fault dependency matrix (or fault model)-based diagnosis has been highly successful in aerospace industry. Boeing has been using fault models since the early 1990's [10, 11]. Data-driven fault model-based tools developed by Honeywell Inc. (HI) for the aerospace industry (Boeing) [10, 11] describe the known causal dependencies among failure modes, symptoms and repairs by acquiring knowledge embedded in service manuals and extracting engineering knowledge by interviewing subject matter experts (SMEs). In addition, the fault model is developed from historical data such as observed causal dependencies between repairs and DTCs, failure rates, part costs, labor costs, etc. from historic field failure data using aggregate data mining techniques. There has been extensive work done in the areas of fault modeling development and reported in the literature. John Sheppard and William Simpson have performed significant research in this area which has been published in a book [12]. The fault model (Table I) captures the causal correlations between the failure modes and serviceable parts, and the symptoms of a given system. The number of failure modes (FM1, FM2 etc in Table I) and serviceable parts (Comp A, Comp B etc in Table I) are stored in rows of the fault model. The symptoms are stored in columns of the fault model. The correlation values in the fault model could be either a boolean value or a fractional value between 0 and 1. This value indicates the probability of detecting a specific failure mode via a specific symptom or relating a symptom to a serviceable part. A specific symptom may be correlated to more than one failure mode and serviceable part. A typical example of an automotive fault model (or fault dependency matrix) is shown in Table I, where the symptoms could be 5
diagnostic reasoners are well matured and applied to large problems [8, 9]. The case-based reasoners are another popular choice due to their simplicity however they are primarily based on distance-based metrics which are computationally expensive [12]. There exist several graphical models-based reasoners such as hidden Markov models and Bayesian networks which provides an excellent alternative to other reasoners due to their efficient handling of probabilistic inference computations. The detailed analysis of the fault model-based diagnostic reasoners is beyond the scope of this work. We recommend [12] by Sheppard et al. for a good summary of fault model-based diagnostic reasoners.
DTCs, PIDs, technician test outcomes, scan tool values or text symptoms (e.g. customer complaints). A component could have several failure modes and each failure mode could have different correlations with symptoms. The details of the data-driven fault model are explained in [13]. Fault Model Development There are several ways to develop a fault model such as manual or automated text processing of service procedures, manual modeling using engineering documents and automated data mining of field failure data. The engineering approach involves using signal flow diagrams (or structural diagrams) and engineering knowledge of the system such as FMECA data, signaling data, ECU data etc. We termed this approach as the Engineering D-matrix (or fault model) (EDx) approach. This can be extremely engineering intensive and preparing such a vehicle model from scratch might require a significant amount of engineering time and money. Another approach is to apply automated data mining techniques for extracting a D-matrix from field failure or warranty databases which we termed as the Historical data D-matrix (HDx) approach. The key advantage of this approach is significant savings in Dmatrix preparation time. However, the HDx approach may have much lower fidelity than t the EDx approach due in part to noise embedded in the field failure data as well as the lack of explicit engineering design information. A third approach is to capture the D-matrix from documented service procedures with the assumption that the existing service procedures are, in fact, correct. We term this approach as the Documents D-matrix (DDx) approach. The DDX approach may also require text mining and information retrieval technologies to capture the D-matrix from the source documents (represented in a machine readable format.). In [13], we have shared an industrial perspective on developing these D-matrices (or fault models) along with the discussion on pros and cons of each.
Level-2: Detecting Anomalies in DTCs using PIDs Data mining The Level-2 anomaly detection involves detecting the anomalies in DTC settings. The PIDs analysis detects the anomalies and reports them to the SMEs. The SMEs categorize the DTC anomalies into two categories: 1. Inappropriate preconditions of DTCs: The DTCs are set based on specific diagnostic algorithms which run under specific preconditions. For example, EVAP system large leak DTC diagnostic algorithm is designed to run after power up but before power down, when the fuel level is between 15–85%, engine coolant temperature is less than 35°C, and intake air temperature is between 4–30°C. However, if there are errors in DTC design algorithm then the DTCs will be set under inappropriate preconditions. For example, if the DTC diagnostic algorithm is running when the engine is still powering up or powering down then it would inappropriately set the DTC. Using the PIDs analysis, the SMEs can identify such inappropriate settings by analyzing the DTC anomalies. 2. Sensitive calibrations: This kind of anomalies occur when the DTCs software has errors either due to improper implementation of the design conditions or some of the calibrations on the operating parameters are sensitive. For example, if the flex fuel (ethanolmix) vehicles that are designed to operate using a specific percentage of ethanol mixed fuel is filled up with very low and very high percentage of ethanol then it may set a DTC depending on the sensitivity to the ethanol percentage in the fuel. Such kind of sensitive calibrations could be adjusted by analyzing the DTC anomalies.
The production fault model needs to be audited by the SMEs having expert domain knowledge of the component and knowledge of the failures that can occur with the component. Such SMEs may include quality engineers, technical experts, service and maintenance personnel, statisticians, and any other person having an in-depth knowledge of the component or the operation of the component. The failure modes of the component are collectively generated based on engineering knowledge, best practices, and past experiences of the SMEs. Diagnostic Inference
Freeze Frame Data (or PIDs data)
In order to utilize the diagnostic information stored in the fault model, one needs algorithms and methods to infer the root cause. These algorithms are known as diagnostic reasoners. Most diagnostic reasoners take the discrete outcomes of the symptoms and fault model as an input and give a ranked list of failure modes according to their likelihoods. The rule-based diagnostic reasoners are easy to develop, however it is hard to develop probabilistic rules and continuously update them. The set-partitioning based
The freeze frame PIDS data is a set of freeze frame operating parameters that is collected when a DTC is triggered. The PIDs data may indicate various operating conditions, such as voltage, current, temperature, pressure, etc., and may be made available to the service technicians through a scan tool, connected to the OBD port. The scan tool displays the PIDS data to the service technician.
6
Figure 3: PIDs Analysis - DTC Pareto
Figure 4: PIDs Analysis – Scatter Plot classify the DTCs and provide the results to SMEs for their review. The SMEs review the data mining results to understand the choice of PIDs selected by the decision trees algorithm. They review the distributions and correlations of these selected PIDs and determine whether a DTC has been triggered because of inappropriate preconditions or sensitive calibrations.
The service technicians use this data to perform the road test when they are unable to duplicate the customer complaints on the vehicle. Before doing PIDs analysis, the data needs preprocessing to adhere to: 1) The input needs of the data mining algorithm; and 2) Prefilter noisy data. Noise in the PIDs data can be related to missing values, multiple occurrences of the same DTC-PIDs patterns in a single readout (this can occur for DTCs that get repeatedly triggered) and incorrect entries. The PIDs analysis can be divided into three parts - data statistics, data correlations, and the data mining. In first step, the SME analyzes key statistics of the data using histograms. In second step, the tool allows the user to study linear and nonlinear combinations of the operating parameters and study the correlations among various PIDs and DTCs. Finally, we employ decision trees algorithm to identify key PIDs that
Step1: Data Statistics Figure 3 shows the data statistics functionality. It allows the SMEs to do simple statistical analysis by studying the frequency distribution of DTCs and PIDs. This enables the SMEs to perform a quick preliminary assessment of the PID values to identify the type of anomaly. Step2: Data Correlations Figure 4 shows the Data correlations and visualization through a scatter plot. The scatter plot allows the SMEs to 7
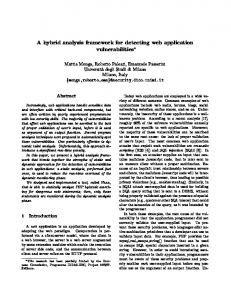
decision trees. The problem of constructing a decision tree can be expressed recursively. First, select an attribute (PIDs in our application) to place at the root node and make one branch for each possible value. This splits up the example set into subsets, one for every value of the attribute. Now the process can be repeated recursively for each branch, using only those instances that actually reach the branch. If at any time all patterns at a node have the same classification, stop developing that part of the tree. The only thing left to decide is how to determine which attribute to split on, given a set of examples with different classes (DTCs in our application). This shall be done by using a measure of purity which will choose input parameters (also referred to as attributes) that will produce the purest child nodes of the tree. The measure of purity that we use is called the information (I) and is measured in units called bits. More information on decision trees can be obtained from [14]. Figure 5 shows a decision tree for our application. The informative PIDs are represented by circles and the DTCs (classes) by rectangles. The values shown on the branches depict the conditions for which a specific path is valid. For example, in Figure 6, if control module voltage is less than and equal to 9 volts then the decision tree classifies 10 patterns with 100% classification accuracy into DTC 1682. However, sometimes the decision tree is not able to completely classify the patterns. For example, when the control module voltage is more than 9, drive mode is less than 150, and accelerator status is 1 then 7 patterns of DTC_PXXXY are misclassified and 20 patterns are correctly classified.
study PID relations to other PIDs. The SMEs analyze the scatter plot to determine if specific PID values are outside the normal thresholds for a given condition based on another PID values. For example, the normal threshold on EVAP system commanded purge is above 40% and EVAP system vapor pressure is below -1000 Pa. However, there are DTCs which are set when the EVAP system commanded purge is below 25% (Figure 4), that indicates anomalies due to inappropriate preconditions of the DTCs. Step3: Data Mining Data mining is a generic terminology and its main advantage is the ability of algorithms to autonomously learn the properties of a given data set. Here we employ classification learning which involves training the classifier with a set of pre-classified patterns. Once a classifier is trained in this manner it is expected to classify unseen patterns. In our scenario, we train the classifier using the data from historical DTCs and PIDs data of a fleet. The PIDs data for a specific DTC and specific vehicle is termed as pattern in our data settings. We employ decision tree as a classifier in our application. The DTC-PIDs data of a specific vehicle is a pattern where the DTC is the class of the given set of attributes (PIDs). The task of decision tree (classifier) is to learn from training data and identify the informative PIDs for the classification among DTCs. The informative PIDs are the PIDs that have more information (or entropy is a measure of randomness in the data) to classify DTCs. The decision trees have been widely studied in data mining community [14, 15]. Here we provide a brief discussion on
Figure 5: PID Analysis - Decision Tree
8
Figure 6: Evaporative Emission Control System (Source: Public Domain [16])
1
1
1
P0454
1
1
P0451
1 1 1 1 1 1 1 1 1 1 1
P0453
FUEL PRESSURE REGULATOR EVAPORATIVE EMISSION CANISTER VENT SOLENOID VALVE VACUUM HOSE HOSES EVAPORATIVE EMISSION CONTROL SOLENOID EVAP EMISSION CANISTER VENT VALVE PIPES FUEL AND EVAPORATIVE EMISSION CONTROL EVAPORATIVE EMISSION CANISTER CONTROL VALVE EVAPORATIVE EMISSION CANISTER SOLENOID FUEL TANK PRESSURE SENSOR EVAPORATIVE EMISSION CANISTER FUEL TANK FILLER CAP NECK FUEL TANK FILLER NECK HOSE AND--OR VENT HOSE FUEL TANK FILLER FUEL SYSTEM WIRING AND/OR CONNECTOR
P0452
Labor Codes/Repairs:14, DTCs:6
P0455
P0446
Table II: History-to-knowledge Fault Model of Evap System
1
1
1 1 1 1 1 1 1 1 1 1 1 1
module provides a 5-volt input voltage and a ground to the VP sensor. The VP sensor provides a signal voltage proportional to the gauge pressure, back to the control module. This DTC will set if the control module is unable to reset the VP sensor signal voltage to within the calibrated range. DTC P0452: The sensor output voltage to the ECM increases as vapor pressure increases. This DTC will set if an excessively low voltage from the sensor circuit is recorded in the control module. DTC P0453: This DTC will set if an excessively high voltage from the sensor circuit is recorded in the control module. A short to battery can set this DTC. A faulty sensor could also set this DTC. DTC P0454: This DTC will set if there is an intermittent problem in the sensor signal. It could be due to clogging, venting, kinking, disconnect or improper connection of rubber hose to EVAP control system pressure.
4. CASE STUDY: EVAPORATIVE EMISSION CONTROL SYSTEM We demonstrate the capabilities of the data-driven framework using the automobile EVAP system. The EVAP system (Figure 6) was developed to meet environmental regulations of preventing fuel vapors from escaping into the atmosphere, primarily from the fuel tank and fuel system of an automobile [16]. Here, we focus on the following DTCs of the EVAP system [17]: DTC P0446: This DTC tests the EVAP system for a restricted or blocked EVAP vent path that would cause excess amounts of vacuum to be developed in the EVAP system. DTC P0451: The fuel vapor pressure (VP) sensor measures the difference between the pressure or vacuum in the fuel tank and outside air pressure (gauge pressure). The control 9
Month-1
Month-2
Appropriate
Anomalies
99
87
15
23
26 0 3
4
VP VP Fuel sensor sensor level type 1 type 2 sensor
Evap hose
Fuel Cap
0
26
25
11
2
Appropriate
VP sensor type 1
11
5
0
VP sensor type 2
Fuel level sensor
Anomalies
22 0 3
4
Evap hose
Fuel Cap
Figure 7: Distribution of Anomalous Repairs Detected via Fault Model
62
Month - 1
64
Month-2 Anomalies
Anomalies 17
16
14
15
1
7
VP sensor VP sensor VP sensor VP sensor type type type type 1:P0454 2:P0454 1:P0451 2:P0451
VP sensor VP sensor VP sensor VP sensor type type type type 1:P0454 1:P0451 2:P0454 2:P0446
Figure 8: Distribution of Anomalous Repairs with Correlated DTCs the light duty or heavy duty engines. While analyzing the Year-2 data, we observe that there are anomalies in VP sensor claims. Figure 7 shows the distribution of anomalies and appropriate claims for different build months. The anomaly distribution shows that the number of VP sensor claims is the highest for vehicles built during Month-2. To determine the root cause of these anomalies, the fault modeling tool provides a distribution of DTCs correlated with anomalous claims.
The dealers perform diagnostics and service for each given failure (DTC or combination of DTCs) and employ labor codes for each of those repairs to claim warranty from the OEM. In this work, we develop the fault model by extracting the diagnostic information from historical field failure data of the test fleet vehicles. The historical datadriven fault model for the fuel evaporative emission subsystem and the fuel vapor pressure sensor is shown in Table II.
Level-1: Anomaly Detection in Claims Data using Fault Model
Figure 8 shows the DTCs correlated with anomalous claims. This distribution shows that VP sensor claims are highly correlated with P0451 or P0454 DTCs. SMEs employ additional engineering knowledge that P0446 is a causal DTC which triggers P0451 or P0454 hence we also used P0446 for the PIDs analysis. These anomalies generate clues to investigate the root-cause using the PIDs analysis.
The anomaly detection in the current example is performed by feeding the field failure data of Year-2 test fleet vehicles to the fault modeling application. The historical data (Year1) shows that VP sensor was replaced only for P0446, P0455, P0452, and P0453 DTCs. The VP sensor was not replaced for P0451 and P0454 DTCs. The vehicles had two types of VP sensors (type -1 and type-2) corresponding to
10
p Un-defaulted EVAP System yVapor Pressure, (Pa)
(
Figure 9: Decision Tree of Evap System DTCs
Evap. vapor pressure values for engine run time