Hydrol. Earth Syst. Sci., 16, 563–572, 2012 www.hydrol-earth-syst-sci.net/16/563/2012/ doi:10.5194/hess-16-563-2012 © Author(s) 2012. CC Attribution 3.0 License.
Hydrology and Earth System Sciences
Deep drainage estimates using multiple linear regression with percent clay content and rainfall D. L. Wohling1,2 , F. W. Leaney3 , and R. S. Crosbie3 1 School
of the Environment, Flinders University of South Australia, Bedford Park, P.O. Box 2100, Adelaide, SA 5001, Australia 2 Department for Water, Government of South Australia, Adelaide, Level 11, 25 Grenfell Street, Adelaide, SA 5000, Australia 3 Water for a Healthy Country National Research Flagship, CSIRO Land and Water, Glen Osmond Waite Road – Gate 4, Glen Osmond, SA 5064, Australia Correspondence to: D. L. Wohling (
[email protected]), F. W. Leaney (
[email protected]), R. S. Crosbie (
[email protected]) Received: 4 April 2011 – Published in Hydrol. Earth Syst. Sci. Discuss.: 5 May 2011 Revised: 23 January 2012 – Accepted: 20 February 2012 – Published: 24 February 2012
Abstract. Deep drainage estimates are required for effective management of water resources. However, field measurements are time consuming and costly so simple empirical relationships are often used. Relationships developed between clay content of the surface soil and deep drainage have been used extensively in Australia to provide regional estimates of deep drainage but these relationships have been poorly justified and did not include rainfall in the relationships. Here we present a rigorous appraisal of clay content of soils and rainfall as predictors of deep drainage using an extensive database of field observations from across Australia. This study found that annual average rainfall and the average clay content of the top 2 m of the soil are statistically significant predictors of point scale deep drainage. Relationships have been defined for annual, perennial and tree type vegetation as a line of best fit along with 95 % confidence intervals. This allows the uncertainty in these deep drainage estimates to be assessed for the first time.
1
Introduction
The capacity of effective groundwater management practices are expanded as our understanding of the driving processes, timescales and spatial distribution of groundwater recharge develop. Rainfall is an important predictor of groundwater recharge and as such there is value in understanding the spatial and temporal nature of rainfall. Petheram et al. (2002) established that rainfall variation accounted for 60 % of observed recharge variation for annual vegetation on sand soils
and 23 % of observed recharge variation for annual vegetation on non-sand soils across Australia. However, accurate measurement of recharge may be difficult to attain due to the small deep drainage fluxes that occur below the root zone. Invariably, groundwater recharge is associated interchangeably with deep drainage or potential recharge albeit a distinct difference defines the two terms. Simply, recharge is the flux of water that contributes to the saturated groundwater reservoir whereas deep drainage is the flux of water that moves through the unsaturated zone past the root zone. Deep drainage may become recharge after a lag time if there are no impeding layers that would create lateral flow. Assuming one-dimensional flow and that deep drainage will eventually recharge the unconfined aquifer, unsaturated soil zone profiles can provide long-term mean annual recharge estimates for both steady state and transient environments (Walker, 1998). Point scale methods are used to estimate low deep drainage fluxes in a transient environment however scaling up is often not practical because of the costs involved to obtain the required data. Hence, it is necessary to use a surrogate measurement that is more readily available as a proxy for deep drainage. The first effort to introduce a surrogate clay measurement for predicting deep drainage was by Kennett-Smith et al. (1994) who defined a log-linear relationship between deep drainage and clay content for the 0–2 m soil depth interval. The relationship was based on 89 deep drainage estimates made using the chloride front displacement (CFD) method (Walker et al., 1991) in the 300–400 mm rainfall areas of South Australia and Victoria in south-eastern Australia
Published by Copernicus Publications on behalf of the European Geosciences Union.
564
D. L. Wohling et al.: Deep drainage estimates using multiple linear regression
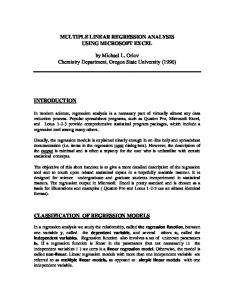
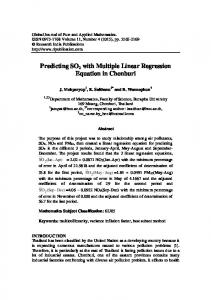
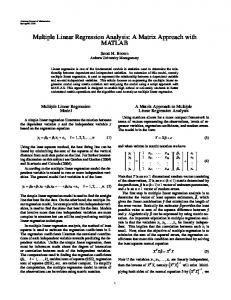
Fig. 1. Location of studies used to develop the multiple linear relationships.
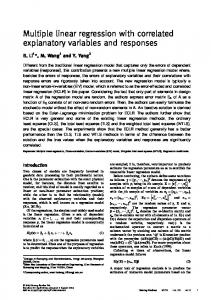
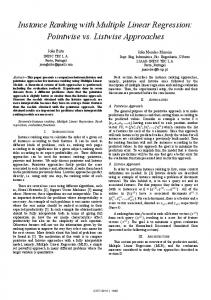
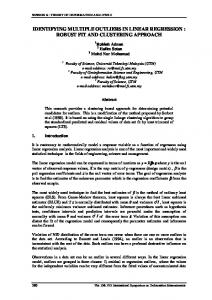
(Fig. 1). The average clay content over the 0–2 m depth interval (rather than 0–0.5 m or 0–1 m) was chosen as it provided the highest correlation for deep drainage and clay content using the Kennett-Smith et al. (1994) data set (SKM, 2002). More recent investigations (Leaney et al., 2004; Wohling, 2007) revised the relationship given by Kennett-Smith et al. (1994) for higher rainfall areas based on local recharge investigations; however minimal statistical rigour was employed in developing the revised correlations. Personal judgement defined each new relationship rather than a statistical correlation. Comparison of the log-linear relationship between deep drainage and average clay content (0–2 m) data from Kennett-Smith et al. (1994), Leaney et al. (2004) and Wohling (2007) provided evidence for a trend attributable to rainfall amount (Fig. 2). This can be seen in the relationship of Wohling (2007) which gives the highest deep drainage throughout the range of clay content using data from field sites with a rainfall range of 470–570 mm yr−1 , compared to the 390–500 mm yr−1 range of Leaney et al. (2004) and 300– 400 mm yr−1 range of Kennett-Smith et al. (1994). These relationships between deep drainage and average clay content (0–2 m) have been widely used as a proxy for determining deep drainage rate estimates beneath annual crops and pastures on land previously cleared of native vegetation (Kennett-Smith et al., 1994; Leaney et al., 1999, 2004; Leaney and Herczeg, 1999; Leaney, 2000; Cook et al., 2001, Hydrol. Earth Syst. Sci., 16, 563–572, 2012
2004; Wohling et al., 2005; Wohling, 2007) in southeastern Australia. Crosbie et al. (2010a) recently compiled and reviewed a database of 4386 recharge and deep drainage estimates over 172 studies across dry land areas of Australia. This included a review of several previous Australian recharge review papers (Kennett-Smith et al., 1994; Petheram et al., 2000, 2002; Cook et al., 2001; Tolmie and Silburn, 2003; Silberstein, 2010). Crosbie et al. (2010b) then used this database to develop a tool for estimating the relationships between recharge and rainfall, soil type and land use in data poor areas. The soil type in these relationships were classified into five discrete groups, however the soil properties relevant to deep drainage are known to exist as a continuum rather than discrete classes (Kennett-Smith et al., 1994). This paper tests the finding of SKM (2002) that the average clay content of the top 2 m of the soil profile is the best proxy for estimating deep drainage by examining a more substantial database (Crosbie et al., 2010a) in terms of the data quantity and spatial variability (including soil and rainfall variability) to provide the best unsaturated zone proxy for estimating deep drainage. A literature search of comparable studies found that no other work had used actual soil clay content data as a proxy for deep drainage or recharge in correlation with rainfall as field clay content is typically not reported or reported inconsistently. Sophocleous (1992) used multi-linear regression www.hydrol-earth-syst-sci.net/16/563/2012/
D. L. Wohling et al.: Deep drainage estimates using multiple linear regression
565
100
Drainage (mm)
10
1 Kennett-Smith et al 1994: Data Kennett-Smith et al 1994: Correlation Leaney & Herczeg 1999: Data Leaney et al 1999, Leaney 2000, Leaney et al 2004: Data Cook et al 2004: Data Leaney et al 2004: Correlation
Wohling et al 2005, Wohling 2007, unpub used in Wohling 2009: Data Wohling 2007: Correlation
0.1
0
10
20
30
40
50
60
Percent clay content (0-2m) Fig. 2. Summary of deep drainage and percent clay content (0–2 m) correlations.
analysis of total annual precipitation, average maximum spring soil profile water storage, average shallowest spring depth to water table and average spring precipitation rate to assess recharge. Delin et al. (2000) applied multi-linear regression models to assess the effects of topography and soil properties on recharge on lowland and upland agricultural field sites near Princeton, Minnesota; and used precipitation (amount of water applied), average rainfall or irrigation water application intensity and antecedent moisture content for the entire unsaturated zone as the independent variables. Keese et al. (2005) evaluated controls on recharge by simulating deep drainage in a five metre thick one-dimensional unsaturated flow code using climate data, vegetation and soil coverages from online sources for Texas and simulated 30-year mean annual recharge. Vegetation and soil textural variability both resulted in a large range of recharge rates within each region; however Keese et al. (2005) also found that the spatially weighted long-term recharge rates were much less variable and positively correlated with mean annual rainfall. For non-vegetated, texturally variable simulations, Keese et al. (2005) explained that multi-linear regressions using loglog data showed that including clay content (profile average) with precipitation explains 80 % of the variation in recharge and that recharge varied over 1 to 2 orders of magnitude locally, because of textural variability among soil profiles. The modelled results presented by Keese et al. (2005), specifically the order of magnitude over which recharge varied, are comparable with the measured results presented in this paper. This paper builds upon previous research by using multiple linear regression (MLR) to develop relationships capable www.hydrol-earth-syst-sci.net/16/563/2012/
of predicting deep drainage from measured soil clay content and mean annual rainfall, where previous studies have not used both rainfall and measured soil clay content to estimate deep drainage. Specifically the aims of this paper are to: 1. determine if a statistically significant relationship can be developed to predict deep drainage using previously published field data; 2. determine the best metric of the clay content of the soil for predicting deep drainage; and 3. estimate the uncertainty in the deep drainage estimates made using MLR. 2 2.1
Methods Data collation of previous studies
In order to improve the statistical correlation between deep drainage, clay content and rainfall, as developed in this paper; the database of Crosbie et al. (2010a) was filtered to include only those recharge and deep drainage estimates that reported rainfall amount and clay content of the soil. Less than 5 % (202 recharge/deep drainage estimates) of the original database (Crosbie et al., 2010a) fitted these criteria (Fig. 1). It was from this filtered set of data, which includes all data presented in Fig. 2, that the MLR was performed. The data was re-queried and re-classified to assess how soil structure may affect deep drainage rates. The average clay content was determined over various intervals (0 to 0.5 m, Hydrol. Earth Syst. Sci., 16, 563–572, 2012
566
D. L. Wohling et al.: Deep drainage estimates using multiple linear regression
0 to 1 m and 0 to 2 m) to determine the best depth for averaging to use as a predictor of deep drainage. Also, a classification based on the highest clay percentage in a soil profile (rather than an average over an interval) was used to investigate whether or not the use of impeding layers could improve the correlation. The data was categorized into annuals, perennials and tree type vegetation as differing vegetation types were found to give differing rates of deep drainage for a particular soil type and rainfall (Crosbie et al., 2010b). An analysis was also performed on a combined perennial and tree category due to a scarcity of data for both groups. Of those 202 recharge and deep drainage estimates having soil textual data, 177 are estimates beneath annuals, 7 beneath perennials and 18 beneath trees. The mean annual rainfall ranged between 260 and 731 mm and clay content between zero and 60 % for those annual vegetation sites; while for perennial vegetation, mean rainfall ranged from 587 mm to 1265 mm and soil clay content between zero and 60 %; and for tree vegetation annual rainfall varied from 460 mm to 731 mm with clay content between 0.7 and 60 %. Data used in this paper are heavily biased in the southwestern Murray Darling Basin with the remaining data coming from the mid coast of New South Wales (NSW) and south eastern Queensland (Fig. 1). The studies that have generated most of the data are summarised as follows. Kennett-Smith et al. (1994) compiled a review of studies in the south-western Murray Darling Basin, primarily the Mallee and Wimmera regions of north-western Victoria, eastern South Australia and south-western NSW. Kennett-Smith et al. (1994) used the chloride front displacement (CFD), water balance, and water table fluctuation (WTF) methods to determine deep drainage and recharge associated with the clearing of Eucalyptus mallee woodland (in the form of shrub land, scrub or heath) between 1900–1914 and 1920–1930 for rotational cereal cropping, sheep and beef cattle grazing. Leaney and Herczeg (1999) and Cook et al. (2001) studied the Mallee region of the south-west Murray Darling Basin including the Little Desert and Big Desert using soil-water chloride concentration profiles, groundwater chloride, stable isotopes of water and carbon-14 to determine recharge processes and provide deep drainage estimates beneath Mallee vegetation and cleared pastures and cropping. Similarly, Leaney (2000) investigated recharge processes and provided deep drainage estimates for the Tintinara area of South Australia using the CFD and steady state soil chloride mass balance (CMB) methods for mallee vegetation and cleared dry land cropping and pastures. Cook et al. (2004) investigated deep drainage and aquifer recharge in the north-east Mallee region of South Australia and determined that clearing of native vegetation (Eucalyptus mallee) and replacement with dryland cropping and pastures lead to increased salt loads to the Murray River. Cook et al. (2004) used the CFD method for estimating point estimates of deep drainage and developed equations for estimating the time lag between an increase in deep drainage Hydrol. Earth Syst. Sci., 16, 563–572, 2012
and increase in aquifer recharge. They then spatially extrapolated the data to provide a deep drainage map and predicted time delays for transport through the unsaturated zone. Wohling et al. (2005) used the CFD method to estimate deep drainage beneath pastures in the Padthaway region of south east South Australia. Leaney et al. (2006) used the CMB method under native vegetation, dry land pasture, and tree plantations in the lower south-east of South Australia. In the Border Designated Area and Keith region of southeast South Australia, Wohling (2007) used the water balance, daily soil water balance, CMB, CFD and LEACHM (Leaching Estimation and Chemistry Model, Hutson 2003) to determine recharge and deep drainage rates beneath native vegetation, pastures and crops. Unpublished data used in Wohling (2009) followed on from the work of Wohling et al. (2005) to estimate additional deep drainage rates under pastures using the CFD in the Padthaway region of south-east South Australia. Tolmie et al. (2004) used a transient CMB method in south-east Queensland to determine recharge beneath native vegetation, cropping and pastures, and perennial lucerne. Crosbie et al. (2005) investigated recharge in the Tomago Sand Beds near Newcastle, NSW. The WTF method was used to predict gross recharge under perennial vegetation in heath and mining revegetation areas. 2.2
Statistical methods
Regression analysis explains movements in the dependant variable (Y ) as a function of the independent variables (X) through the quantification of an equation. The simplest measure of the quality of fit is the coefficient of determination (R 2 ), which is the proportion of variation of Y about its mean (Y ) that is explained by the model. The higher the R 2 the closer the estimated regression fits the sample data. The level of significance (significant F ) tests whether the hypothesis, that the data forms a relationship, is null, specifically testing whether the data has no relationship. If the hypothesis is null it can be concluded that the equation does have a significant overall fit. For example, when significant F is less than 0.05 (5 %), then a relationship is likely. If significant F is more than 0.05, then a relationship is unlikely. The P-value provides a measure of how much evidence we have against the null hypothesis, i.e. we test the probability of getting statistics approaching the actual observed data, assuming a hypothesis that is null. The lower the P-value, the more significant the result is as it is unlikely the null hypothesis is true. Average annual deep drainage estimates (d, mm yr−1 ) were set as the dependant Y variable and clay content (either average or highest percentage, %) and average annual rainfall (mm) were set as the independent X variables. R 2 , significant F , P-value and regression coefficients were presented as outputs, along with the 95 % prediction intervals around www.hydrol-earth-syst-sci.net/16/563/2012/
D. L. Wohling et al.: Deep drainage estimates using multiple linear regression
567
Table 1. Multiple linear regression results under annual vegetation. Data treatment, ANNUALS
Average clay % (0–0.5 m)
Average clay % (0–1 m)
Average clay % (0–2 m)
Highest clay % (0–2 m)
R2 Observations Significant F P-value (clay variable) P-value (rainfall variable) Coefficient – Intercept (y0 ) multiple regression Coefficient – b (clay) multiple regression Coefficient – a (rainfall) multiple regression Coefficient – intercept interval – (y0 ) 95 % prediction – lower Coefficient – b (clay) 95 % prediction interval – lower Coefficient – a (rainfall) 95,% prediction interval – lower Coefficient – intercept (y0 ) 95 % prediction interval – higher Coefficient – b (clay) 95 % prediction interval – higher Coefficient – a (rainfall) 95 % prediction interval – higher
0.4323 79 4.54E-10 0.867 1.16E-10 −0.493 −6.20E-04 3.52E-03
0.4890 83 2.17E-12 0.837 2.84E-13 −0.757 7.87E-04 3.98E-03
0.3521 177 3.99E-17 3.7E-05 5.68E-18 −0.039 −1.19E-02 3.03E-03 −0.993 −1.19E-02 2.99E-03 0.915 −1.19E-02 3.06E-03
0.3233 51 8.51E-05 0.608 2.65E-05 −1.006 −2.75E-03 4.38E-03
the best fit for the best model for each vegetation type. All regression equations were given in the form:
recharge estimates for trees and perennials around Australia and as such a combined category was assessed.
log d = y0 + (b · clay) + (a · rainfall)
3.2
(1)
where y0 , b and a were fitting parameters. 3 3.1
Results Determine if a statistically significant relationship an be developed to predict deep drainage using previously published field data
Within each vegetation category, the data was interrogated to summarise average clay contents over various depth intervals or the highest clay content across a depth interval. For each interrogated data set, a MLR analysis was performed for both deep drainage and log deep drainage terms. Consistently the log deep drainage regression gave a superior R 2 , and therefore we only provide those results here. Table 1 summarises results from the MLR for annual vegetation and emphasizes that statistically significant relationships between the average clay content over the 0–0.5 m, 0–1 m and 0–2 m intervals and highest clay content over the 0–2 m interval can be developed to predict deep drainage. For each case stated in Table 1, the Significant F term is less than 0.05, indicating that a relationship between log deep drainage, rainfall and each clay content variable are likely to be true. Results from the MLR analysis for deep drainage under trees and perennials are summarised in Table 2 and again highlight statistically significant relationships with Significant F less than 0.05 in each case. Limited soil textural information was available in conjunction with deep drainage or www.hydrol-earth-syst-sci.net/16/563/2012/
Determine the best metric of the clay content of the soil for predicting deep drainage
As described previously, the simplest measure of fit, R 2 , illustrates how well the MLR model fits the sampled data. For the case of deep drainage below annuals (post-clearing) data, the strongest correlation was given by the average clay content (0–1 m), R 2 = 0.489. However when we investigated the statistical fit more thoroughly we found that even though there was an overall significance to the MLR for average clay content (0–1 m), (Significant F = 2.17E-12), there was no correlation between log deep drainage and clay (Pvalue = 0.837). It was similarly true for the average clay content (0–0.5 m) and highest clay content (0–2 m) MLR results. Despite having a lower degree of fit to the data (R 2 = 0.3521), the MLR statistical results for average clay content (0–2 m) showed a relationship was very likely to exist between average clay content (0–2 m), rainfall and log deep drainage (Significant F = 3.99E-17). Moreover, there was evidence for correlations between log deep drainage and clay (P-value = 3.7E-05); and log deep drainage and rainfall (P-value = 5.68E-18). From the evidence provided in Table 1, we conclude that the best metric of clay content to use as a surrogate for determining deep drainage is the average between zero and two metres. A MLR using the average clay content (0–2 m) for trees gave a good fit against the data, R 2 = 0.7665. A MLR was performed on average clay contents (0–0.5 m) and (0– 1 m) beneath trees, however the results are not given here. Whilst a relationship was likely between log deep drainage, Hydrol. Earth Syst. Sci., 16, 563–572, 2012
568
D. L. Wohling et al.: Deep drainage estimates using multiple linear regression
Table 2. Multiple linear regression results under trees and perennial vegetation types. TREES
PERENNIALS
TREES & PERENNIALS
Data treatment, TREES & PERENNIALS
Average clay % (0–2 m)
Average clay % (0–2 m)
Average clay % (0–2 m)
R2 Observations Significant F P-value (clay variable) P-value (rainfall variable) Coefficient – intercept (y0 ) multiple regression Coefficient – b (clay) multiple regression
0.7665 18 1.83E-05 4.92E-06 5.89E-03 −0.986 −3.35E-02
0.9373 7 3.93E-03 0.727 0.039 −1.846 −4.77E-03
0.8696 25 1.86E-10 1.62E-06 2.27E-07 −0.723 −2.74E-02
Coefficient – a (rainfall) multiple regression Coefficient – intercept (y0 ) 95 % prediction interval – lower Coefficient – b (clay) 95 % prediction interval – lower Coefficient – a (rainfall) 95 % prediction interval – lower Coefficient – intercept (y0 ) 95 % prediction interval – higher Coefficient – b (clay) 95 % prediction interval – higher Coefficient – a (rainfall) 95 % prediction interval – higher
3.62E-03
3.91E-03
2.99E-03 −1.671 −2.76E-02 2.92E-03 0.225 −2.72E-02 3.08E-03
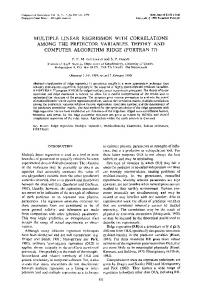
rainfall and average clay content (0–0.5 m and 0–1 m), significant F < 0.05, in each case a relationship was not likely between log deep drainage and clay; and log deep drainage and rainfall, P-value > 0.05. The database included deep drainage, rainfall and average clay content (0–2 m) information for seven perennial vegetation sites that provided a very good statistical fit (R 2 = 0.9373) and showed that a relationship was likely to exist (Significant F = 3.93E-03). However, it was unlikely that a correlation existed between log deep drainage and average clay content (0–2 m), P-value = 0.727. A review of the recharge and deep drainage database (Crosbie et al., 2010a) provided limited soil textural data for tree and perennial land use types and as such a merged MLR analysis was performed to test whether an increased sample size would improve the data fit and to test the level of significance of the data set. The merged tree and perennial MLR provided a better fit of the data compared to trees alone, R 2 = 0.8696, and illustrated that a relationship between average clay (0–2 m), rainfall and log deep drainage for the merged data was likely to exist, Significant F = 1.86E-10. 3.3
Estimate the uncertainty in the deep drainage estimates made using MLR
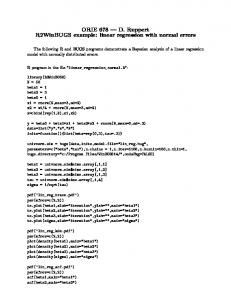
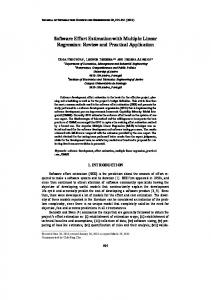
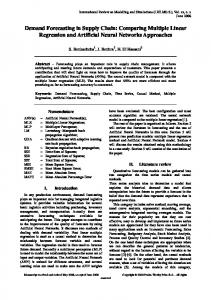
Given that a relationship between average clay content (0– 2 m), rainfall and log deep drainage was very likely to exist (Significant F = 3.99E-17), we were warranted in producing 95 % prediction intervals for the annual vegetation log deep drainage, rainfall and average clay content (0–2 m) correlation (Table 1, Fig. 3). The 95 % prediction interval described a range within which 95 % of data was expected to occur. Data points that fell outside of this range were for estimates Hydrol. Earth Syst. Sci., 16, 563–572, 2012
Fig. 3. Plot of multi linear regression equation developed for annual vegetation type also showing 95 % prediction intervals.
www.hydrol-earth-syst-sci.net/16/563/2012/
D. L. Wohling et al.: Deep drainage estimates using multiple linear regression
569
and cleared land in the Wimmera-Mallee region of southern Australia. With limited data available in terms of clay content, and encompassing a narrow rainfall range, SKM (2002) suggested that clay content within the 0–2 m interval provided the best fit as a proxy measurement for determining deep drainage. Now, with the aid of a larger database of recharge and deep drainage estimates across Australia detailing clay content in the unsaturated zone over a larger rainfall range, we have been able to develop a more reliable approach for predicting deep drainage and can now provide an uncertainty range about those deep drainage estimates. Using this larger data set, we have provided statistical evidence that – the average clay content rather than the highest clay content for a soil profile was a more appropriate proxy measure; – the average clay content (0–2 m) as opposed to 0–0.5 m and 0–1 m still provided the best predictor of deep drainage; – in conjunction with rainfall data improved the significance of such a correlation with deep drainage that had previously not been specified; and
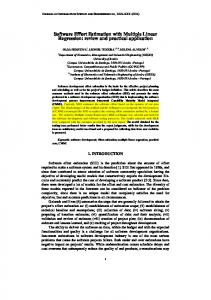
Fig. 4. Plot of multi linear regression equation developed for combined tree and perennial vegetation types also showing 95 % prediction intervals.
of deep drainage in very low rainfall zones (