Abstract. The Hybrid Spline method (H-spline) is a method of density estimation which involves regression splines and smoothing splines methods. Using ba-.
Density Estimation via Hybrid Splines Ronaldo Dias Universidade Estadual de Campinas � Abstract The Hybrid Spline method (H-spline) is a method of density estimation which involves regression splines and smoothing splines methods. Using basis functions (B-splines), this method is much faster than Smoothing Spline Density Estimation approach (Gu, 1993). Simulations suggest that with more structured data (e.g., several modes) H-spline method estimates the modes as well as Logspline (Kooperberg and Stone, 1991). The H-spline algorithm is designed to compute a solution to the penalized likelihood problem. The smoothing parameter is updated jointly with the estimate via a cross-validation performance estimate, where the performance is measured by a proxy of the symmetrized Kullback-Leibler. The initial number of knots is determined automatically based on an estimate of the number of modes and the symmetry of the underlying density. The algorithm increases the number of knots by �
Postal address: Departamento de Estat��stica, IMECC, Cidade Universit�aria "Zeferino Vaz",
Caixa Postal 6065, 13.081-970 - Campinas, SP - BRAZIL
1
1 until the symmetrized Kullback-Leibler distance, based on two consecutives estimates satis es a condition which was determined empirically. Key words: density estimation, penalized loglikelihood, B-splines, logspline, smoothing parameter, Kullback-Leibler distance.
1 Penalized Loglikelihood for H-splines In this section we describe the Hybrid spline method for density estimation which combines ideas from logspline density estimation (Kooperberg and Stone, 1991) and smoothing splines density estimation (Wahba, 1990; Gu, 1993). In logspline density estimation the choice of the number and location of knots are optimized and it is combined with maximum likelihood estimation, while smoothing spline density estimation employs the penalized likelihood method. Let X1 ; : : : ; Xn be i.i.d. random variables with an unknown probability density function f on a nite domain X . The goal is to estimate the density f from the data Xi. Since f is a probability density function, any estimate must be positive and integrate to one. To enforce the positivity and unity constrains on f , we use
R
the logistic transformation (Leonard, 1978) f = eg =( eg ). It is easy to see that this transformation is not one-to-one, however, a side condition on g, such as g(x0) =
R
0; x0 2 X or X g = 0 is needed to determine this transformation uniquely. Under this scheme a density estimate is de ned to be the minimizer of the penalized likelihood
2
equation.
Z g Z 00 2 n X 1 ? n g(Xi) + log X e + � (g ) i=1
(1.1)
The minimization is over the class H of the absolutely continuous functions on X whose second derivative is square integrable. In the smoothing spline density estimation approach the class of functions H is assumed to be a reproducing kernel in Hilbert space (RKHS ) and the basis functions are the ones used in (Wahba, 1990)). Here, a di�erent approach is suggested and B-splines (de Boor, 1978) are used as basis functions, and their computational advantages make this algorithm faster, for univariate densities, than Gu's algorithm ((Gu, 1993)). Di�erently than other methods, this approach takes into account the number of basis functions and the smoothing parameter � to control the trade-o� between goodness of tting and smoothness of the density estimate. For this, assume that a density function f0 is in H. Then, we approximate g0, the solution of the penalized likelihood equation, by linear combinations of basis functions that span
HK = fg 2 NCS 4 : g = PKi=1 ciBi g, where NCS 4 stands for natural cubic spline of
order 4. That is, g0 � g = PKi=1 ciBi, where the notation g0 � g means g0 is approximately equal to g. Later, we measure this approximation by taking the symmetrized Kullback-Leibler distance. Consider X , the domain of the density function f0, and the logistic transformation
R
f0 = eg0 = X eg0 with side condition
R g X
0
= 0, then we obtain,
Z K X g (x)dx � g(x)dx = cj Bj (x)dx: X X X Z
Z
0
j =1
3
(1.2)
R
Letting pj = X Bj (x)dx, we have PKj=1 cj pj = 0, or cK = ? PKj=1?1 cj pj =pK . Therefore for any function g, such that g 2 HK can be written as
g(x) =
RT c
(1.3)
R = (R1; : : : ; RK?1)T and Rj = Bj ? pp BK for j = 1; : : : ; K ? 1.
where
j k
Now the numerical problem becomes to minimize:
A�(c) = ?n1 (Qc) + log T
Z
X
exp( RT c) + (�=2)cT c
(1.4)
where Q is n � (K ? 1) matrix with entry Ri (Xj ) = Rij , the penalty matrix has entries
R
ij = Ri00 Rj00 for i; j = 1: : : : ; K ? 1, where R00 is the second derivative of the function
T R. The vector ?n1 = ( n1 ; : : : ; n1 ) is of dimension 1 � n, and rank( ) = K ? 2, since
two of the basis functions are linear. A standard procedure to minimize A� (c) is to apply Newton-Raphson iteration. For that, let us consider two densities f and h and denote their mean and covariance
R
R
with respect to g as, �g (h) = heg = eg , Vg (f; h) = �g (fh) ? �g (f )�g (h) with Vg (h) =
Vg (h; h). Write g~ = RT c~ as the current iteration of g. Then, letting �R = �g~(R) and VR;R = Vg~(R; RT ), we have @A� (c) j = ?QT 1/n + � + � ~c ; R @c g~ and,
@ 2 A�(c) j = � (R; RT ) ? � (R)� (RT ) + �
g~ g~ g~ @c@cT g~ = Vg~(R; RT ) + � = VR;R + � : 4
Hence, the Newton updating equation is: (VR;R + � )T c = QT 1=n ? �g~(R) + VR;g :
(1.5)
T c~ = V , where V Since VR;R ~). R;g R;g = Vg~ (R; g
Consequently, to compute the minimizer of (1.4) for a xed �, one iterates (1.5) not directly but making use of the symmetrized Kullback-Leibler distance between
g = log f and g0 = log f0 given by L(g; g0) = KL(f; f0 ) + KL(f0 ; f ) =
Z
Z
(g ? g0)eg + (g0 ? g)eg0
= �g (g ? g0) + �g0 (g0 ? g):
(1.6) (1.7) (1.8)
Note that equation (1.5) de nes a class of estimates with variable �, and a better use of this equation is to start from a current g~, instead of calculating the next iterate based on any prespeci ed �, one may choose � which delivers a small L(g; g0) for
g among the class of estimates de ned by (1.5). Now, compute an update using such a �. This iteration scheme tries to minimize the loss function L(g; g0) instead of minimizing the penalized likelihood equation (1.4). When such a performanceoriented iteration converges at �� , and g� is apparently the xed point of the Newton iteration for minimizing A�� , and hence it is the minimizer of A�� .(See (Gu, 1993) for details in the case of reproducing kernel in Hilbert space) It can be noticed that such a L is not easily computable for a class of estimates de ned by (1.5), even with a known g0. Thus, approximation is needed. Similarly to 5
Gu (1993) a proxy of L is given by, Lg~(g; g0) = Vg~(g)=2 ? Vg~(g; g~)+ �g~(g) ? �g0 (g). The idea is to try to minimize L by calculating an update from g~ using (1.5) with variable
�. Observe that the rst three terms of Lg~ are readily computable, but the fourth needs estimation. For that, de ne: H = VR;R + � ; with uR = QT 1=n ? �R + VR;g and vR = VR;g ? �R : Note that H is K ? 1 � K ? 1 matrix and not n � n as in (Wahba, 1977; Gu, 1993), with K � n. Since VR;R is positive de nite matrix, is nonnegative de nite matrix, and � > 0, the estimate de ned by (1.5) has the expression,
g = RT c = RT H ?1QT 1=n + RT H ?1vR ;
(1.9)
substituting c = H ?1uR. Moreover, straight but tedious calculations give �g~(g) ?
Vg~(g; g~) = ?vRT H ?1uR and Vg~(g) = uTRH ?1uR ? �uTRH ?1 H ?1uR . To estimate �g0 (g), the only source of information is the empirical distribution of the data. For the last term of (1.9), sample means simply give 1T =nQH ?1vR . (For a comparison to reproducing kernel in Hilbert space see Gu (1993) eq. 3.4). For the rst term,
Xn �g0 (RT H ?1QT 1=n) = n1 �g0 (RT (Xi)H ?1R(Xi)): i=1
It can be seen that the problem with the naive sample mean is the use of Xi itself in the estimation of �g0 (RT (Xi)H ?1R(Xi)). Using the empirical distribution of the remaining n ? 1 data to estimate �g0 (RT (Xi)H ?1R(Xi )), we have:
6
1
Xn X RT (X )H ? R(X ) = 1
i n(n ? 1) i=1 j6=i n X n n X X 1 1 T ? 1 = n(n ? 1) R (Xj )H R(Xi) ? n(n ? 1) RT (Xi )H ?1R(Xi) i=1 j =1 i=1 n 1 = n ? 1 (QT 1=n)T H ?1QT 1=n ? n(n ? 1) trace(QH ?1 QT ): (1.10) j
Letting tr(�) = trace(�) and noting that
Vg~(g) ? � (g) = tr(QH ?1QT ) ? (QT 1=n)T H ?1Q1=n ? uTRH ?1uR + vT H ?1u ; g0 R R 2 n(n ? 1) n?1 2 we have a proxy of L as: ?1 QT ) (QT 1=n)T H ?1 Q1=n uT H ?1 uR �uT H ?1 H ?1 uR L^� (g; g0) = tr(nQH ? ? R 2 ? R 2 : (n ? 1) n?1
(1.11)
Since (1.11) is a cross-validation of �g0 (RT H ?1QT 1=n), is natural to think of it as cross-validation score under the context of Hybrid splines for density estimation. Moreover, the performance-oriented iteration can then be conducted by minimizing (1.11) in each iteration, similarly to (Gu, 1993) in the reproducing kernel in Hilbert space.
2 Choosing the Initial Number of Knots It is well know that the number of knots is, somewhat, a function of the structure of the data, such as the number of modes and asymmetry. For example, if the underlying density has 2 modes then we need to get an estimate based on more knots 7
than if we had a \true" density with a single mode. Even when the true density has a single mode but it is asymmetric we need larger number of basis functions than in the case of symmetric densities. Considering this, the algorithm estimates the number of modes and determines whether the distribution is symmetric. First a naive, but extremely fast estimate of the unknown density is provided by the histogram of the data. The number of equal intervals of this histogram is given by the integer part of the logarithm of the number of observations, denoted by
N = dlog ne. To avoid overcounting the number of modes a smoothing procedure is applied on the histogram. To describe such procedure, let freq(j ) be the frequency of j th class (interval) of the histogram, with j = 1; : : : ; N . Below we describe an algorithm to estimate the number of modes.
Algorithm: Estimating the number of modes For
j = 1; : : : ; N ? 1
(a) if (freq(j ) ? freq(j + 1) < 0), sign(j ) = ?1. (b) if (freq(j ) ? freq(j + 1) > 0), sign(j ) = 1. (c) if freq(j ) = freq(j + 1) and freq(j ) = 0 then sign(j ) = 0. (d)
iffreq (j )
= freq(j + 1) and freq(j ) 6= 0
number on (0; 1) and check: end for For
if
then
generate u a uniform random
u < :5, sign(j ) := ?1, else sign(j ) := 1.
j.
k = 1; : : : ; N ? 2
(e) if sign(k) � sign(k + 2) > 0 then sign(k) = sign(k + 1). 8
end for For
k.
l = 2; : : : ; N ? 1
(f) if sign(l) � sign(l + 1) = ?1 then count = count + 1 end for
l.
(g) Compute the number of modes m
m = d:5(count + 1)e For asymmetric densities more basis functions are necessary, but this implies in higher computational cost. It would be interesting to detect densities belonging to asymmetric families, e.g., Gamma and Beta (and their scale translations) and to apply well known transformations in such way that makes the underlying density approximately symmetric, and hence reducing the computational cost. See for details (Hinkley, 1975; Hinkley, 1977). By default asymmetry is tested as proposed by (Hinkley, 1977), and if the distribution is asymmetric and unimodal, the usual power transformation is applied to (Xi ? X(1) ) (in order to scale the data to the interval (0; 1)), where X(1) = minfX1; : : : ; Xng. The best optimal value of the power is obtained based on the data set (Hinkley, 1975; Hinkley, 1977). However the transformation is optional. The symmetry test used can be described as the following, let X1; : : : ; Xn be i.i.d. nonnegative random variables, X~ the sample median, X� the sample mean, and Sn the sample standard deviation. if
T=
pn(X~ ? X� ) Sn 9
�c;
we say the density is asymmetric. Otherwise the density is considered to be symmetric. The constant c depends on the P (T � c) = �, where � is prespeci ed. Cherno�, Gastwirth and Jones (1967) proved that X~ ? X� divided by an appropriate constant converges in distribution to a standard normal. Our empirical study with one thousand replications of normal densities with sample sizes 100, 500 and 1000 showed that T is approximately normal with mean zero and standard deviation 0.75. Hence,
T=
pn(X~ ?X� ) 0:75Sn
is approximately normal distributed with mean zero and variance one.
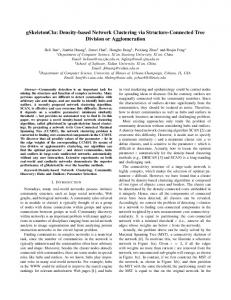
Thus the value of c in our study is 1:96 � 0:75 Simulations have shown that when the shape parameter of Gamma density is 2, 3 and 4 with sample size 200, Hybrid splines is about 3 times faster than when it does not apply a transformation. The Hybrid splines code estimates the true density of the transformed data and back-transforms the estimate to original scale. As mentioned (Scott, 1992), we also observed that when the estimate is transformed back, it returns a smoother estimate than if it was computed in the original scale. An explanation for that fact would be that the H-splines code for transformed data needs fewer knots than for the untrans-
p
formed data (for n � 300, roughly log(n) and n ? 4 respectively). Consequently we obtain a smoother curve in the original scale. Figure 2.1 shows the e�ect of power transformation on the original data points. One observes that the result is quite interesting because the estimate obtained after transformation, visually, is very close to the true density. In fact the symmetrized 10
Kullback-Leibler distance between the true density and the estimate is 0:017 while, without transforming the data the symmetrized Kullback-Leibler distance is 0:358.
0.4
100 obs. from Gamma(4)
0.0
0.1
0.2
0.3
TRUE Hspline Hspline(T)
0
2
4
6
8
10
12
data
Figure 2.1: Comparison of True density (solid line), H-splines estimate using original data (dotted line) and H-splines estimate using transformed data (dashed line) In the general case, simulations were performed in order to nd approximately the number of basis functions that the algorithm needs to start computing a density estimate. This empirical study includes the following unimodal distributions: gamma with shape parameters 1, 2, 3 and 4, normal with means 0, 3, 5, 7 and variance 11
1, normal with means 30 and 50, 80 and variances 5, 10, 20. In the situation of multimodality we used mixtures of normal distributions, except in the case when the underlying density has 8 modes. A typical example of such a density can be seen in Figure 4.4 , although the number of simulations for that particular type of density were smaller than the other densities mentioned before. The samples sizes in those simulations were 100, 200, 300 and 500 with a very small study involving samples with 50 and 80 data points. Given a sample with n observations, we noticed that for single mode symmetric distributions, the symmetrized Kullback-Leibler distance between the true density and the estimates based on log n or more were approximately 1% and estimates based on more than 3+log n basis functions could not be distinguished visually. Similar conclusions were obtained for the other densities included in this study. However, the number of basis functions required for densities other than the
p
those with a single mode and symmetric is approximately n. Since the algorithm increases the number of basis functions by one, we decided to start the algorithm with fewer knots than the ones indicated by simulations. Based on this empirical study, we suggest the following table for the initial number of knots when n � 300. For larger values of n the algorithm initiates with log n knots.
12
Table 2.1. Initial number of knots. no. of modes Other criteria no. of knots 1
symmetric
1
asymmetric
2 or 3
-
>4
-
log(n) ? 1
pn ? 4
pn ? 4 pn ? 2
Figure 2.2 exhibits the curves of the true density and the estimates based on 5, 7 and 15 knots. Note that there is considerable di�erence between estimates with 5 and 7 knots but this di�erence is relatively small between 7 and 15 knots, and so it seems reasonable to choose initial number of knots as 5 to start computing the estimates. We notice that, if the number of knots K is too small the algorithm will need more basis functions to catch the structure of the data and comparing the distance between density estimates with K and K + 1 it could stop too early because both curves are too alike but not good estimates.
13
0.5 0.0
0.1
0.2
0.3
0.4
TRUE 5 knots 7 knots 15 knots
2
4
6
8
data
Figure 2.2: Density N(5,1) and 3 estimates for number of knots=5, 7 and 15 It is well known that knots placement plays an important role to get good density estimates. (Kooperberg and Stone, 1991) designed a knot placement where knots are placed on the order statistics with xed knots on X(1) and X(n) . This attempt was tried but simulations show that equally spaced design for H-splines is much faster and performs equally better. Except on pathological cases with outliers, not equally space knots placement is more appropriate.
14
3 Finding the optimal smoothing parameter and the number of knots. In this section we describe the algorithm to compute Hybrid splines which is going to be called H-splines. The algorithm provides a fully automatic procedure to estimate a density based on K < n basis functions. Given the data X1; : : : ; Xn, the procedure starts with a initial number of knots and places them equally spaced in the range of the observations. To compute an estimate it xes a smoothing parameter �0 large and computes an iterate g~�0 by solving the Newton updating equation (1.5). Now, instead of computing the next iteration using the same �0 , the algorithm searches for �i that minimizes a proxy of symmetrized Kullback-Leibler distance L^ �i . Then it iterates the Newton updating equation (1.5) using g~�i . The algorithm repeats previous steps until it attains convergence. When convergence is achieved we obtain a density estimate
f^K based on K knots. Now, the algorithm computes an estimate f^K +1 based on K + 1 knots and evaluates the symmetrized Kullback-Leibler distance between f^K and f^K +1. If the computed distance is greater than a prespeci ed number �, then it increases the number of knots by 1 and starts the procedure again. Otherwise the procedure stops and provides an estimate based on K + 1 knots. Similar simulations as mentioned before but with a small number of replications (100) were performed. The symmetrized Kullback-Leibler distance between density estimates based on K and K + 1, for K = 5; : : : ; 35 were computed. The plot of 15
medians showed that the symmetrized Kullback-Leibler distances between densities become approximately constant when the number of knots is greater than Kf , where
Kf depends on the the structure (curvature, modes) of the underlying density f . In general, this empirical study showed that Kf is greater than K + 2. Similar evidence was found when measuring the symmetrized Kullback-Leibler distance between the true density and the estimates. However, the number of replications in this study was small, suggesting some caution in interpretation. Moreover, based on these simulations the di�erence among estimates whose distance does not exceed .05 seem not to be distinguished by eyeball.
4 Numerical Simulations In this section we present various examples of the performance of Hybrid Splines. Since the examples deals with density estimation in the one dimensional case, the SSDE (smoothing splines density estimation (Gu, 1993)) is not going to be considered because Gu's algorithm is of order of O(n3) while logspline is of order of O(n). One of the goals of H-splines method is to provide a code that it will be possible to extend to the multivariate case keeping the same speed of logspline. Logspline and SSDE are state of art codes and any new code should have a performance comparable to them. The data sets were obtained by simulations either by using RATFOR programs based on algorithms found in (Kennedy, Jr and Gentle, 1980) or by making use of S-language (Becker, Chambers and Wilks, 1988) routines. 16
0.3
0.4
200 obs. from .8*N(3,1)+.2*N(12,1)
0.0
0.1
0.2
True Logspline Hspline
0
2
4
6
8
10
12
14
data
Figure 4.1: True density, Logspline and Hybrid Spline methods are compared Figure 4.1 show us that even under obvious case when two normal distributions with di�erent means are combined, Hybrid Spline method has a very satisfactory performance. In Figure 4.2, we can see that H-splines produces a good estimate of the density. Also we notice that in the tails Logspline with deletion procedure provides a more precise estimate than H-splines. Comparing Hybrid Spline method with Logspline using deletion procedure we 17
0.5
200 obs. from Gamma(2)
0.0
0.1
0.2
0.3
0.4
TRUE Logpsline(d) Hspline
0
1
2
3
4
5
data
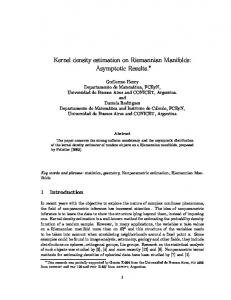
Figure 4.2: True density of Gamma(2), estimates given by Logspline, Hybrid Splines see in Figure 4.3 that Hybrid Spline does a better job identifying peaks and valleys of the underlying density. Deletion procedure of Logspline allows it to have the position of the knots that is more signi cant for the tting and hence provides the best estimate that Logspline method can produce. Note that logspline adapts using deletion procedure while H-spline adapts using addition. Figure 4.4 shows that the kernel method produces the best and fastest estimate of the underlying density. The bandwidth was chosen by eyeball and since that 18
300 obs. from .4*N(4,1)+.3*N(8,1)+.3*N(11,1)
0.0
0.05
0.10
0.15
TRUE Logspline(d) Hspline
2
4
6
8
10
12
14
data
Figure 4.3: True density, Logspline and Hybrid Spline estimates one might have a prior information about the true density, this choice can be well accepted. We notice that Hybrid Spline, again, has a superior performance over the other methods when identifying 5 of the 6 peaks and 6 out of 7 valleys. Hybrid spline has shown in simulations that it is suitable in situation where the data have a lot of structure. In gure 4.5 we have the age in years of 256 patients under treatment for diabetes. Comparing Hybrid spline and Logspline with deletion procedure, we see that the density estimate obtained by Hybrid spline is able to detect the same number of modes that the histogram indicates while Logspline estimate seems not to detect the 19
1.5
300 obs.(1/2.804592)*(sin(x*2*pi)+exp(-x))**2
0.0
0.5
1.0
TRUE Logspline H-spline Kernel
0
1
2
3
4
data
Figure 4.4: True density and estimates given by Logspline, Hybrid spline and kernel methods second bump. Also, as histogram shows, there is some evidence of another bump between 9 and 15 years which was not detect, in this data set, by Logspline estimate. Since we don't know the true density of this data we cannot tell for sure which of those estimates is more appropriate to reproduce the underlying density but it seems that the histogram and Hybrid spline provide very similar estimates although the number of intervals of the histogram given here is not the default of most of the 20
0.06 0.0
0.02
0.04
Logspline(d) Hspline
10
20
30
40
50
data
Figure 4.5: Age in years of 256 patients in diabetes study softwares available. Under the default the histogram would have 7 intervals and hence it wouldn't be able to identify the second mode. That is, asking for more details, the histogram gives an estimate where one could see the ne structure of this data set. Such requirement, increasing the number of intervals, is not necessary if ones uses Hybrid spline procedure.
21
5 Conclusion Comparing H-spline, Logspline and SSDE one may observe that H-spline yields good estimates when the data have more complicated structure, such as several modes, or when the observations come from a gamma family of distributions. However, this empirical study performed simulations using a restricted range of shape parameters of gamma densities. For symmetric densities, H-spline performs as well as Logspline and SSDE, but it is faster than SSDE. However, in some cases H-splines obtains a smoother density estimate. Comparing performance, Logspline is superior in terms of speed or computational cost because it assumes that a density can be written as linear combinations of the basis functions (B-splines) and estimates the coe�cients of this linear combination by Maximum Likelihood Method (a parametric procedure), while H-spline and SSDE minimize a penalized loglikelihood equation in such way that the optimal smoothing parameter and \optimal" density estimate are iteratively computed based on a loss function which is the symmetrized Kulback-Leibler distance. Smoothing of the Logspline estimate involves the choice of the numbers and the locations of knots in adaptive manner (fewer knots, smoother curve). The initial number of knots is determined from a table according to the number of observations, based on the experience of Kooperberg and Stone (1991). When the number and placement of knots of Logspline and H-spline approaches are the same, H-spline produces smoother estimates. An explanation for this situation would be that Hspline controls the trade-o� between goodness-of- t and smoothness. Consequently, 22
H-spline appears to be useful for estimating densities with more complicated structure. Density estimation is not recommended for small samples and hence H-spline approach should be used for large samples (> 80).
Acknowledgements: This work is part of the author's Ph.D. thesis and was nancially supported by CAPES, grant no. 10405/88. The author would like to thank Prof. Grace Wahba for her advice and help during his Ph.D. He is also grateful to Prof. Brian Yandell for useful discussions and Prof. C. Kooperberg for kindly sending data sets to test this algorithm.
References Becker, R. A., Chambers, J. M. and Wilks, A. R. (1988). The New S Language: A Programming Environment for Data Analysis and Graphics, Wadsworth Pub-
lishing Co (Belmont CA). Cherno�, H., Gastwirth, J. L. and Jones, M. V. (1967). Asymptotic distribution of linear combinations of function of order statistics with applications to estimation, Ann. of Mathematical Stat. 38: 52{72.
Cox, D. D. and O'Sullivan, F. (1990). Asymptotic analysis of penalized likelihood and related estimators, Ann. of Statistics 18: 1676{1695. de Boor, C. (1978). A Practical Guide to Splines, Springer Verlag, New York.
23
Good, I. J. and Gaskins, R. A. (1971). Nonparametric roughness penalties for probability densities, Biometrika 58: 255{277. Gu, C. (1993). Smoothing spline density estimation: A dimensionless automatic algorithm, J. of the Amer. Stat'l. Assn. 88: 495{504. Gu, C., Bates, D. M., Chen, Z. and Wahba, G. (1989). The computation of generalized cross-validation functions through Householder tridiagonalization with applications to the tting of interaction spline models, SIAM J. on Matrix Analysis and Application 10: 457{480.
Hinkley, D. V. (1975). On power transformations to symmetry (corr: V63 p218), Biometrika 62: 101{112.
Hinkley, D. V. (1977). On quick choice of power transformations, Applied Statistics
26: 67{68. Kennedy, W. J., Jr and Gentle, J. E. (1980). Statistical Computing, Dekker:NY. Kooperberg, C. and Stone, C. J. (1991). A study of logspline density estimation, Computational Stat. and Data Analysis 12: 327{347.
Leonard, T. (1978). Density estimation, stochastic processes and prior information, JRSS-B, Methodological 40: 113{146.
O'Sullivan, F. (1990). An iterative approach to two-dimensional Laplacian smoothing with application to image restoration, J. of the Amer. Stat'l. Assn. 85: 213{219. 24
Scott, D. W. (1992). Multivariate Density Estimation. Theory, Practice, and Visualization, John Wiley Sons (New York, Chichester).
Silverman, B. W. (1981). Using kernel density estimates to investigate multimodality, JRSS-B, Methodological 43: 97{99.
Silverman, B. W. (1984). Spline smoothing: The equivalent variable kernel method, Ann. of Statistics 12: 898{916.
Wahba, G. (1971). On the regression design problem of Sacks and Ylvisaker, Ann. of Mathematical Stat. 42: 1035{1053.
Wahba, G. (1975a). Interpolating spline methods for density estimation. I: Equispaced knots, Ann. of Statistics 3: 30{48. Wahba, G. (1975b). Optimal convergence properties of variable knot, kernel, and orthogonal series methods for density estimation, Ann. of Statistics 3: 15{29. Wahba, G. (1977). Optimal smoothing of density estimates, Classi cation and Clustering pp. 423{458.
Wahba, G. (1981). Data-based optimal smoothing of orthogonal series density estimates, Ann. of Statistics 9: 146{156. Wahba, G. (1990). Spline Models for Observational Data, SIAM:PA.
25