VOL. 8, NO. 11, NOVEMBER 2013
ISSN 1819-6608
ARPN Journal of Engineering and Applied Sciences ©2006-2013 Asian Research Publishing Network (ARPN). All rights reserved.
www.arpnjournals.com
DESIGN AND DEVELOPMENT OF A PC-BASED AUTOMATED DATA LOGGING SYSTEM FOR MEASURING TEMPERATURE Md. Abdullah Al Mamun1, Kenneth Sundaraj2, N. Ahmed3, Matiur Rahman4, Mijanur Rahman3 and Nizam Uddin Ahamed2 1 Electronics Division, Atomic Energy Centre, Dhaka, Bangladesh AI-Rehab Research Group, Universiti Malaysia Perlis, Kampus Pauh Putra, Arau, Perlis, Malaysia 3 School of Computer and Communication Engineering, Universiti Malaysia Perlis, Malaysia 4 College of Computer Science and Information System, Najran University, Kingdom of Saudi Arabia E-Mail:
[email protected] 2
ABSTRACT Currently, accurate information of the temperature over time is required in medical, scientific, and various industrial applications. The objective of this work was to design and develop a fully automated microcontroller-based data logging system to measure the temperature in a working environment. The system consists of a temperature sensor (LM35), a data logger with a memory card, and a high-performance low-power AVR 8-bit microcontroller (ATMega-8). The system consisted of LCD monitoring device and a computer terminal for storing and displaying the data. A simple and user friendly graphical user interface (GUI) was developed using the LabVIEW software package and connected with the data acquisition system. This inexpensive real-time system was preliminary tested in a room, and the data were obtained from the LCD display without any problems. In addition, it was verified that the data were sequentially stored in the memory. The observed data are comparable with data measured using a conventional mercury thermometer. The developed system can be used in many areas, including personal bedrooms, industrial settings (particularly dairy, fuel, and agricultural), shipping containers, medical applications, and any place where the temperature needs to be recorded and monitored. In conclusion, the developed system is easy to use, requires no additional hardware, and permits the selection of the amount of data and the time intervals between the data recordings. In addition, the collected data can easily be transferred to a computer via a connected serial port. Keywords: temperature data logger, sensor, LM35, microcontroller, LabVIEW.
1. INTRODUCTION A data logger is arranged to obtain intensity and temperature signals and to transmit coded control commands to a logging rate and direction control circuit, which in turn activates a motor control circuit to provide direction [1]. Moreover, a data logger is an electronic instrument that can record digital or analogue measurements over a period of time. It consists of a sensor, a microcontroller, and a data storage device. A temperature data logger, which is also called temperature monitoring system, is able to record the temperature autonomously over a distinct period of time and has multifarious applications in the any workplace [2, 3]. Therefore, the rapid evolution of temperature data logging systems over the last two decades have resulted in the development of many data acquisition systems in the electronics field. However, because the cost of these systems is still high, the simulation of their design is desirable [4]. One of the primary benefits of using this type of system is the ability to automatically record data on a 24-hour basis. A typical data-logging scenario is shown in Figure-1.
Figure-1. Block diagram of a typical data logger. In Figure-1, the first step is the “Acquire” process, which includes sensors and data logger hardware, for the conversion of physical phenomena into digital signals. The “Online analysis” step includes any analysis that is likely to be performed before data storage. The “Log” refers to the storage of the analysed data and includes any formatting required for the data files. The “Offline Analysis” includes any analysis that is to be performed after storing the data. The “Displaying” step includes the creation of any reports that are needed to present and display the data. To date, many temperature data logging and data acquisition systems have been developed to collect and process this type of data and to monitor the temperature in a workplace. For example, Dandekar et al., developed a system to measure and store the temperature using a sensor-resistance temperature detector (RTD), a thermocouple sensor, and a GUI developed in the C++ programming language [5]. Another stand-alone data logger system was developed by Žorić et al., who used
960
VOL. 8, NO. 11, NOVEMBER 2013
ISSN 1819-6608
ARPN Journal of Engineering and Applied Sciences ©2006-2013 Asian Research Publishing Network (ARPN). All rights reserved.
www.arpnjournals.com different sensors to store data in a PC [6]. The robust and cost-effective system developed by Ferlan et al., can measure and log data associated with a soil temperature profile [7]. Similarly, other wireless and wired DAQ systems have been developed by various researchers, who used different types of sensors, microcontroller chips, and programming languages to ultimately design temperature logging systems that can be used in a large environment [8-11]. These previous studies indicate that is still a need to develop a noble data logging system to monitor the temperature that is able to show and store the data over a period of 24 hours, is user friendly, can utilise both a desktop and a tablet computer, is inexpensive, and is capable of other end-user facilities. Therefore, this study designed and developed a system that extends the previous works with respect to the exploration of an effective way to utilise a large workstation capacity. To fulfil this engineering aspect, a computerbased wired data acquisition system to monitor temperature data is proposed in this work. The following electronics components were used to measure and store the data: a temperature sensor (LM35), an operational amplifier (LM324N), a microcontroller chip (ATMega8L), a liquid crystal display (LCD-QY-1602A), a level converter IC-MAX232, and a USB-to-Serial RS232 Adapter. The signals from the sensor are first filtered and amplified using a suitable electronic circuit and are then interfaced to a PC through the PCI bus with a transmission unit. The recorded data are further processed, viewed on the computer monitor, and stored in the storage device using the LabVIEW software package. This new technique
has the benefits of rapid data acquisition system development and presents a comprehensible graphical environment that allows the system operators to effortlessly process the collected data. 2. DESIGN AND IMPLEMENTATION The different types of hardware and software methodologies that were used to develop the system are presented bellow. 2.1. System design The entire system was designed to receive data from a temperature sensor (LM35). The amplified signal is then sampled and quantified in ADC and used for the estimation of temperature data using a ATMega8L microcontroller [12]. This ATMega8L microcontroller (Atmel, San Jose, CA, USA) is an 8-bit microcontroller with flash memory and low power consumption that is appropriate for this application system. This microcontroller unit captures the temperature data and converts the data into digitised form in a suitable temperature data format. The microcontroller also sends the temperature data to the PC through a serial communication. An integrated Liquid Crystal Display (LCD) device was used to display the real-time temperature. The application software was developed using LabVIEW to display the real-time temperature on the computer monitor and to store the data on the computer’s memory for post-process analysis. Figure-2 depicts a block diagram of the temperature data logging system.
Figure-2. Block diagram of the temperature data logging system. 2.2. Schematic design After accumulating all of the components, the hardware circuit was connected with the Proteus ISIS 7 Professional software according to the schematic diagram shown in Figure-3. All of the circuits from the development board to the prototype circuit were designed in this system using the Proteus 7 professional software,
which is an extremely powerful software because the user can simulate the circuit and is able to easily analyse the consequences [13]. Moreover, this software includes the selection and description of the components and the details of the hardware of the designed system.
961
VOL. 8, NO. 11, NOVEMBER 2013
ISSN 1819-6608
ARPN Journal of Engineering and Applied Sciences ©2006-2013 Asian Research Publishing Network (ARPN). All rights reserved.
www.arpnjournals.com
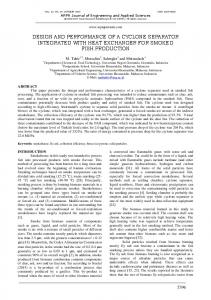
Figure-3. Schematic of the hardware. 2.3. PCB design and fabrication The PCB (Printed Circuit Board) was designed on a circuit board to attach all of the hardware devices in the system. One valuable characteristic of this PCB technology is its capability to fabricate electrically conductive pathways on both sides of the substrate. These double-sided PCBs allow electrically conductive wires to pass over and under other wires and thus allow increased independence in the placement of the electronic apparatuses [14]. The entire step-by-step processes used to make the PCB are the following. In step-1, which is the initial stage, the PCB circuit was designed using the ARES7 professional software. The printed mirror was then constructed on a sticky paper on the back side of the PCB.
In step-2, the printed paper was placed on a copper board and hit with an electronic iron to ensure that the designed system is able to trace on the copper board. In step-3, the board is ready to be etched using the warm ferric chloride solution, and, in step-4, which is the final stage in the fabrication process, holes are drilled in the finished board such that the hardware components can be easily placed on the board. These electronic hardware components are the temperature sensor (LM35), the operational amplifier (LM324N), the microcontroller chip (ATMega8L), the liquid crystal display (LCD-QY-1602A), the level converter IC-MAX232, and the USB-to-serial RS232 adapter. Figure-4 illustrates the side and top views of the test printed circuit board.
962
VOL. 8, NO. 11, NOVEMBER 2013
ISSN 1819-6608
ARPN Journal of Engineering and Applied Sciences ©2006-2013 Asian Research Publishing Network (ARPN). All rights reserved.
www.arpnjournals.com
(a)
(b)
Figure-4. A schematic image of the printed circuit board, here a) bottom portion and b) top portion of the PCB. 2.4. Software development Software design includes the development of the algorithm for the system, the writing of the separate routines for the different interfacing devices, and the test of the routines on the designed hardware. The interface between the microcontroller with the ADC, LCD, and PC was achieved using software modules. The program for the microcontroller was written in BASCOM-AVR, which
is the original Windows BASIC COMPILER for the AVR family and provides a simulator, a programmer, and other useful resources (http://www.mcselect.com/) [15]. From BASCOM-AVR to the program source code, the entire process was divided into three main steps: the BASCOMAVR was first run, the new program file was then created, and the new file was saved as *.filename. The flowchart of the control program is shown in Figure-5.
963
VOL. 8, NO. 11, NOVEMBER 2013
ISSN 1819-6608
ARPN Journal of Engineering and Applied Sciences ©2006-2013 Asian Research Publishing Network (ARPN). All rights reserved.
www.arpnjournals.com
Figugre-5. Flow chart of the control program. On the host side, a controlled graphical user interface application software was developed using a suitable language, such as the LabVIEW™ software developed by National Instruments Corporation, which provides a very flexible platform for data acquisition, data processing, instrument control, industrial automation, and other end-user applications [16]. Moreover, this is a dataflow- and graphics-based language and is appropriate for the design of a man-machine interface [17]. Figure-6 shows the block diagram that contains the graphical source code of a LabVIEW program, and Figure-7 illustrates the front panel window used as the user interface for the virtual instrument (VI). In this overall system, LabVIEW interacts with the end-users in two different forms: (1) block diagrams, which are where the control function and the data flow are designed, and (2) front panel, in which
the buttons, counters, data, and graphs are displayed and accessed through direct cursor manual control. The front panel has controls and indicators, which are the interactive input and output terminals, respectively, of the VI. The concept of the block diagram is to separate the graphical source code from the user interface in a logical and simple manner. The front panel objects appear as terminals on the block diagram. The terminals on the block diagram reflect the changes made to their corresponding front panel objects and vice versa. A group of command buttons were added to the front panel for user access, such as the stop and serial port number. The software design in the developed system includes high functionality, a user interface, upgradability, power consumption, security, reliability, and system costs.
964
VOL. 8, NO. 11, NOVEMBER 2013
ISSN 1819-6608
ARPN Journal of Engineering and Applied Sciences ©2006-2013 Asian Research Publishing Network (ARPN). All rights reserved.
www.arpnjournals.com
Figure-6. Block diagram of the proposed VI for temperature data logging.
Figure-7. Front panel of the temperature data logging monitoring software for end users. The temperature in shown in Celsius (plot and numeric value) with the current date and time. 3. EXPERIMENTAL RESULTS The developed DAQ system is now ready for use. Therefore, some experiments were conducted to ensure that the proposed system can be used in a real environment and can be distributed commercially. First, the developed
system was maintained in a large room for measurement purposes and was able to easily store the data as a log file on the PC memory through the USB-to-serial RS232 adapter interface and to be accessed by the developed LabVIEW VI. The GUI consists of multiple accessible buttons for the end user. When the user clicks the “ON” button, the system started to show the temperature in degrees Celsius inside a label box (right corner of the GUI, see Figure-7), displayed the current date and time, plotted the real-time temperature on the box, and indicates increases/decreases in the temperature through movement in the red signal on the thermometer icon. The complete dataset is then recorded on the Notepad application in Windows. The system will stop running when the “STOP” button is pressed. It is obvious that the device can successfully read the temperature in the room at 30-sec intervals and save the data in the memory. During these tests, a commercially available conventional household thermometer (Model RBT033, Zhejiang China) was placed in a corner of the room to record the data such that we could later compare these data with the developed system data. Table-1 illustrates the results from both the system and the thermometer. As shown, both measurements yielded almost identical temperature readings. Very marginal differences were observed between both systems. Figure-8 shows the temperature data that were saved in Notepad as text format.
965
VOL. 8, NO. 11, NOVEMBER 2013
ISSN 1819-6608
ARPN Journal of Engineering and Applied Sciences ©2006-2013 Asian Research Publishing Network (ARPN). All rights reserved.
www.arpnjournals.com Table-1. A comparison of the results from both systems.
RS232 serial interface connect the computer with microcontroller. The proposed system was successfully tested and compared with a commercially available conventional household thermometer. Figure-9 shows the small differences in the form and values between the curves (raw temperature data) obtained from the two types of instruments.
Figure-9. Line graph comparing the temperature data between the two systems. In conclusion, the developed system exhibits the following advantages: a)
Figure-8. Temperature data from the developed system saved in a WindowsTM application (Notepad). 4. DISCUSSIONS The main aim of this research is to design and develop a robust and cost-effective system for measuring and logging temperature data that is able to read the analogue signals from temperature sensors (LM35). The system should then convert the analogue signals obtained from the board into digitised form as real-time signals. Additionally, the system should store the signals on the chip memory of a microcontroller for further processing. This can be accomplished using a real-time clock and voltage converter to transmit these data to the computer through a serial port. A LabVIEW-based GUI is then run on the computer, and this GUI can request the temperature on a periodic basis and can store the different values as a function of time in the computer. This requires that the
Our data logging system can be used in a wide range of applications, e.g., in remote monitoring, medical areas, industrial processes, manufacturing industries, pharmaceutical manufacturing and storage, and geological and environmental monitoring. b) Using the LABVIEW software, the DAQ card is run by a customised and appropriately developed interface that e used in any type of computer (i.e., desktop, tablet, and hand-held). It mainly consists of two principal parts: (1) a graphical setting with sophisticated mechanisms, such as a variety of display buttons and charts to present a suitable-to-use environment for the end user, and (2) a simple program code, which is written in the block-diagram design, consists of built-in virtual instruments, and performs various operations, such as analogue channel sampling, mathematical functions, and other important features. c) This data acquisition system is generally used for central monitoring. d) The proposed data acquisition system has no limits on time and memory. In addition, it uses a large power capacity, which is the key aim of this type of monitoring and recording system. e) This microcontroller was chosen mainly because of its low power consumption. f) The specifications of the developed DAQ system are provided in Table-2.
966
VOL. 8, NO. 11, NOVEMBER 2013
ISSN 1819-6608
ARPN Journal of Engineering and Applied Sciences ©2006-2013 Asian Research Publishing Network (ARPN). All rights reserved.
www.arpnjournals.com Table-1. Specification of the acquisition system. Specifications
Results
Number of channels
1 (one)
Resolution
Power supply
10 bits Digital serial based on UART +5V
Input current (maximum)
30 mA (for the module)
Interface
Maximum cable length
1M
Input amplitude range
0-100mV
Sampling rate
9.6 kHz
Power consumption
200 mW (typical)
UART: Universal Asynchronous Receiver / Transmitter 5. CONCLUSIONS Various types of microcontroller-based data acquisition systems are currently extensively and commonly used in temperature recording applications. Moreover, these systems are used to facilitate the data recording process with respect to the installed system performance and the assessment functions. In this paper, the design and development of a computer-based data logging system for the monitoring of temperature data over a long period of time is described. The proposed system consists of a sensor for measuring the meteorological parameter, which is the temperature of a workplace. The recorded data are initially conditioned using exact electronic circuits and then connected to a PC using a data-acquisition serial port. The LabVIEW program was used for further processing to display and to store the recorded data in the computer storage memory. The proposed architecture of the system permits rapid system development and has the advantages of flexibility in the case of modifications, i.e., it can be easily extended to controlling the temperature data logging system operations. The performance of the microcontroller-based temperature data logger is within the expected limits. However, further improvements in its speed, number of channels, power consumption, and PC interface software for post data analysis can still be achieved. REFERENCES [1] G. L. Stegemeier, P. Van Meurs and C. F. Van Egmond. 1986. Mini-well temperature profiling process. Ed. Google Patents. [2] F. Axisa, A. Dittmar and G. Delhomme. 2003. Smart clothes for the monitoring in real time and conditions of physiological, emotional and sensorial reactions of human. In: Engineering in Medicine and Biology Society, 2003. Proceedings of the 25th Annual International Conference of the IEEE. pp. 3744-3747.
[3] J. Sarabia, M. Rol, P. Mendiola and J. Madrid. 2008. Circadian rhythm of wrist temperature in normalliving subjects: A candidate of new index of the circadian system. Physiology and behaviour. 95: 570580. [4] J. Hubbart, T. Link, C. Campbell and D. Cobos. 2005. Evaluation of a low cost temperature measurement system for environmental applications. Hydrological Processes. 19: 1517-1523. [5] P. R. Dandekar, S. V. Gumaste and P. D. Dahiwale. 2010. Temperature controlling and data logging using embedded system. Presented at the Proceedings of the International Conference and Workshop on Emerging Trends in Technology, Mumbai, Maharashtra, India. [6] A. Žorić, B. Đorđević, D. Martinović and S. Obradović. 2005. Stand-alone temperature data logging system. Tehnika-Elektrotehnika. 54: 9-14. [7] M. Ferlan and P. Simončič. 2012. Robust and costeffective system for measuring and logging of data on soil water content and soil temperature profile. Agricultural Sciences. 3: 865-870. [8] M. Darr and L. Zhao. 2008. A wireless data acquisition system for monitoring temperature variations in swine barns. In: Central theme, technology for all: sharing the knowledge for development. Proceedings of the International Conference of Agricultural Engineering, 37th Brazilian Congress of Agricultural Engineering, International Livestock Environment Symposium-ILES VIII, Iguassu Falls City, Brazil, 31st August to 4th September. [9] Y.-j. FANG, F. XUE and M.-c. CHEN. 2005. Design of new thermocouple temperature data acquisition system [J]. Journal of Transducer Technology. 11: 16. [10] M. Moghavvemi, M. Faruque, N. K. Eng and S. C. Yip. 2001. A simple low cost data acquisition system for remote sensing of relative humidity and temperature. In: Circuits and Systems, 2001. MWSCAS 2001. Proceedings of the 44th IEEE 2001 Midwest Symposium on. pp. 202-206. [11] X. Yan, G. Tao, Z. Jie and C. Wei. 2011. Based on single-chip microcomputer temperature and humidity data acquisition system design. In: Electronics and Optoelectronics (ICEOE), 2011 International Conference on. pp. V2-310-V2-313. [12] A.L. Microcontroller. www.atmel.comlatmel/acrobatldoc2486.pdf. [13] S. bin Ramli and N. bt Fisal. 2008. Design of Wireless Sensor Network for Environmental Monitoring
967
VOL. 8, NO. 11, NOVEMBER 2013
ISSN 1819-6608
ARPN Journal of Engineering and Applied Sciences ©2006-2013 Asian Research Publishing Network (ARPN). All rights reserved.
www.arpnjournals.com (WiSNEM). Universiti Teknologi Malaysia: Bachelor Degree Thesis. [14] C. Siegel, S. T. Phillips, M. D. Dickey, N. Lu, Z. Suo and G. M. Whitesides. 2010. Foldable printed circuit boards on paper substrates. Advanced Functional Materials. 20: 28-35. [15] S. Besoiu, V. Mătieş and S. D. Stan. 2008. Mechatronic Design of the 2 DOF PRRRP Parallel Robot. PAMM. 8: 10879-10880. [16] N. I. C. Home-page. 2013. http://www.ni.com. (Accessed on June 2.). [17] T. Jen-Hao, C. Shun-Yu, L. Jin-Chang and R. Lee. 2000. A LabVIEW based virtual instrument for power analyzers. In: Power Con 2000 International Conference on Power System Technology.1: 179-184.
968