Detecting Topic Drift with Compound Topic Models Dan Knights and Michael C. Mozer
Nicolas Nicolov
Computer Science University of Colorado at Boulder Boulder, CO 80309 {daniel.knights, mozer}@colorado.edu
J.D. Power and Associates, McGraw-Hill, U.S.A. 4888 Pearl East Circle Boulder, CO 80301 USA nicolas
[email protected]
Abstract The Latent Dirichlet Allocation topic model of Blei, Ng, & Jordan (2003) is well-established as an effective approach to recovering meaningful topics of conversation from a set of documents. However, a useful analysis of user-generated content is concerned not only with the recovery of topics from a static data set, but with the evolution of topics over time. We employ a compound topic model (CTM) to track topics across two distinct data sets (i.e. past and present) and to visualize trends in topics over time; we evaluate several metrics for detecting a change in the distribution of topics within a time-window; and we illustrate how our approach discovers emerging conversation topics related to current events in real data sets.
Introduction Our goal is to detect online when certain conversation topics have emerged or subsided in a document stream, based on the analysis of a scrolling window containing current and past user-generated content. This approach could be used to extract new kinds of marketing intelligence such as, for example, the emergence of a new conversation topic related to a product. Given a stream of documents ordered in time, we want to know whether the topics discussed most recently, say in the past month, are different than topics discussed further in the past, say in the K − 1 preceding months. We train a topic model on the most recent K months of data, but call the resulting model a compound topic model (CTM) because it integrates topics across the two blocks of time. Using this model, we examine three potential indicators (described later) for measuring the degree of topic drift across blocks, and then graph historical trends of the topics that vary most over the window. We evaluate our approach on synthetic data and on two sets of real weblog posts related to “Toyota” and the “iPhone”. Throughout the paper we use K = 4, although other values of K will detect different temporal granularities of topic drift. c 2009, Association for the Advancement of Artificial Copyright Intelligence (www.aaai.org). All rights reserved.
Related Work Much related work has been done in leveraging aspects of blogs and reviews specifically to extract marketing information, for example in (Titov and McDonald 2008b; 2008a; S.R.K. Branavan and Barzilay 2008; Nallapati and Cohen 2008). Numerous prior approaches explicitly model the emergence of topics over time (Kleinberg 2002; Yi 2005; Allan 2002) or within a document (Barzilay and Lee 2004). The Topics Over Time model of Wang and McCallum (2006) models temporal topic drift as a Markov process. In contrast, our approach makes no assumptions about the nature of the topic drift. Space constraints preclude a full discussion of prior work. We also use the CTM to provide a visualization of the temporal trends of topics. Glance et al. (2004) is an influential early work in social media analysis that describes plotting topic frequency on a temporal axis. Fisher et al. (2008) present a multi-featured system for visualizing temporal trends related to a specific news story. These approaches use key-phrase extraction instead of topic models.
Compound Topic Models We employ a functional approach to tracking topics in which we combine past and present data and extract a single compound topic model (CTM). Given any two distinct data sets, D and D0 , whose generative topic distributions TD and 0 TD we wish to compare, we simply extract a topic model Tˆ = TD∪D0 for the union of the two data sets. We can then compare many aspects of the two data sets under the CTM Tˆ. For example, if we have a complete vector of topic assignments for all tokens in the combined corpus, we can use temporal meta-data from our document stream to track the frequency of topics over time. If we are interested in visualizing only emerging or subsiding topics, we can first rank topics by their frequency range (maximum frequency less minimum frequency) or extract topics of interest by hand. In this research we use the collapsed Gibbs Sampling method proposed by Griffiths and Steyvers (2004) to obtain our topic models. The CTM is convenient for several reasons. First, it makes no generative distinction between a change in the overall topic distribution and the emergence of a completely new topic. Second, it handles gracefully the introduction of new
Our main criterion in choosing indicators is that they provide an absolute rather than relative measure of topic drift. A relative measure would require a set of reference documents from the document stream in order to establish the baseline variation in the indicator caused by noise. We also wish to find measures that could be applied both to the past and present topic models and to a past and present unigram-based model. Our hypothesis is that real-world topic drift will always be accompanied by a significant change in the unigram distribution of words. If this is true, then we can detect topic drift with simple unigram-based indicators, and postpone extracting the more computationally intensive topic model until after we have detected a topic drift. We now describe the indicators that we examined. Relative Perplexity. A common measure of likelihood of a document under a given model is its perplexity, defined as 2−
P
1 N
log2 p(word|model)
(1)
which can be interpreted loosely as the average inverse probability of a given token in the corpus having been generated by our model. Perplexity alone is only informative relative to the entropy of the current set of documents. Since we need an absolute indicator of topic drift, we instead calculate the perplexity of the current month relative to that of the previous K − 1 months, defined as 1 − Pcurrent /Ppast . In our initial investigation we calculated relative perplexity using the CTM, but found that is was overly sensitive to noise even on synthetic data. In this paper we present only the relative unigram perplexity of the current month, using the observed unigram probabilities p(wn ) from the past (K − 1) months for p(word|model) in Formula 1. Self-normalized Kullback-Leibler divergence. The probability of a topic t given a vector z of topic assignments for the N words in a set of documents is simply the ratio of words assigned to that topic to the number of words in the set. Thus each topic distribution is a discrete probability mass function, and we can apply any number of divergence metrics or measures to compare the distribution of topics in one data set to that in another. We use the Kullback-Leibler divergence, defined as follows for discrete probability distributions P and Q: KLD (P kQ)
=
X
pi log
pi qi
max pi log (N pi )
We apply this measure to both the topic distributions (TKLD) and to the observed unigram distributions (UKLD). Other potential indicators. The Chi-square (χ2 ) test for independence is a natural choice for an indicator, but due to the large number of tokens contained in the corpus and the relatively few degrees of freedom in the model (e.g. 25 topics) the χ2 statistic itself was relatively large, and the χ2 test almost always returned a significant p-value of near zero (many false positives).
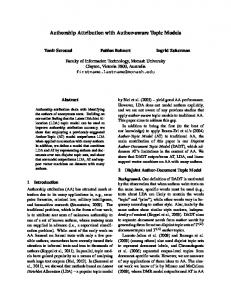
Results Synthetic Experiments. We used the LDA probabilistic model described by Blei et al. (2003) to generate 30,000 documents from 10 artificial topics, with each topic a random distribution over the same set of 1,000 symbolic vocabulary words. We synthesized a set of 100 documents for each day over a period of 300 days (we omit the details of the implementation for space considerations). For the first of two experiments we simulated a gradual drift in the topic distribution (with no individual topic emerging or subsiding) between days 150 and 180. For the second experiment we simulated the emergence of a completely new topic during the same period. In both cases we used Gibbs sampling to extract a topic model for 120-day periods starting in increments of 15 days to approximate a 4-month window evaluated every two weeks. Each data point is an average of results from three independent topic models. Our goals were to evaluate (a) whether each indicator is successful at detecting the two types of topic drift, and (b) if any indicator is more effective than the others. We present in Figure 1 the indicators values normalized to lie on the [0, 1] interval. 1
In order to make this an absolute rather than relative measure, we then normalize the Kullback-Leibler divergence by
Topics KLD Unigram KLD Unigram RP
0.8 0.6 0.4 0.2 0 120
135
150
165 180 195 210 225 240 End of 4−month window (day index)
255
270
285
135
150
165 180 195 210 225 240 End of 4−month window (day index)
255
270
285
1 0.8 0.6 0.4 0.2 0 120
(2)
(3)
i
Relative Score
Indicators of Drift
its maximum possible value given an N -word vocabulary:
Relative Score
vocabulary terms from one data set to the other. Third, a CTM can be used to compare topic distributions between any distinct data sets, not just those identified with different time periods. Lastly, a CTM can be used to track topics across multiple disjoint sets of documents.
Figure 1: Synthetic data. (Top) general topic drift days 150 to 180; (Bottom) a single topic emerges days 150 to 180
Given that the simulated topic drift occurs between days 150 and 180, we see in Figure 1 that all indicators detect both types of drift exactly when expected. In the second experiment (emergence of a completely new topic), TKLD lags slightly behind and detects some noise between days 210 and 240. The smoothing parameters used in the Gibbs sampling may effect the amount of lag in TKLD, but we have not tested this hypothesis. In our synthetic experiments, the UKLD shows a much larger change in its absolute value (non-normalized values not shown), suggesting that true topic drift may stand out from noise more clearly with UKLD than with the other indicators, although in the subsequent real-data experiments the three indicators have comparable variation in their absolute value. Real data. We evaluate our approach on two real data sets consisting of actual weblog posts, the first mentioning “Toyota” (01/2008–06/2008), and the second mentioning “iPhone” and “platform” (04/2007–03/2008). If our topic drift detection is successful, then we expect to be able to identify topic trends in this real data that reflect coincident product releases or news events. These data are taken from publicly available blog posts, and although we did not filter spam, in practical application we would employ weblogspecific spam analysis (Nicolov and Salvetti 2007). For both data sets we ran Gibbs Sampling on the fourmonth time period beginning on the 1st and 16th day of each month. In each case we chose to use 25 topics, a more or less arbitrary decision [(Griffiths and Steyvers 2004) describes inference of the number of topics].
Unigram RP
0 05/2008
Top 4 words
0.031
gas, hybrid, fuel, prius, vehicles
13
0.018
sales, company, million, market, united
21
0.017
said, police, family, chapman, land
8
0.015
center, tour, park, amphitheatre, tickets
Table 1: Most variable topics for the June 2008 Toyota data
Figure 3: (Top) Toyota topic trends, Mar.–Jun. 2008; (Bottom) cost of gasoline over 12 months (Energy Information Administration 2008)
Unnormalized 1
06/2008 End of 4−month window (day index)
07/2008
Figure 2: Topic drift indicators for Toyota data Toyota. Figure 2 gives the results of the “Toyota” experiment. The unigram- and topics-based divergence measures (UKLD and TKLD) exhibit generally similar behavior, while URP tends to conflict with them. The unigram-based UKLD and topic-based TKLD both reach a global maximumtimewindow ending on June 15, 2008. We perform further analysis on that window by ranking the topics according to their range in frequency (as described above), and give the five most frequent words in the four most variable topics in Table 1. We include the topic indices to facilitate discussion. Figure 3 shows in black the four topics with the largest change in frequency over the period. Topic 4, which appears to reflect a discussion of energy conservation, nearly doubles in frequency over the 4-month window. Although the analysis is subjective, we compare this to the U.S. Retail Gasoline price over the same window, which rises sharply and in fact reaches an all-time high at the end
0.8 Relative Score
Raw value
Topics KLD Unigram KLD
Freq. range
4
of the window. Topic 21 is likely related to a car accident in which the daughter of musician Steven Chapman was killed on May 22, 2007.
0.4
0.2
Topic Idx
Topics KLD Unigram KLD Unigram RP
Unnormalized
0.6 0.4 0.2 0 08/2007 09/2007 10/2007 11/2007 12/2007 01/2008 02/2008 03/2008 04/2008 End of 4−month window (day index)
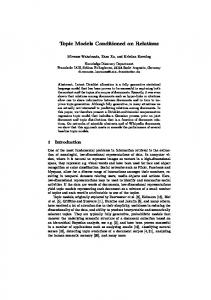
Figure 4: Topic drift indicators for iPhone data iPhone. On this data set each indicator peaks at a different time, as shown in Figure 4. Again the perplexity-based measure (URP) tends to conflict with both divergence measures. We perform further analysis on the window ending in mid-November, because it represents a local maximum for UKLD and a global maximum for TKLD . Table 2 shows the top four topics in this time-window ranked by their range in frequency. Using these rankings, we graphed a historical trend for the top four topics (24, 4, 15 and 7), shown in black
in Figure 5. Topic Idx
Freq. range
Top 4 words
24
0.1446
android, gphone, open, google, alliance
4
0.1086
viruses, advanced, malware, february, malicious
15
0.0543
iphone, apple, iphones, hackers, unlocked
7
0.0433
phone, 3g, cell, mobile, wireless
Table 2: iPhone topics for the Nov. 2007 window
20 Percent of tokens
24 ("Google Android")
15
4 ("iPhone malware") 15 ("iPhone hacked") 7 ("3g and wireless")
10 5 0 Aug ’07
Sep ’07
Oct ’07
Nov ’07
Time
Figure 5: iPhone topic trends, Jul.–Nov. 2007 The significance of the topics is clear in a historical context. Topics 4 and 15 appear to be discussions related to the announcement on October 17, 2007 by CEO Steve Jobs that Apple would release an SDK for the iPhone (Brooks 2009). The subsequent rise in topic 24 coincides with the announcement on November 5th of the Android mobile platform developed by Google and the “Open Handset Alliance”.
Discussion We have used compound topic models to track topics across distinct temporal data sets, and we have evaluated several indicators of topic drift. Exploratory analysis of both real and synthetic data indicates that we can use a simple unigram model to detect changes and find time periods of interest (using the KL divergence of the current unigram distribution), and avoid the extraction of a more computationally intensive topic model until we have found a window of interest. The CTM can also be used to compare topic distributions between data sets differentiated by demographics such as age or gender. Comparisons of this type could be useful in the automated extraction of marketing information, and we plan to explore such applications. We also plan to explore the use of varied-length scrolling windows to detect topic drift at different temporal granularities.
References Allan, J., ed. 2002. Topic Detection and Tracking: Eventbased Information Organization. Springer. Barzilay, R., and Lee, L. 2004. Catching the drift: Probabilistic content models, with applications to generation and summarization. In HLT-NAACL 2004: Proceedings of the Main Conference, 113–120. Blei, D. M.; Ng, A. Y.; and Jordan, M. I. 2003. Latent Dirichlet allocation. Journal of Machine Learning Research 3:993–1022.
Brooks, A. 2009. Steve jobs announces iphone sdk, coming february 2008. http://news.worldofapple.com/archives/ 2007/10/17/steve-jobs-announces-iphone-sdk-comingfebruary-2008. Energy Information Administration, U. D. o. E. 2008. U.S. retail gasoline historical prices, regular grade. http://www.eia.doe.gov/oil gas/petroleum/ data publications/wrgp/mogas history.html. Fisher, D.; Hoff, A.; Robertson, G.; and Hurst, M. 2008. Narratives: A visualization to track narrative events as they develop. In Proceedings of the IEEE Symposium on Visual Analytics Science and Technology (VAST 2008), 115–122. Griffiths, T. L., and Steyvers, M. 2004. Finding scientific topics. Proc Natl Acad Sci U S A 101 Suppl 1:5228–5235. Kleinberg, J. 2002. Bursty and hierarchical structure in streams. In Proceedings of the 8th ACM SIGKDD International Conference on Knowledge Discovery and Data Mining, 91–101. ACM Press. Nallapati, R., and Cohen, W. 2008. Link-PLSA-LDA: A new unsupervised model for topics and influence of blogs. In 2nd International Conference on Weblogs and Social Media (ICWSM’08), 1–9. Natalie Glance, M. H., and Tomokiyo, T. 2004. Blogpulse: Automated trend discovery for weblogs. In Proc. of 13th International Conference on World Wide Web (WWW’04), Workshop on the Weblogging Ecosystem: Aggregation, Analysis and Dynamics. New York, NY: ACL. Nicolov, N., and Salvetti, F. 2007. Efficient Spam Analysis for Weblogs through URL Segmentation. In Recent Advances in Natural Language Processing, volume 292 of Current Issues in Linguistic Theory (CILT). Amsterdam & Philadelphia: John Benjamins. 125–136. S.R.K. Branavan, Harr Chen, J. E., and Barzilay, R. 2008. Learning document-level semantic properties from freetext annotations. In 46th Annual Meeting of the Association for Computational Linguistics: Human Language Technologies (ACL’08), 263–271. Titov, I., and McDonald, R. 2008a. A joint model of text and aspect ratings for sentiment summarization. In 46th Annual Meeting of the Association for Computational Linguistics: Human Language Technologies (ACL’08), 308– 316. Columbus, Ohio: ACL’08. Titov, I., and McDonald, R. 2008b. Modeling online reviews with multi-grain topic models. In 17th International World Wide Web Conference (WWW’08), 111–120. Beijing, China: WWW’08. Wang, X., and McCallum, A. 2006. Topics over time: a non-markov continuous-time model of topical trends. In KDD ’06: Proceedings of the 12th ACM SIGKDD international conference on Knowledge discovery and data mining, 424–433. New York, NY, USA: ACM. Yi, J. 2005. Detecting buzz from time-sequenced document streams. In EEE ’05: Proceedings of the 2005 IEEE International Conference on e-Technology, e-Commerce and eService (EEE’05), 347–352. Washington, DC, USA: IEEE Computer Society.