Development and Validation of Standard Area Diagrams as Assessment Aids for Estimating the Severity of Citrus Canker on Unripe Oranges Ricardo Braido and Aline M. O. Gonçalves-Zuliani, Núcleo de Pesquisa em Biotecnologia Aplicada, Universidade Estadual de Maringá, Maringá, Paraná, Brazil; Vanderly Janeiro, Departamento de Estatistica, Universidade Estadual de Maringá, Maringá, Paraná, Brazil; Sérgio A. Carvalho, Centro APTA Citros “Sylvio Moreira”, Instituto Agronômico de Campinas, São Paulo, Brazil; José Belasque Junior, Departamento de Fitopatologia e Nematologia, Escola Superior de Agricultura “Luiz de Queiroz”, Universidade de São Paulo, Brazil; Clive H. Bock, United States Department of Agriculture–Agricultural Research Service SEFTNRL, 21 Dunbar Road, Byron, GA 31008, USA; and William M. C. Nunes, Núcleo de Pesquisa em Biotecnologia Aplicada, Universidade Estadual de Maringá, Paraná, Brazil
Abstract Braido, R., Gonçalves-Zuliani, A. M. O., Janeiro, V., Carvalho, S. A., Belasque Junior, J., Bock, C. H., and Nunes, W. M. C. 2014. Development and validation of standard area diagrams as assessment aids for estimating the severity of citrus canker on unripe oranges. Plant Dis. 98:1543-1550. Asiatic citrus canker (ACC) is an important disease of citrus in Brazil and elsewhere in the world. Infection with the causal pathogen, Xanthomonas citri subsp. citri, can cause severe disease on the fruit. Visual estimation of severity is the usual method used to quantify ACC on diseased fruit. The objective of this research was to construct and validate standard area diagram (SAD) sets as assessment aids for raters to improve the accuracy and reliability of visual estimates of ACC on unripe (green) fruit of sweet orange. Two SAD sets were constructed. A five-diagram SAD set had five severities depicted (0.5, 2.0, 8.0, 27.0, and 40.0%) and a six-diagram SAD set had six severities depicted (0.5, 1.0, 3.0, 9.0, 20.0, and 40.0%). Fifteen raters evaluated 40 images of cankered, unripe fruit. Both the five- and six-diagram SAD sets signifi-
cantly improved the accuracy and reliability of estimates. Agreement, measured by Lin’s concordance correlation coefficient, was 0.220 to 0.913 when not using SADs, 0.814 to 0.955 when using five-diagram SAD sets, and 0.863 to 0.925 when using six-diagram SAD sets. The five-diagram SAD set was significantly more accurate and reliable compared with the six-diagram set. Possible reasons for this are discussed. Based on the results, the five-diagram SAD set is preferable to use. Although the SAD set was developed for sweet orange, it doubtless has applicability to other citrus, including grapefruit. These SAD sets should be useful for research endeavors where accurate and reliable estimates of the severity of ACC are required.
Asiatic citrus canker (ACC), caused by Xanthomonas citri subsp. citri, originated in Asia but has been spread through human activity and is currently found in many tropical and subtropical citrus-growing regions. It is considered one of the most important bacterial diseases of citrus worldwide (16,19,35). In Brazil, ACC was first reported in 1957, in Paraná state, in the municipality of Lupionópolis (7,23). The disease symptoms are characterized by erumpent, necrotic lesions with yellow halos (on green tissues), and are found on leaves, fruit, and shoots (6,35). Within fields, the disease is spread by rain splash, often associated with wind, and also by transport on contaminated equipment (12,13,27,34). Subsequent to the first report in Brazil, attempts were made to eradicate the pathogen from Paraná state, an approach still used in other states in Brazil (e.g., São Paulo). However, in the southern states (including Paraná, Santa Catarina, and Rio Grande do Sul), the practice of eradication was abandoned, and ACC is now considered endemic (23). Paraná remains one of the most important citrus-producing states in Brazil (20) but the severity of ACC during the 1960s and 1970s prevented cultivation of citrus orchards in the northwestern and northern regions of the state. The Agronomic Institute of Paraná continues to encourage citrus production throughout the state but ACC remains an issue. In areas with environmental conditions conducive for the disease, management of ACC is critical. Much of the research activity and some management decisions are based on estimates of disease severity. In plant disease epidemiology, the severity of a disease
represents the proportion of area that is diseased on a plant organ (2). There is a need for accurate and reliable quantification of the severity of ACC on fruit, on which to base sound scientific conclusions or management options. Accuracy in measurement science can be defined as the closeness of the estimated values to the true values (26,33), and reliability is the extent to which the same estimate obtained under different conditions yields similar results (26,33). Several methods are used to measure or estimate plant disease (13,29) but visual rating remains the most widely used. Due to recognized error in plant disease estimation (10,11,13,31), standard area diagrams (SADs) are used in plant pathology to increase accuracy and reliability of disease severity estimates made by raters (2,21,32). The improvement that can be achieved by using SADs is now well documented for different plant diseases (5,17,21,28, 37,38,41), including for foliar symptoms of ACC (5). The use of SADs reduces error of the estimates made by raters. Correct use of SADs requires the rater to estimate as close to the actual value by interpolating between two severities represented in the SADs (1). Although some of the methods used to estimate disease on fruit have been very sophisticated, such as three-dimensional fruit surface image analysis (14), other methods have relied on two-dimensional SADs to represent a single face of the approximately spherical fruit. Two-dimensional SADs have been developed for fruit diseases (37) and have been validated and demonstrated to improve both accuracy and reliability of rater estimates. ACC on fruit is important because is can lead to premature abscission and reduced marketability (4,9,18), yet no SADs have been developed for the purpose of assessing severity of ACC on citrus fruit. However, green, unripe fruit of citrus are a contrast to ripe fruit, which are ordinarily yellow to orange in color. On unripe fruit, the typical corky lesions of canker have chlorotic haloes surrounding them but lesions on ripe fruit lack the chlorotic halo, the edge of which ends abruptly at the healthy, ripe yellow-orange-colored
Corresponding author: W. M. C. Nunes, E-mail:
[email protected] Accepted for publication 28 April 2014.
http://dx.doi.org/10.1094/PDIS-01-14-0090-RE © 2014 The American Phytopathological Society
Plant Disease / November 2014
1543
fruit rind. There is a need to develop specific SADs that can be used as an assessment aid for both unripe and ripe fruit. The objectives of this research were, first, to construct SADs for unripe fruit as an assessment aid for raters; second, to validate the SADs by comparing disease estimates made without and with the use of these SADs; and, third, to compare two different SAD sets, one with an additional severity depicted to ascertain whether there was an advantages to an additional illustrated severity to help estimate ACC severity in the range of most frequently encountered severities.
Materials and Methods Development of SADs. Green, unripe fruit (n = 100) of sweet orange (Citrus sinensis) ‘Baia’ presenting symptoms of ACC (necrotic, erumpent, corky lesions, the edge of which are surrounded by a chlorotic halo that blends into the green rind of the unripe fruit) were harvested from a field experiment located in Maringá, in the northwest of Paraná state (latitude 23°25′ S, longitude 52°10′ W, elevation 555 m). Fruit were 6 to 8 cm in diameter. The orchard was planted in April 2003 with trees spaced 3.5 by 5.0 m. Crop management practices were carried out as for commercial citrus production areas in Paraná state, except no ACC control was practiced and no copper-based products were used. To measure the symptomatic area on the surface of the unripe fruit, the face of each fruit with the most severe symptoms of ACC was photographed with a digital camera (Sony CyberShot 5.1MP). In practice, raters would most often need to assess both faces of a fruit, taking care to ensure that each side was fully represented
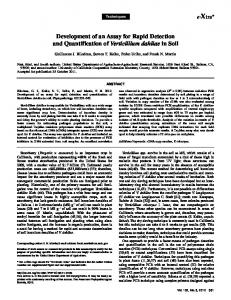
Fig. 1. Proportion of Baia sweet orange fruit (total n = 100 fruit) with different severities (percent area diseased) of Asiatic citrus canker as measured using image analysis. Fruit were collected from an orchard in Parana state, Brazil. Symptoms area measured included the chlorotic halo and the necrotic area.
(i.e., no overlap); however, for the purposes of this study and the validation process, only a single side was assessed (where both sides are assessed, total severity would be divided by 2, so as to obtain the overall severity per fruit). For the photography, fruit were illuminated using a 40-W light bulb placed 15 cm from the fruit to ensure uniform light conditions. The resulting images were analyzed for diseased area (necrotic + chlorotic) using the image analysis program Quant V1.0.2 (39). The diseased area in relation to the total surface area of the fruit was used to calculate the percent fruit surface area with ACC. The minimum and maximum percent severity obtained from the 100 images of the unripe fruit were 0.5 and 39.6%, respectively. The frequency of the severities in different ranges (Fig. 1) shows that approximately 75% of the fruit had an ACC severity ≤24%. The range and maximum disease severity for various plant diseases has been previously characterized (22), and this distribution is common (if ACC is very severe on immature fruit, it often results in premature fruit abscission; 4). Based on the range and frequency of severity, two separate SAD sets were constructed. The first had five diagrams and the second had six diagrams. The two SAD sets had slightly different structure; with the six-diagram SAD set, an extra diagram was included in the range of more frequently encountered severity (≤20%). Upper and lower limits were based on the image analysis-measured minimum and maximum ACC severity in the sample of 100 fruit. Thus, the severity values illustrated for the five-diagram SAD set were 0.5, 2.0, 8.0, 27.0, and 40.0% ACC (Fig. 2A), and for the sixdiagram SAD set were 0.5, 1.0, 3.0, 9.0, 20.0, and 40.0% ACC (Fig. 2B). The images in both the five- and six-diagram SAD sets were constructed from images of fruit harvested from the same orange trees in the experiment described above. The SAD images were prepared using the image analysis program Quant. V1.0.2. The two different sets were developed to explore whether an additional diagram in the range where most frequent severity was encountered might increase accuracy and reliability, without dramatically increasing the complexity of the SAD set. Validation of SAD set. To validate and compare these SAD sets, 15 raters estimated the severity of a subset of 40 images of the cankered fruit using a PowerPoint slide presentation, showing each fruit image at random on a computer screen. The raters had a range of experience with disease assessment and familiarity with ACC symptoms. Prior to the first assessment, all raters received the same instructions describing the symptoms of ACC and instructions in use of the SAD set. Initially, each rater estimated the severity of ACC without the aid of the SAD set. After a 30-min break, each rater reestimated severity of ACC on the same fruit images shown
Fig. 2. Standard area diagrams (SADs) used with the same range but with five A, or six B, severities depicted. The SADs were used by 15 raters as aids to estimate citrus canker on 40 images of unripe (green) Baia sweet orange displaying a range of disease severity. 1544
Plant Disease / Vol. 98 No. 11
at random but with the aid of the five-diagram SAD set as an assessment aid; and. finally, after a further 30-min break, the raters assessed the images shown at random a third time using the sixdiagram SAD set as an assessment aid. Data analysis. Analyses were performed using either SAS (V9.3; SAS Systems) or MS Excel (Microsoft Corp.). Data were analyzed
Table 1. General linear model (GLM) analysis of the effect of standard area diagrams (SADs) (zero or SADs with five or six diagrams), raters (n = 15), and actual severity (n = 40) on estimates of Asiatic citrus canker on unripe (green) Baia sweet orangez Effect
DF
F value
P value
Number of SADs Fruit number Rater Number of SADs × Fruit number Number SADs × rater Fruit number × rater
2 39 14 78 28 546
256.46 142.14 3.26 4.87 11.69 1.04