and production from longwall GGVs for better mine safety and planning. NIOSH-MCP and both linear and nonlinear multiple regression techniques can.
DEVELOPMENT OF MULTIPLE REGRESSION FUNCTIONS FOR PERFORMANCE PREDICTION OF GOB GAS VENTHOLES FOR SEALED AND ACTIVE LONGWALL MINES Heather N. Dougherty, NIOSH, OMSHR C. Özgen Karacan, NIOSH, OMSHR Gerrit V.R. Goodman, NIOSH, OMSHR National Institute for Occupational Safety and Health, Office of Mine Safety and Health Research, Pittsburgh, PA 15236, USA Abstract In the absence of values for each influencing parameter and a known relationship of input-output space, novel approaches should be implemented as proxy solutions to mathematically complicated problems. Proxy solutions can be in the form of linear or non-linear multiple regression equations. Predicting the performance of gob gas ventholes is one of these mathematically complicated problems as it is difficult to know the exact relationships between various parameters influencing gob gas venthole (GGV) performance from active and sealed (completed) longwall panels. In this paper, a discussion of the NIOSH-developed software suite for methane control and prediction (MCP) based on an artificial neural network (ANN) is presented. The application of the ANN-based software suite to develop algebraic relationships for gob gas venthole performance prediction in sealed and active longwall panels is sought. Output information obtained from the NIOSH-MCP software as a response to various input parameters were used to create an input-output database for total flow and methane percentage from GGVs operating in active mines during completed and sealed panel situations. Due to the multi-variable nature of the software, outputs generated using the software for various inputs were used to develop analytical equations first using linear and then second using nonlinear multivariable regression techniques. The advantage of this method is its ability to better understand the significant parameters of the relationships between the inputs and outputs for gob gas venthole production in active and sealed panels and to be able to predict their performances using relatively simple analytical functions. overburden or gob, reducing the effect of methane in the bleeder system. Other than increasing ventilation flow into the bleeder system, there are few ways to ventilate the gob so methane from the overburden does not flow into the active mine workings. Other than ventilation, GGVs are currently the best defense against methane escaping into the active mine. GGVs were initially just holes drilled into the gob prior to longwall mining to let gob gases escape, but they have evolved by adding a negative pressure pump to pull gases out of the gob.
1. Introduction Longwall mining, which became increasingly popular in the late 1970’s has become the most widely used method in coal and accounts for more than 50% of the United States underground coal production (EIA, 1995). Longwall mining has progressed since then to become increasingly mechanized, productive and safe. With these advancements there have been hurdles to overcome due to the rapid creation of gob and gases released from the broken strata.
During the initial project planning phase of a mine, creating a degasification plan, determining the need for GGVs and anticipated concentration and flow of methane can be difficult. Degasification plans
GGVs have been a very important part of longwall mining in numerous coal seams due to their effectiveness of eliminating gas within the fractured 1
require a good knowledge of the coal and mining conditions to determine what types of degasification techniques, if any, are needed to safely mine the coal and ventilate the mine. GGV’s have become an important part of degasification plans, along with inseam boreholes, surface inseam boreholes, and the main mine ventilation system. Gob gas ventholes’ methane production potentials may be determined by looking at mining parameters such as percentage of panel completed, linear advance rate and characteristics of the GGV such as surface elevation , average overburden, slotted casing diameter, slotted casing distance to the seam, and GGV distance to tailgate, to name a few.
Using the data from MCP, linear and non linear modeling will be used to establish model equations determining the relationship between the variables and the outcome of the different inputs. Linear modeling will initially be used because it is more straight forward and easier to do. The data will be looked at in all aspects, but mostly the residuals, to see if the calculated data fits to the actual data. If this fitting is not sufficient non-linear modeling will be used to find a model that fits the real data to a degree making the residuals lower and make the calculated data a better fit to the real data.
Mine operators primarily use past practices and experiences to develop a degasification plan for their operations. Recently, there have been more complicated methods used to predict production performance of GGVs. Ren and Edwards (2002) suggest the use of computational fluid dynamics (CFD) modeling and geotechnical modeling to help understand and improve gas capture effectiveness. This paper centers on maximizing the effectiveness of production of GGVs to maximize gas extraction. Tomita etal (2003) describes a finite element model program created to predict gas emission based on 3D stress called Mine Gas Flow 3D (MGF-3D). Karacan et al. (2005) has developed 3D models to predict incremental changes in methane emissions due to the increasing panel width to optimize GGV performance. Investigating the effects of various GGV completion parameters, Karacan et al. (2007) used a reservoir simulation to estimate performance. These models (Karacan etal, 2005 and 2007) are realistic but difficult to build and not practical for modelers due to the moving inner-boundary conditions, for instance the existence of a progressing longwall face, used in their formulation.
The data for this paper was obtained using NIOSH Methane Control and Prediction (MCP) software to simulate different longwall development and GGV parameters and collect output values. MCP was built using a multilayer perceptron (MLP) type artificial neural network (ANN) structure and actual data was used to train the ANN. The ANN was trained using different geographical locations, longwall operation parameters, and coalbed characteristics as input and was tested to classify the outputs (Karacan 2008a; 2009a; 2009b; 2009c).
2. MCP modeling
MCP was developed with four modules: 1. Coal measure rock mechanical properties prediction 2. Mine ventilation emission prediction 3. Degasification system selection 4. Gob gas venthole production performance prediction These four modules help mine operators define future degasification for a safer and less gassy mine. In this study only the gob gas venthole production performance prediction module was used to produce values that were used during the regression analysis.
The objective of this work is to find simple-to-use analytical models to predict methane concentration and production from longwall GGVs for better mine safety and planning. NIOSH-MCP and both linear and nonlinear multiple regression techniques can create these models. Although MCP can determine the output values used in this study, the ANN systems it was built upon takes the information and calculates an output without the user knowing the relationship between variables. Determining these relationships is important in understanding GGV production; as it quantifies the sensitivity of methane production and methane quality for different mining and GGV parameters.
Mining parameters or input values required for the MCP software were created by random number generation in MS Excel for each variable using its mean values and standard deviations. A correlation analysis was also performed on the randomly created input data set to check correlations between different variables. No correlations were found using the MS Excel correlation function. Input values were then used in the MCP program to obtain the corresponding outputs of GGV production rate and GGV percent methane. Table 1 shows the input parameters for MCP used to obtain flow rate and methane concentration data output. The input-output data produced were 2
analyzed using both multiple linear and non-linear regression methods to determine their relationships. These analyses and the results are described in the following sections.
3.1 Multiple linear modeling Dependent variables used for linear regressions were simulated GGV production rate and methane concentration given a panel status of active or complete. Using the 12 independent parameters listed in Table 1, 118 and 131 observations (simulations) were created for active and completedpanel cases, respectively. A separate regression analysis was performed for each of the longwall statuses presented. Table 1 shows the symbolic names of all the variables used in the multiple linear regression analysis.
Table 1. MCP input parameters, minimum, maximum’s and mean used within the MCP program. Active Completed Panel Status Idle Advancing Face Status Parameter % of Panel Completed PC Linear Advance Rate (ft/day) LA Surface Elevation (ft) SE Average Overburden (ft) AO Casing Diameter (in)CD Slotted Casing Distance (ft) SC GGV Distance to Tailgate (ft) DTG GGV Distance from Start (ft) DF LW Panel Length (ft) PL LW Panel Width (ft) PW Barometric Pressure (in. Hg) BP Exhauster Vacuum (in. H2O) EV
Min
Mean
Max
1
73.2
100
0
25.1
96
1000
1280
1460
600
743
1000
6
7.5
9
30
45
60
220
280
340
350
2160
8000
5000
10900
11500
1200
1250
1450
15
28.6
30
0.5
-43
-90
Backward elimination was used as the regression variable selection technique in this study. Backward elimination has advantages over forward selection and stepwise regression by evaluating the joint predictive capability of the inputs (Motulsky and Christopoulos, 2004). Analysis of variance or ANOVA, as the associated analysis used in backward elimination, evaluated the importance of each independent variable based on the contribution it makes to the prediction of the dependent variable. This statistical technique was utilized to develop a linear model to predict GGV production and methane concentration using a minimum of 118 observations for the two different longwall statuses. While selecting the longwall and GGV parameters for their importance to GGV production and concentration, it was important to be sure there would not be a high degree of correlation among the variables. Throughout the analyses the confidence interval of regression was set as 95%. The GGV production and methane concentration modeling was started by including all of the input parameters. However, not all of them survived the backward elimination process under the given constraints of confidence interval and significance values. Variables whose statistics proved them to be insignificant in the presence of the other significant ones were excluded during backward elimination so final models were composed only of significant variables. Beyond the statistical importance of the data, it is important from a practical point of view because fewer significant variables make data collection easier, economical, and understandable.
3. Multiple variable models for prediction of GGV production and methane concentration In this paper, the longwall panel and GGV placement parameters shown in Table 1 that control GGV production and methane concentration were considered as independent parameters. All of these parameters were randomly varied and entered in the MCP program to generate an output that was broken down into two categories for the longwall panel status: active and completed panel. Only active – advancing and complete – idle were run for this test, since active – idle occurs on a rare occasion, and complete – advancing is not a possibility due to the fact that a complete panel cannot advance. For each panel status, both methane concentration and gas production were studied for their relationships with input parameters.
Description of parameters in Table 1, the panel status and their possible effects are given in Appendix A. For more detailed information, please see Karacan (2009c; 2009d).
3
their low significance determined backward elimination process.
3.1.1. Model equations, analysis of multiple determination coefficients, and ANOVA Linear models were run for GGV production and methane concentration for the two longwall statuses derived using backward elimination. Variables were checked and the multiple determination coefficient R and the square of multiple determination coefficient R2 were calculated (Karacan, 2008b).
during
the
1-A
The outputs of ANOVA (analysis of variance) tests are also analyzed. ANOVA gives general significance statistics data and possible autocorrelation problems within the data set, which do not disclose the regression accuracy of the models. Accuracy of the models can be revealed by regression coefficients such as determination coefficient R and the square of multiple determination coefficients R2 (Karacan, 2008b). The values of R2 or the coefficient of determination is used to shows how the variability of the data set is accounted for by the model. The R2 value for methane concentration ranges from 0.7464 to 0.5531, and the value for GGV production rates ranges from 0.6343 to 0.5531 based on panel status (active to idle, respectively). However, the model fit to GGV production rate and methane concentration in the active panel case is higher compared to the model for production rate from a completed panel. This indicates that the GGV production rate and methane concentration from active panels are more linearly related to various borehole completion and face advance parameters. These values show that methane concentration can be modeled more successfully with a multi-linear model. However, to improve the predictive capability, non-linear models were investigated for active and complete statuses.
1-B
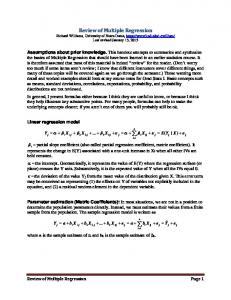
Figure 1A and 1B show the comparison of MCP results (actual data) to outputs for the linear models for methane concentration in GGV gas production and production rate from a completed panel, respectively. An accurate linear model would show all the points very close to the fit line shown, which has a 45o- slope or perfect prediction line, and would indicate an accurate fitting of the calculated and actual data. Active panel plots show similar distribution.
Figure 1. Comparison of actual methane concentration versus calculated methane concentration (1-A) and a comparison of actual GGV production versus calculated GGV production (1-B) for a completed panel. Surface elevation and average overburden can be used similarly when referring to a horizontal deposit of coal; these two parameters would show numbers similar to the depth of the GGV. Similarly, linear advance rate was determined to be insignificant compared to the other variables whose statistics proved them to be more significant. Linear advance may be related to progression of the gob and to whether it is created more slowly or quickly. Therefore, face advance rate may not have a significant impact on GGV production rate and
Final linear models do not contain all of the parameters listed in Table 1 and discussed in Appendix A. Final models contain 4 to 7 of the initial 12 parameters. The three parameters that were excluded from all four equations were linear advance, surface elevation and average overburden, due to
4
methane concentration once the GGV has been actively undermined. The parameter “percent completed” impacted two of the four equations – which points to general progress of the panel and expansion of the gob as being important. The most significant variables used in three out of the four models were casing diameter, longwall panel width, and outside atmospheric pressure. Each of these variables has a different effect on GGV performance. Casing diameter seems to have the most effect on production – the easier the gas can flow from the gob to the surface, the greater the production. However, everything else being the same, increasing casing diameter results in a decreased methane concentration due to creating a larger sink and drawing additional mine air from the gob into the borehole, as shown by numerical reservoir simulations (Karacan et al., 2007). Likewise, the longwall panel width had a larger effect on gas production rate and methane concentration since this parameter is related to the gob size. Outside barometric pressure has a large effect on the ventilation of the whole mine, thus making it easier or harder for the exhauster to work to liberate the methane gas from the gob environment.
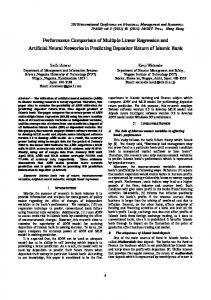
Figure 2. Residual scatter plot for GGV production in an active longwall panel for linear modeling 3.2. Non-linear regression modeling and analysis of GGV production rate and methane concentration As shown in Figure 1A and 1B, the predicted rates and concentrations do not exactly follow the 45o line when compared with the MCP data, showing the degree of accuracy with linear models can be improved by other techniques. Therefore, non-linear regression was performed as the next step to model the data. As in the multiple linear study the same input-output data were used for both GGV flow rates and methane concentrations for each longwall panel status.
3.1.2. Analysis of the multiple linear regression coefficients Although multiple linear methods can model production rates and methane concentrations from GGVs, comparison of MCP data with the multiplelinear model shows that predictability could be improved (Figure 1-A and B). Figure 2 shows standardized residuals versus predicted values for production rates calculated for an active panel. In a case where the multiple linear model is adequate and can represent the data accurately, the standard residuals should be distributed randomly along the predicted value axis between +2 and -2. Figure 2 shows that there is evidence of increasing error variance with increasing predicted values. However, as seen from this figure, the standard residuals are distributed as a well defined arc shape, which is an indication of nonlinearity: the production rate and methane concentrations are dependent on the variables given in Table 1 in a non-linear way. Therefore, application of non-linear regression techniques is a more promising way of modeling the rate and concentration data.
Non-linear regression was also performed using the principles of least squares. During the regression process, the goal is to minimize the sum of squared error (SSE) and mean squared error (MSE) of the non-linear equation to find the equation closest to the actual data. However, in order to find the distances to actual data, derivatives of the proposed equations are taken for each point numerically using iterative techniques. This makes modeling and analysis more complicated and difficult. However, unlike multiple linear regression, if one knows the general functional relationships between dependent and independent variables, a successful nonlinear regression or model can actually provide insight to the physics of the process. In this study polynomial-type non-linear equations were used as models. Special attention was paid to select the type and degree of the equations so that the model would provide a satisfactory regression, but not too complicated for practical use. As a result of various trials with different model equations, fourth 5
order polynomials were selected as the best equations to meet these two criteria. After the regression study, coefficients were examined and ones with either zero or less than 10-4 were eliminated from the final proposed models (Table 2) as they indicated insignificant contributions. Table 2 represents the model equations that were obtained from the nonlinear regressions. Along with the model equations for both production rate and methane concentration for active and completed panels, Table 2 shows R2, sum of squared error (SSE), mean square error (MSE), and root mean square error (RMSE). SSE, MSE and RMSE are presented to show that, although a higher value of R2 indicates a better fit, it does not always mean that the residuals are low. SSE, MSE, and RMSE are all ways to determine the error within model equation. SSE, or sum of squared error, is the sum of the squared errors from each set of data. MSE or mean square error is the square of the residuals from the actual answer to the calculated answer. Both SSE and MSE are in units of the square of the units of the data for the model which in this case is MMscf/d for methane production and % CH4 for methane percent. RMSE or root mean square error is the square root of the MSE which determines the width of the confidence intervals for the models and its units are the same as the units of the data for the model. For residual analyses and for deciding whether the predictions of an equation are close to the actual data points, analyses of squared errors and mean squared errors are more appropriate as they rely on the values of residuals which are also expected to be low for a good fit.
3-A
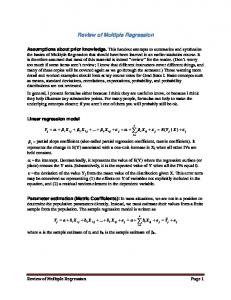
3-B Figure 3. Non-linear plot of a comparison of actual vs. calculated data for methane concentration (3A) and GGV production (3B) for an active panel.
Table 2 shows that R2 values are higher than the ones developed in multiple linear regression, especially for the completed panel case that had been emphasized in the previous section for more prominent non-linear characteristics of the input-output data. Also, Table 2 shows that various error measurements based on residuals are low for the simple non-linear models proposed for these complicated problems.
4. Production characteristics of a GGV drilled over a completed panel Completed panels exhibit different reservoir characteristics compared to active panels in terms of gas availability and boundary conditions. For instance, an active panel may behave as an infinite reservoir since additional gob is created as long as the face advances, which makes additional gas available to be produced continuously. Existing boreholes may not experience boundary effects present in completed and sealed panels (Karacan, 2009d). Since active panels are ventilated continuously, the proximity of the bottom of the boreholes to the caved zone and suction vacuum may make a difference in terms of capturing mine air, which is not an issue in completed and sealed panels. These and other critical
Figure 3A and 3B illustrate comparisons between calculated and actual data plotted for (A) active longwall methane concentration and (B) active longwall methane production. These figures show a better fit when compared with MCP data than linear modeling allowed. Completed panel data show similar results.
6
Table 2. Non-linear models for predicting GGV production and methane concentration for active and complete longwall status using longwall and GGV parameters as listed in Table 1. Longwall Status
Model Equation
R2
SSE
MSE
RMSE
Active GGV PROD
208.477 - (2.593 * PC) - (7.751 * CD) - (1.654 × 10⁻² * PL) (0.318 * PW) + (6.102 × 10⁻³ * EV) + (3.938 * PC2) + (1.088 * CD2) - (1.943 * PC3) - (4.895 × 10-02 * CD3)
0.786
1.537
0.014
0.117
Active METHANE CONC
71.602 - (4.364 × 10⁻³ * PC) - (0.388 * SC) + (0.265 * DTG) (1.542 × 10⁻² * PL) - (8.707 × 10⁻² * PW) - (1.062 × 10⁻² * EV) + (0.455 * PC2) + (9.023 × 10⁻³ * SC2) - (9.369 × 10⁻⁴ * DTG2) (0.401 * PC3)
0.756
0.813
0.007
0.086
Complete GGV PROD
285.110 - (8.946 × 10⁻² * PL) - (8.978 × 10⁻² * AO) + (14.264 * CD) + (0.728 * SC) - (8.868 × 10⁻² * PW) - (12.662 * BP) + (2.034 × 10⁻² * EV) - (3.074 * CD2) - (2.924 × 10 -2 * SC2) + (0.843 * BP2) + (9.872 × 10⁻⁴ * EV2) + (0.292 * CD3) + (5.018 × 10⁻⁴ * SC3) - (2.466 × 10⁻² * BP3) - (1.029 × 10⁻² * CD4)
0.640
0.974
0.011
0.105
Complete METH CONC
-24.505 - (4.985 × 10⁻³ * AO) + (6.376 * CD) + (0.110 * SC) (4.021 × 10⁻² * DTG) - (4.395 × 10⁻³ * PW) + (3.212 × 10⁻³ * PL) + (0.831 * BP) - (7.966 × 10⁻³ * EV) - (0.879 * CD2) - (3.125 × 10⁻³ * SC2) - (3.487 × 10⁻² * BP2) + (3.986 × 10⁻² * CD3)
0.678
0.862
0.009
0.096
production rate. The variables SC and DTG were found to impact methane concentration.
differences in reservoir and production potential from active versus completed panels may make a difference how GGVs should be drilled and operated. The equations given in Table 2 may help define the production characteristics of GGVs from completed panels in comparison to active panels and how various parameters may affect the production rate and methane concentration from completed panels.
For completed, and possibly sealed, panels the equations and the influencing parameters were different due to the previously discussed nature of the gob gas reservoir after panel completion and how this reservoir may interact with the outer boundary conditions, such as the GGV and the surrounding atmosphere. Since the panel is completed, the inner moving boundary (PC) is naturally not effective anymore. The volume of gob and the gas availability is fixed by PL and PW with gas availability usually showing a declining behavior. Since the panel may not be ventilated anymore, the existing pressure differential that affects the gas flow seems to be due to interplay between barometric pressure (BP), exhauster vacuum applied to the wellhead of the GGV (EV), and the average overburden to the panel (AO). Average overburden is particularly important for the gas production from completed panels for its effect on the BP at the mine level and the energy required, EV, to bring the gas up to the surface. Thus, the difference between BP and EV at a certain depth affected by the length of the borehole (AO) is important for gas production rate and methane concentration.
The equations in Table 2 for GGV production rate and methane concentration from active panels show both of these quantities are functions of panel completion (PC), panel length (PL), panel width (PW) and exhauster vacuum (EV). The parameters PL, PW and PC are related to the volume of the gob which also is an indication of the available gas amount at a certain stage of mining. Casing diameter and the exhauster vacuum, on the other hand, are more related to the transmission of gas to the surface or borehole productivity. However for methane concentration, distance of the slotted casing to the top of the mined coal bed (SC) and the distance of the GGV to tailgate were found to be influential, instead of casing diameter. If the borehole is too close to the coal bed in an active mine, the gas is diluted with mine air. At higher (second and third) orders of influence, percent of panel completed (PC), the distance of the GGV from panel start (DF), and casing diameter (CD) were found to affect GGV gas
For completed panels, casing diameter (CD) and the distance of slotted casing to coal bed (SC) are both important for gas production rate and methane 7
concentration. Casing diameter (CD) impacts the gas production by creating a larger sink. It is also important for methane concentration as it captures more of the methane rich gas from the completed panel. For both gas production rate and methane concentration, SC seems to be important for the borehole to draw easily in a high permeability zone for higher gas production. This is different than active panels where SC was not found to be particularly important for GGV gas production from active panels. The parameters discussed here and in the previous paragraph were also influential at higher orders in the equations of GGV gas production and methane concentration for completed panels. 5.
Coalbed Methane Symposium, Tuscaloosa, Alabama.
May,
Karacan, CÖ. Esterhuizen, GS, Schatzel, S, Diamond, WP. 2007. Reservoir-simulation based modeling for characterizing longwall methane emissions and gob gas venthole production” International Journal of Coal Geology. 71 (2-3), 225245. Karacan, CÖ. 2008a. Modeling and prediction of ventilation methane emissions of U.S. longwall mines using supervised artificial neural networks. International Journal of Coal Geology. 73, 371-387. Karacan, CÖ. 2009a. Elastic and shear moduli of coal-measure rocks derived from basic well logs using fractal statistics and radial basis function networks International Journal of Rock Mechanics and Mining Sciences. 2009a.
Conclusions
Degasification of a mine is a high priority when mining any gassy coal seam. Using data from MCP to determine models and relationships between variables we have found the following: • MCP predicts the GGV methane concentration and production, but does not define relationships between the variables. • Linear modeling, while more easily accomplished with a simpler model, does not fit the data adequately. • Non-linear modeling was then used and was determined that a 3rd or 4th degree polynomial was a best fit. In reality, they were all allowed to fit 4th degree polynomials, but the coefficients of the highest order terms were either zero or very small. Therefore, those terms were eliminated, which reduced the order in the final equations. • The non-linear approach made the model equations more complicated than the linear approach. • The non-linear regression created a model that better honored the relationship between the variables that affected the output of GGV’s. 6.
17-19
Karacan, CÖ. 2009b. Degasification system selection for U.S. longwall mines using an expert classification system. Computers and Geosciences. 35, 515-526. Karacan, CÖ. 2009c. Forecasting gob gas venthole production performances using intelligent computing methods for optimum methane control in longwall coal mines, International Journal of Coal Geology 79, 131-144. Karacan CÖ. 2009d. Reconciling longwall gob gas venthole performances using multiple-rate drawdown well test analysis, International Journal of Coal Geology. 80 (3-4), 181-195. Karacan, CÖ. 2008b. Evaluation of the relative importance of coal bed reservoir parameters for prediction of methane inflow rates during mining of longwall development entries, Computers and Geosciences. 34 (9), 1093-1114. Karacan, CÖ., Goodman, G. 2009. Hydraulic conductivity and influencing factors in longwall overburden determined by using slug tests in gob gas ventholes. International Journal of Rock Mechanics and Mining Sciences. 46 (7), 1162-1174.
References
EIA, Energy Information Administration. 1995. Longwall mining. U.S. Department of Energy, Office of Coal, Nuclear, Electric and Alternate Fuels, Report No: DOE/EIA-TR-0588, Washington, D.C.
Motulsky, H., Christopoulos, A., 2004. Fitting Models to Biological Data Using Linear and Nonlinear Regression: A Practical Guide to Curve Fitting. Oxford University Press, New York, NY, 351pp.
Karacan, CÖ, Diamond, WP, Esterhuizen, GS, Schatzel, SJ. 2005. Numerical analysis of the impact of longwall panel width on methane emissions and performance of gob gas ventholes. 2005 International
Ren, T.X., Edwards, J.S. 2002 Goaf gas modeling techniques to maximize methane capture from 8
surface gob wells. In: Mine Ventilation, Euler De Sauza (Ed.). 279-286.
role on amount and concentration of methane captured. Reservoir modeling results showed when the setting depth was close to or within the caved zone, methane concentration and total amount of methane captured decreased. However, one additional consideration for changing setting depth for the slotted casing may be the competency and productivity of the formations surrounding the slotted casing based on their mechanical properties and gas contents. Distance from the bottom of slotted casing to top of the coal bed should be the actual value reported by the venthole driller, after drilling and completing the venthole.
Savin, N.E., White, K.J., 1977. The Durbin–Watson test for serial correlation with extreme sample sizes or many regressors. Econometrica 45, 1989–1996. Tomita, S., Deguchi, G., Matsuyama, S., Li, H., Kawahara, H., 2003. Development of a simulation program to predict gas emission based on 3D stress analysis. 30th International Conference of Safety in Mines Research Institutes, South African Institute of Mining and Metallurgy, 69-76. APPENDIX A
- Distance of venthole from panel start (DF): The location of a gob gas venthole with respect to the panel start is based on the subsidence profiles expected during mining in order to locate the ventholes in tension zones. Tension zones are the areas within the longwall panel gob that have the largest openings (highest tension between strata) within the strata, giving a possible GGV the best ability to pull the gas from these fractured layers. The distances from the start of the panels and distances between ventholes along the panel are again based on maximizing productivity, on expected drainage radius of ventholes, and on emissions in the mines. In general, holes on the ends of the panels (especially the ones at the starting end) are the highest-quantity and longest-duration producers. This is attributed to enhanced mining-induced fractures on the ends of panels where the overburden strata are in tension on three sides due to support of the surrounding pillars instead of two sides in the holes along the panel. This parameter can be used to decide the distance of the borehole from the start of the panel and the distance between boreholes during venthole design process.
- Average exhauster vacuum (EV): A vacuum applied to the gob gas wellhead stimulates methane migration into the venthole from the surrounding strata and prevents flow reversal into the mine. It is recommended to measure exhaust suction pressure at both below and above the flame arrestor. The average of these two readings can be used as the average vacuum applied at the wellhead as an input parameter. In general, higher vacuum leads to higher flow, but at the risk of drawing mine air into the GGV and diluting methane concentration. - Outside barometric pressure (BP): Atmospheric pressure is an important factor for gas emission and production, especially from uncovered sources, i.e., when the gas source is in direct communication with atmosphere. For uncovered gas sources (abandoned mines with open-to-atmosphere ventholes, landfills and surface coal mines), there may be a strong inverse relationship between barometric pressure and methane emissions. However, this situation can be very different for closed sources underground as they will not have direct contact with the atmosphere.
- Distance of venthole to tailgate (DTG): The location of a gob gas venthole with respect to the panel tailgate is usually based on subsidence profiles expected during mining in order to locate ventholes in tension zones, where most fractures are open. This ensures maximum production from the fractured strata as compared to a location in the centerline of the panel which is in compression due to subsidence and re-compaction of the longwall gob.
- Casing diameter (CD): Casing diameter is used in calculating gob gas venthole performances. Earlier studies (Karacan et al., 2007; Ren and Edwards, 2002) showed, keeping the other completion parameters constant, increasing gob gas venthole casing diameter increased cumulative methane production from the subsided strata. Although a marginal decrease in the methane concentration was evident from this change, possibly due to increased mine-air extraction with a larger sink, higher gas flow rates increased the overall volume of methane produced.
- Face status information (Idle/Advancing): Longwall production down times due to mechanical delays or vacation periods halt expansion of fractured methane reservoir which eventually may affect gas production rates and methane percentages from gob gas ventholes.
- Distance of bottom of the slotted casing to top of coal bed (SC): Casing set depth with respect to the top of the mined coal seam may play an important 9
- Linear mining advance rate (LA): Gob gas venthole production performance during longwall mining is closely related to face advance rates that affects fracturing and permeability due to dynamic deformation and subsidence. Usually, higher face advance rates result in lower hydraulic conductivity in the fractures (Karacan and Goodman, 2009), suggesting a possible impact on venthole performance. Face advance also creates an extensively fractured methane reservoir from which the gob gas ventholes can extract gas. An increased face advance rate causes a larger percentage of the panel to subside and creates a larger fractured reservoir in a given time compared to a slower advance rate.
larger area of fractured strata. If not captured effectively, additional gas emissions from a larger area of fractured formations can enter the mining environment and may create unsafe operating conditions. Thus, as the size of the panel increases, the expected increase in emissions must be controlled by effective degasification methods. The size of the panel (length and width) should be available as part of the mine plan. - Percent of the panel completed (PC): Methane concentration and flow rate measured in venthole production is also related to what extent the panel has been mined, since it directly affects the size of the gob reservoir, its limits, and methane availability.
- Overburden depth of the gob gas venthole (AO): The desired locations of ventholes may be different than initially planned locations due to land ownership issues and accessibility of planned drilling locations, which may lead to ventholes being drilled at different locations (hill tops or valleys). Based on evaluating hydraulic properties of underground strata in field studies and their potential responses to longwall mining during these measurements, ventholes drilled in valleys may be more productive than those drilled on hill tops due to pre-existing or easily extended structural fractures. Also, permeability of the fractures at the hill-top wells during longwall mining is usually less compared to valley-bottom wells due to greater overburden depths, causing lower hydraulic conductivities and potentially less effective boreholes as opposed to shallow ventholes. This general information can be used as guide in deciding where to locate ventholes in accordance with surface terrain. However, keep in mind that gas content of coal seams generally increases with increasing overburden. Thus, if there are major coal seams within the slotted interval, information of their sitespecific gas content may lead to a better selection in drilling location.
- Surface elevation of the venthole (SE): Surface elevation of a gob gas venthole and the overburden depth (or drilling depth) to the coal seam affects the atmospheric pressure at the wellhead. Both parameters affect the performance of a gob gas venthole (please also see “overburden depth of the gob gas venthole” and “barometric pressure”).
- Panel status information (Active/Completed): Methane concentrations and rates measured in venthole production are related to whether or not the panel has been completed. These observations generally indicate that ventholes start with higher methane concentrations that decline with time, and is associated with the production of available methane in the gob. Thus, in terms of the amount of available methane, information on if the panel is completed is important. - Panel length and width (PL, PW): The increasing size of longwall panels (width and length) usually affects methane emissions due to wider faces and 10