Key Words and Phrases : polynomial-normal densities; distribution theory; ... Limit Theorem, is widely recognized as arti cial. ...... Edgeworth populations.
Distribution Theory and Inference for Polynomial-Normal Densities M. Evans Department of Statistics University of Toronto Toronto, Ontario M5S 1A1 T. Swartz Department of Mathematics and Statistics Simon Fraser University Burnaby, British Columbia V5A 1S6 Key Words and Phrases : polynomial-normal densities; distribution theory; conditional inference; Gram-Charlier approximations; importance sampling.
ABSTRACT This paper considers a class of densities formed by taking the product of nonnegative polynomials and normal densities. These densities provide a rich class of distributions that can be used in modelling when faced with non-normal characteristics such as skewness and multimodality. In this paper we address inferential and computational issues arising in the practical implementation of this parametric family in the context of the linear model. Exact results are recorded for the conditional analysis of location-scale models and an importance sampling algorithm is developed for the implementation of a conditional analysis for the general linear model when using polynomial-normal distributions for the error. 1. INTRODUCTION Parametric statistical inference often relies on an assumption of normality for an error distribution. This assumption, although supported by the Central 1
Limit Theorem, is widely recognized as arti cial. It would therefore be useful if there were a family of distributions that could be used in applied problems to model a variety of non-normal shapes and for which exact (as opposed to asymptotic) inferences were available. In general, the di�culty with exact inference is that it often leads to intractable expressions; expressions involving di�cult and possibly high-dimensional integrals. This paper discusses the family of polynomial-normal densities. These densities are de ned as nonnegative polynomials times normal densities. They can be used in regression analysis to model a wide variety of non-normal shapes. Also the form of these densities allows for the development of algorithms for exact conditional inference methods. These two points suggest that this family can make an important contribution to practical data analysis. In Section 2 a closure property for this family under linear combinations is proved that does not appear to exist in the literature. In Section 3 exact results are obtained for the implementation of a conditional analysis, as discussed in Fisher(1934) or Fraser(1979), of a location-scale model when the distribution form is a known polynomial-normal density. In Section 4 a tting algorithm, for selecting a polynomial-normal density when the distribution form is not known, is developed. In Section 5 the relation of the polynomialnormal family to truncated Gram-Charlier expansions is discussed; see for example Cramer(1946), Kendall and Stuart(1958), Johnson and Kotz(1970) for a discussion of these. Also in Section 5 the relation of the contents of this paper to the work of Bartlett(1935), Gayen(1949, 1950a, 1950b, 1951), Davis(1976) and Geweke(1989) is discussed. In Section 6 an importance sampling algorithm, based on the multivariate t-distribution, is developed for the implementation of a conditional analysis of a general linear model when the error distribution is polynomial-normal. This permits the practical analysis of complicated data sets allowing for highly nonnormal shapes for the error distribution. The development of this algorithm relies intrinsically on the form of the polynomial-normal densities to produce nite variance Monte Carlo estimates for various quantities of inferential interest. This is the most important contribution of the paper and it is the content of Proposition 5. A numerical example of such an analysis is also presented. Copies of Fortran programs for all computer algorithms used in the paper can be obtained by writing the authors.
2
2. THE FAMILY AND SOME DISTRIBUTION THEORY A polynomial-normal density function takes the form � x ? �1 � 1 � x ? �1 � f (x) = kp � (1) �2 � �2 2 where �1 2 0, p is a nonnegative polynomial, � is the N (0; 1) density and the norming constant k is speci ed by Z1 p(x)�(x)dx: (2) k?1 = ?1 We will study this class of densities with no other restrictions on p but note the possibility of examining interesting sub-classes by adding further constraints on the polynomial. Since the moments of the standard normal distribution are all known, the integral (2) can be easily evaluated. Alternatively, as p is a polynomial of degree 2m, the integral (2) can be exactly evaluated by a Gauss-Hermite rule of order m + 1. That is to say mX +1 k?1 = wip(xi) i=1
where the wi and xi are Gauss-Hermite weights and points respectively and this is perhaps the preferred method of evaluation as it avoids the need to calculate high-order moments of the normal. For more information on GaussHermite quadrature, the theory of orthogonal polynomials and quadrature in general, the reader is referred to Davis and Rabinowitz(1984). Similarly, if the random variable X has a polynomial-normal density as speci ed by (1) with deg(p) = 2m, then Z1 E (X n ) = (�1 + �2x)n kp(x)�(x)dx ?1 which can be evaluated exactly by a Gauss-Hermite rule of order d(n + 2m + 1)=2e. We note that the moment calculations can also be obtained by using a lower order Gauss rule corresponding to the particular polynomial-normal density. The weights and points for these quadrature rules can be derived using the algorithm of Golub and Welsch(1969) and Hermite integration or via an algorithm of Kautsky and Golub(1983). In addition to the availability of the moments of X , an application of Rodrigue's formula (see Davis and Rabinowitz(1984)) yields a convenient expression for the distribution function F (x). It is given by � � � X � � � 2m F (x) = � x ?� �1 ? pcjj hj?1 x ?� �1 � x ?� �1 (3) 2 2 2 j =1 3
where � is the distribution function for the N (0; 1), hj is the j th orthonormal Hermite polynomial and Z1 hj (x)kp(x)�(x)dx cj = ?1
which can be evaluated exactly via Gauss-Hermite integration. Therefore given expression (3) and a uniform(0,1) variate u, a random polynomial-normal variate x can be easily generated by solving the equation F (x) = u through bisection. An interesting result concerns the closure of the polynomial-normal family under linear operations. This is developed more fully below and stated precisely in Proposition 2.
Proposition 1: Consider a density function f (x) with corresponding moment generating function m(t). The density f (x) is polynomial-normal of degree 2m if and only if m(t) = e�1t+�22t2=2q(t) where q(t) is a nonnegative polynomial of degree 2m.
Proof : Suppose that f (x) is a polynomial-normal density of degree 2m. Then
it's moment generating function is � x ? �1 � 1 � x ? �1 � Z1 �1t+�22 t2 =2q (t) xt dx = e � e kp � m(t) = �2 �2 ?1 2 where Z1 kp(x + �2t)�(x)dx q(t) = ?1
(4)
is a nonnegative polynomial of degee 2m in2 2t. Conversely suppose that m(t) = e�1t+�2 t =2q(t) for some nonnegative polynomial q of degree 2m. Then the characteristic function corresponding to f (x) is m(it) and by the Inversion Theorem and some straight-forward manipulations we obtain # " 2 Z1 1 � 2 2 2 f (x) = 2� q(it)exp ? 2 (t + 2it(x ? �1)=�2 ) dt ?1 � x ? �1 � 1 Z 1 � iz � 2 = � � �2 ?1 q �2 + (x ? �1)=�2 �(z)dz: 2 R 1 q � iz + (x ? � )=� 2� �(z)dz is a polynomial of degree 2m in x and Now ?1 1 2 �2 since f is a density it must be nonnegative. 4
Note that (4) provides a convenient formula for computing the moment generating function of a polynomial-normal density. However, not all nonnegative polynomials q give rise to valid moment generating functions. The following corollary characterizes those that do.
Corollary 1: Consider a function m(t) = e�1t+�22t2=2q(t) where q is a non-
negative polynomial. Then m is a moment generating function if and only if q(0) = 1 and Z 1 it x q( + )�(t)dt p(x) = ?1 �2 �2 is a nonnegative polynomial. Further when m is a moment generating function it is associated with density (1) where p is given as above and k = 1.
Proof : Suppose that m is a moment generating function. Then 1 = m(0) =
q(0) and the nonnegativity of p follows from the if part of Proposition 1. Conversely put f (x) = p( x?�2�1 )�( x?�2�1 ) �12 and note that f is nonnegative everywhere. Applying the proof of Proposition 1, which does not require f be a probability density, only that m(t) exist in anR open interval about 0, then 1 p(x)�(x)dx which implies q(t) is given by (4) and this implies 1 = q(0) = ?1 f is a density.
Proposition 2: If X1; : : : ; Xn are mutually statistically2 independent random 2
variables and Xi has moment generating function e�1it+�2it =2qi(t) where qi is a nonnegative Y = a1X1 + :P: : + anXn + c has � 1 � y?� �of degree 2mi, then � y?polynomial P � n density p � � � � where � = c + i=1 ai�1i, �2 = ni=1 a2i �22i and p is the nonnegative polynomial of degree 2(m1 + : : : + mn ) given by Z1Y n � ia t a x � qj �j + �j �(t)dt: p(x) = (5) ?1 j =1
Pn aj �1j )t+Pn a2� 2 t2=2 ( c + j=1 j 2j � is e j=1
Proof : The moment generating function of Y Q n q (a t) and thus by Proposition 1, Y has a polynomial-normal density and j =1 j j by Corollary 1, p(x) is given by (5).
The Hermite expansion of p in (5) can be evaluated by Hermite integration and thus we have an exact expression for the density of Y . To deal e�ectively with the polynomial-normal family of densities we require a convenient parametrization of the polynomials. We use the fact that 5
a polynomial is nonnegative if and only if its roots are conjugate pairs. Hence we write m Y p(x) = (�i x ? 1)(�ix ? 1) (6) i=1
where �1; : : : ; �m 2 C and hence 1=�i is a root of p. Note that, by letting some of the �i = 0, with this parametrization we get all nonnegative polynomials of degree less than or equal to 2m which do not have 0 as a root. In particular the normal distribution is obtained as a polynomial-normal density when �1 = : : : = �m = 0. Alternative parameterizations can be chosen which do not exclude the polynomials having 0 as a root; e.g. use the roots rather than the reciprocals of the roots as we have done. Our choice of parameterization is motivated by the tting algorithm developed for this family in section 4. For note that if �i = 0 then the i-th factor is constant and this is an important feature for that algorithm. Little is lost by excluding the polynomials with 0 as a root as the corresponding polynomial-normal density can be approximated by a polynomial-normal density for which p(0) 6= 0. To see this suppose f is any density with rst and second moments �1 and �2. Then for � 2 C ; � ? 1)f (x) is the density obtained g�(x) = (j �j2�2 ? (� + ��)�1 +1)?1 (�x ? 1)(�x by adding a quadratic factor corresponding to the root 1=�. As j � j! 1 we have that g�(x) ! g(x) = �?2 1x2f (x) which is the density obtained by adding the quadratic factor corresponding to the root 0. We denote by Fm the class of polynomial-normal densities of the form (1) where p is a nonnegative polynomial having parametrization (6), and �1 and �2 are de ned by �1 = ?�1�=�2� and �2 = 1=�2� where Z1 xkp(x)�(x)dx �1� = ?1
and
Z1 2 2 �2� + �1� = ?1 x2kp(x)�(x)dx:
Therefore the class of standardized polynomial-normal densities Fm consists of polynomial-normal densities of the form (1) having zero mean, unit variance, deg(p) � 2m and p(0) 6= 0. The correspondence between f 2 Fm and �1; : : : ; �m is not one-to-one as permutations of �1; : : :; �m do not alter the density. However, the correspondence is one-to-one between f 2 Fm and sets f�1; : : :; �k g where k � m and �i 2 C . 6
Since the family Fm is completely determined by �1 ; : : :; �m , there are 2m + 2 free parameters in the location-scale model Y = � + �Z (7) where Z � f 2 Fm. Similarly, in a regression problem with k predictors X1; : : : ; Xk there are 2m + k + 1 free parameters in the model Y = 1X1 + : : : + k Xk + �Z (8) where Z � f 2 Fm . To illustrate the previous theory we consider some examples.
Example 1: Suppose that X1; : : : ; Xn is a sample from the distribution
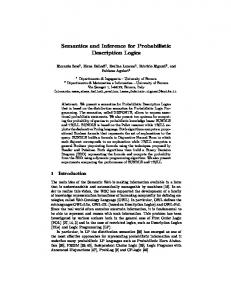
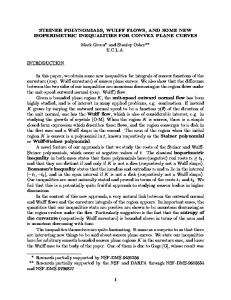
with polynomial-normal density f (x) = kp(x)�(x) = (1 + j�j2)?1(�x ? 1)(�x ? 1)�(x) for some � 2 C . It is easy to verify that the mean and variance of Xi are given by � = ?(� + �)=(1 + j�j2) and �2 = (3j�j2 + 1)=(1 + j�j2) ? �2 respectively. � Proposition � � 2 we have that the density of Y = X1 + : : : + Xn is �Using pn pyn p1n � pyn where ! Z1 it x n q pn + pn �(t)dt pn (x) = ?1 ! #n Z 1 "Z 1 it x = ?1 ?1 kp pn + pn + z �(z)dz �(t)dt: The polynomial pn can be evaluated exactly using Gauss-Hermite rules for both the inner and outer integrals. However, the best way to do this, when repeated calculations of pn (x) are required, is to rst evaluate the Hermite expansion of q and then of pn , as this cuts down on the amount of computation. To consider a speci c case we choose the complex number � = (1; 1) and p plot the density of the standardized variate Z = n(X ? �)=� for n = 1 (Figure 1) and for n = 5 (Figure 2). The densities are plotted alongside the N (0; 1) density for comparison purposes. From these plots we see that although the underlying distribution is strikingly di�erent from the normal, the Central Limit Theorem is providing a good approximation by the time n = 5.
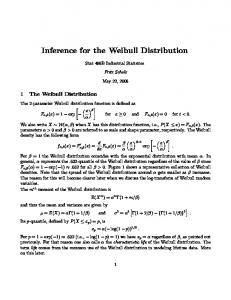
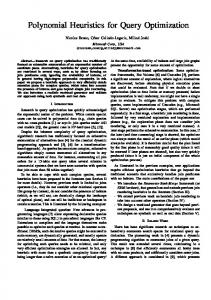
Example 2: In this example we consider the underlying density f (x) = Q 4 k i=1(�ix ? 1)(�i x ? 1)�(x) where �1 = (0; 1), �2 = (1=2; 1=2), �3 = (1; 0) and 7
�4 = (2; 1=2). In Figures 3 and 4 we give the plots of the standardized densities for n = 1 and n = 5 respectively together with plots of the N (0; 1) density. We see that in this example the normal distribution is not providing a good approximation. As n increases the normal will inevitably be adequate by the Central Limit Theorem. The point of this example is to show that the normal approximation cannot always be relied upon with this family. Thus the exact distribution must be computed or some alternative approximation technique used. In the following sections we develop the conditional approach to inference with these models and show how to use Monte Carlo to obtain accurate approximations to the conditional distributions of statistics of interest. 3. INFERENCE In this section we consider inference for the parameters � and � in the location-scale model (7) when we assume that the underlying density f 2 Fm is known. In Section 5 we discuss the selection of the nonnegative integer m and the polynomial-normal density f 2 Fm. Consider then a sample y1; : : : ; yn from the location-scale model (7) where we de ne s2y = ky?y1k2, s2 = kz ?z1k2 and d = (y?y1)=sy = (z ?z1)=s. Since z is a sample from the polynomial-normal distribution f 2 Fm, any functional of z has a distribution which is independent of the location parameter � and the scale parameter �. Therefore quantities such as z, s and d all have distributions that do not depend on (�; �). In the case where � is known, inferences concerning � can be based on the pivotal z = (y ? �)=�. For example, the distribution of z can be obtained from Proposition 2 and using the formula for the cdf given in (3), constants a1 and a2 can be found such that P (a1 � z � a2) = :95 It follows that a 95% con dence interval for � is given by (y ? a2�; y ? a1�). In the case where � is unknown, marginal inference concerning the parameters � and � can be based on the pivotal quantities t = z=s = (y ? �)=sy and s = sy =� respectively. In general, the distributions of the random variables s and t are computationally di�cult. However, for the class of standardized polynomial-normal densities (ie. z � f 2 Fm), the distributions are manageable, at least for small to moderate n, and are given in Corollaries 2 and 3 respectively. This approach is referred to as the unconditional approach. It has been argued (see Fisher(1934) or Fraser(1979)) that the conditional approach is the preferred approach for the analysis of the location-scale model (7) and more generally for the regression model (8). In the conditional analysis we proceed as above except that we base our inferences on the pivotals s and t conditioned on the observed value of the statistic d. This simpli es 8
calculations and is partly justi ed by the fact that d is an ancillary statistic. The conditional distributions of s and t are given in Propositions 3 and 4 respectively. We note that in the case of a normal error the conditional and unconditional approaches are exactly the same since d is independent of both s and t. Thus the polynomial-normal family o�ers an opportunity to compare the conditional and unconditional analyses for a non-normal family. First we consider the distribution of s where we denote the density of a Chi(n) variable by gn (s) = sn?1 e?s2=2=[2(n?2)=2?( n2 )].
Proposition 3: Consider the location-scale model (7) based on a sample of size n. The conditional density of s given d is given by �s� 1 s>0 gsjd (sjd) = r(d)p1(s; d)gn?1 � � 2 2 where r?1(d) = R01 p1(�2s; d)gn?1 (s)ds is the inverse of the norming constant and Z1Y n p p1(s; d) = ?1 kp(u= n + sdi =�2)�(u)du is a positive polynomial in s.
i=1
Proof : Since z1; : : : ; znQisn a sample distribution, � z ?�from � 1 the � � z ?polynomial-normal �
the joint density of z is i=1 kp i�2 1 �2 � i�2 1 . Letting P = (p1; : : : ; pn?1 ) be an orthonormal basis of L? (1) � 2 to ensure nonnegativity. We now show that the method given in Section 4 for tting is consistent when we have a location-scale model with Z � g 2 Gm. The distribution function for such a g takes the form, following (3), G(x) = �(x) + r(x)�(x) where r(x) is a polynomial of degree less than 2m. Hence if we specify G at l � 2m points xi then this speci es the value of r(x) = (G(x) ? �(x))=�(x) at l points. Since r is a polynomial of degree less than 2m these values completely prescribe r and hence g. This together with Lemma 1 implies that if we t g 2 Gm by minimizing (10) over such g then this gives a consistent estimate as well. This result supports our approach to tting elements of Fm and our conjecture that f 2 Fm is prescribed by the values of its distribution function at 2m points. The traditional approach to tting Gram-Charlier densities cannot be applied to t a general element of Fm since �1 and �2 in (1) are complicated functions of the moments of f which we have not been able to obtain in closed form. Hence we developed the alternative approach of section 4. Also, the Gram-Charlier series for f 2 Fm n Gm need not converge; for a discussion of the convergence of such series see Kendall and Stuart(1958). Geweke(1989) has used the method of maximum likelihood to t GramCharlier densities. We have also experimented with maximum likelihood in the tting of polynomial-normal densities. Like Geweke(1989), we have experienced the di�culties associated with multimodal likelihoods. For this reason, and some of the reasons stated above, we prefer our algorithm of tting by quadratic factors. Previous authors have also developed distribution theory results when the basic density is a polynomial times a normal density. Bartlett(1935) derives an 16
asymptotic expression for the unconditional density of the t-statistic when the polynomial is of degree 4, not necessarily nonnegative and with retrictions on the coe�cients. Under similar assumptions Gayen(1949, 1950a, 1950b, 1951) derives asymptotic expressions for the unconditional densiities of many statistics of inferential interest. Under the assumption that the basic density has a Gram-Charlier expansion, Davis(1976) derives asymptotic series expressions for the unconditional densities of many statistics. In section 6 we develop an algorithm which permits the computation of conditional probabilities to practically meaningful accuracies for any statistic when the model is a linear model with polynomial-normal error. 6. COMPUTATIONS FOR REGRESSION Whereas exact expressions can often be obtained for the distributions of quantities of inferential interest, these expressions do not necessarily provide the best approach to implementing the computations. This is particularly true in the regression context, where instead, we consider a version of adaptive importance sampling. Adaptive importance sampling ideas have been used by various authors including Smith et. al.(1987), Evans, Gilula and Guttman(1989) and Oh and Berger(1992). In the regression model (8) we de ne sy = ky ? X ^ k, s = kz ? Xbk and d = (y ? X ^ )=sy = (z ? Xb)=s where ^ = (X 0X )?1 X 0y, b = (X 0X )?1 X 0z and X = (x1; : : :; xk ). Inference concerning � is based on the conditional distribution of s = sy =� given d and inference concerning is based on the conditional distribution of t = b=s = ( ^ ? )=sy given d. To implement a conditional analysis we need to be able to calculate conditional expectations of various functions of (b; s); e.g. to tabulate the conditional distribution function of ti which then leads to conditional con dence intervals for i. While we don't need the explicit form of the joint density of (b; s) to describe our algorithm, an unnormalized version is given in (15). It turns out to be convenient for the necessary integrations to make the transformations (b; s) ! (t; s) and (t; s) ! a where 1 0 p n ? kRt a = @ q2(n ? k)log(s=pn ? k) A
X = QR, R is an upper triangular matrix with positive diagonal elements, and Q is a column-orthonormal matrix. With normal errors, the vector a is asymptotically normal with mean vector 0 and variance-covariance matrix I . Denote the unnormalized conditional density of a given d, obtained from 17
(15) and the transformations, by L(ajd). Thus the general problem is to calculate Z1 Z1 E [ujd] = ?1 u(a)L(ajd)da = ?1 L(ajd)da (12) for various functions u. Note that the denominator is the norming constant. If we generate values a1; : : : ; aN from a density w on N3 implies j n1 ni=1 IB (zi) ? P (B )j < �=4. Putting the above pieces together, we have that n > maxfN1; N2; N3g implies n p X j n1 IA( n ? 1di ) ? P (A)j i=1 n n n p X X X 1 1 1 � j n IA( n ? 1di ) ? n IA(zi)j + j n IA(zi) ? P (A)j i=1 i=1 i=1 n n X X 1 1 � n IB(zi) + �=2 � j n IB (zi) ? P (B )j + P (B ) + �=2 i=1 i=1 � �=4 + �=4 + �=2 = � and this establishes the result for nite intervals. A straightforward modi cation gives the result whenever jaj or jbj is in nite.
Proof 2 : We have that g(x) is a density if and ?only if 1 = R 1 g(x)ofdx Lemma 1 2 = ai and qi(x) � 0. Given that ai = 1, qi(x) = ciDi x + (bi ? ?1 ciDi?1 �3i)x +1 ? ciDi?1 , for qi(x) � 0, the coe�cient of x2 must be nonnegative. That is, ciDi?1 � 0. In addition for qi(x) � 0, the discriminant corresponding to the equation qi(x) = 0 must be nonpositive. That is, (bi ? ciDi?1 �3i)2 ? 4ciDi?1 (1 ? ciDi?1 ) � 0. Together these last two inequalities imply 0 � ci � Di and the result follows.
ACKNOWLEDGEMENTS Both authors were supported in part by grants from the Natural Sciences and Engineering Research Council of Canada. The authors thank two referees for a number of constructive and useful comments.
BIBLIOGRAPHY Andrews, D.F. and Herzberg, A.M. (1985). Data. Springer-Verlag. 22
Bartlett, M.S. (1935). The e�ect of non-normality on the t distribution. Proc. Cam. Phil. Soc., 223-231. Cramer, H. (1946). Mathematical Methods of Statistics. Princeton University Press. Davis, A.W. (1976). Statistical distributions in univariate and multivariate Edgeworth populations. Biometrika, 63, 3, 661-670. Davis, P.J. and Rabinowitz, P. (1984). Methods of Numerical Integration, Second Edition. Academic Press. Evans, M., Gilula, Z. and Guttman, I. (1989). Latent class analysis of twoway contingency tables. Biometrika, 76, 557-562. Evans, M. and Swartz, T. (1988). Sampling from Gauss rules. SIAM J. Sci. Stat. Comput., Vol. 9, No. 5, 950-961. Fisher, R.A. (1934) . Two new properties of mathematical likelihood. JRSSA, 144, 285-307. Fraser, D.A.S. (1979). Inference and Linear Models. McGraw-Hill Inc. London. Gayen, A.K. (1949). The distribution of Student's t in random samples of any size drawn from non-normal universes. Biometrika, 36, 353-369. Gayen, A.K. (1950a). Signi cance of di�erence between the means of two non-normal samples. Biometrika, 37, 399-408. Gayen, A.K. (1950b). The distribution of the variance ratio in random samples of any size drawn from non-normal universes. Biometrika, 37, 236255. Gayen, A.K. (1951). The frequency distribution of the product-moment correlation coe�cient in random samples of any size drawn from non-normal universes. Biometrika, 38, 219-247. Geweke, J. (1989). Modelling with normal polynomial expansions. In Economic Complexity. Chaos, Sunspots and Nonlinearity. Edited by W.A. Bennett, J. Geweke and K. Shell. Cambridge Univ. Press. Golub, G.H. and Welsch, J.H. (1969). Calculation of Gauss quadrature rules. Math. Comp. 23 221-230. 23
Johnson, N. and Kotz, S. (1970). Continuous Univariate Distributions. Houghton Mi�in Company. Kautsky, J. and Golub, G.H. (1983). On the calculation of Jacobi matrices. Linear Algebra Appl. 52/53 439-455. Kendall, M. and Stuart, A. (1958). The Advanced Theory of Statistics, Vol. 1, Distribution Theory. Charles Gri�n and Company. Muirhead, R.J. (1982). Aspects of Multivariate Statistical Theory. John Wiley & Sons, Inc. New York. Oh, M-S. and Berger, J.O. (1992). Adaptive importance sampling in Monte Carlo integration. To appear in J. Stat. Comp. and Simul. Ser ing, R.J. (1980). Approximation Theorems of Mathematical Statistics. John Wiley & Sons, Inc. New York. Smith, A.F.M., Skene, A.M., Shaw, J.E.H. and Naylor, J.C. (1987). Progress with numerical and graphical methods for practical Bayesian statistics. The Statistician, 36, 75-82.
24