Analyses of the peaks were performed with the CasaXPS software, using a weighted sum of Lorentzian and Gaussian components curves after Shirley.
SUPPORTING INFORMATION In-situ preparation of ultra-small Pt nanoparticles within rod-shaped mesoporous silica particles: 3-D tomography and catalytic oxidation of n-hexane Laura Uson[a],
[b]
, Jose L. Hueso[a],[b],*, Victor Sebastian[a],[b],*, Raul. Arenal[c],[d], Ileana
Florea[e],[f], Silvia Irusta[a],[b], Manuel Arruebo[a],[b], and Jesus Santamaria[a],[b]
Experimental Details Materials and characterization NH4F (98%, ACS reagent, Fluka), Pluronic P123 (Sigma), hydrochloric acid (HCl 36%, Sigma), tetraethylorthosilicate (TEOS, 98%, Sigma), heptane (99%, Reagent Plus, Sigma), triethoxysilane (APTES, 98%, Sigma), chloroplatinic acid solution (HPtCl6, 8wt%, Sigma), tetrakis (hydroxyme-thyl)phosphonium chloride solution (THPC, 80% in H2O, Sigma). Catalytic tests A fixed-bed quartz reactor (3.95 mm of internal diameter) containing 40 mg of catalyst was placed with the aid of glass wool (catalyst bed of ~3.5 cm). The total gas flow rate was adjusted to reach a gas hourly space velocity (GHSV) of 31000 h−1 and the concentration of n-hexane used was 200 ppm. Total flow rates were 8.4 mL min−1 for oxygen, 31.6 mL min−1 for nitrogen and 8 μL min−1 for hexane. Two reaction cycles were initially carried out at predetermined temperatures starting from 25 °C up to 300 ºC. Before each measurement, the catalysts were stabilized at each selected temperature for 60 minutes to ensure stable conversions. Subsequently, the catalysts were reduced in the presence of N2/H2 (volume ratio 71.5/28.5) at 250 ºC for 30 minutes (heating ramp: 1.5 ºC min−1) and tested again under SI-1
reaction conditions.
The reaction temperature was measured by a mobile thermocouple
located at the surface of the corresponding catalyst in the gas exhaust side. Temperature deviations were negligible (maximum temperature deviations with respect to the set point were less than 4 °C). Catalyst deactivation studies were carried out at 160 ºC and n-hexane conversions of 40% during 70 h. The gases were analyzed by online gas chromatography (Agilent 3000 Micro GC) which under our experimental conditions gave an n-hexane detection limit of 3 ppm. Maximum error in the mass balance closures for carbon and oxygen was ± 2 %. T90 values were defined as the temperatures at which 90% n-hexane conversion were reached.
Characterization methods The specific surface area and pore-volume distribution were measured by nitrogen adsorption at 77 K in a Micromeritics ASAP 2020; samples were out-gassed at 26.7 Pa and 623 K for 6 h before the measurement. The morphology and distribution of the porous particles were also characterized by field-emission scanning electron microscopy (SEM) using a FEI Inspect instrument. The ordered mesoporous structure, phase identification and purity of the SBA-15 were studied by low angle X-ray diffraction. The patterns were recorded in a Philips X-Pert diffractometer equipped with a monochromatized Cu-Kα radiation (40 kV, 20 mA) over the range 0.6–10.0° with a step of 0.02°and an analysis time of 5 s. TGA was employed to confirm the presence of amino groups on the functionalized mesoporous silica. Measurements were carried out using a heating rate of 5 ºC min-1 until 900 ºC using a N2 flow of 15 mL min−1 (TA Instruments™ Thermogravimetric Analyzer).
X-ray
photoelectron analysis (XPS) was performed with an Axis Ultra DLD (Kratos Tech.). The spectra were excited by the monochromatized AlKα source (1486.6 e.V) run at 15 kV and 10 mA. For the individual peak regions, a pass energy of 20 eV was used. Survey spectrum was SI-2
measured at 160 eV pass energy. Analyses of the peaks were performed with the CasaXPS software, using a weighted sum of Lorentzian and Gaussian components curves after Shirley background subtraction. The binding energies were referenced to the internal C 1s (284.5 eV) standard. The amount of Pt incorporated within the SBA-15 supports was determined by absorption emission spectroscopy (SpectraAA 110 Varian working at λ = 265.9 nm) after sample digestion with aqua regia in a microwave oven (Milestone Ethos Plus). It was found that the Pt-SBA-15 catalyst contained a 3 wt.% Pt, whereas the theoretical load was calculated to be 6.8% . For the transmission electron microscopy (TEM) analysis, the samples were prepared by dispersing the particle powders in ethanol. The dispersions were ultrasonicated and a dropcasted on a 3 mm copper grid supporting a very thin carbon membrane transparent to the electron beam. High resolution TEM was performed employing an imaging-side aberrationcorrected FEI Titan-Cube microscope working at 80 keV, equipped with a Cs corrector (CETCOR from CEOS GmbH). The high-resolution scanning TEM (HR-STEM) studies and electron tomography measurements were performed on a probe-corrected STEM FEI TitanLow-Base 60-300 operating at 80 keV (fitted with a X-FEG® gun and Cs-probe corrector (CESCOR from CEOS GmbH)). The acquisition of the STEM-HAADF tilt series was performed using the tomography Inspect-3D software. Under such imaging conditions, in first approximation, the intensity in the corresponding images is proportional to the square of the atomic number (Z), having access to a Z-contrast[1-3]. The tilt series were obtained by tilting the specimen in the angular range of 70° using an increment of 2.5° in the equal mode, giving thus a total number of images equal to 57 images in each series. After the acquisition the images of the tilt series were spatially aligned using first a rough alignment by cross correlating each two consecutive images. A fine alignment was performed using the position of the small Pt particles as markers. The alignment procedure is implemented in the IMOD software[4]. For the volume calculation, SI-3
we have used iterative methods which are more accurate than the one-step ones, providing high quality reconstruction volumes even from series with a quite limited number of projections. The algebraic reconstruction techniques (ART)[5] implemented in the TomoJ plugin[6] working in the ImageJ software[6] were thus used to compute the reconstructed volumes. Finally, the visualization and the analysis of the final volume were carried out using the displaying capabilities and the iso-surface rendering method in the Slicer software[7]. It is worth noting that no evidence of irradiation damage in the samples was detected during the tilt series acquisition.
SI-4
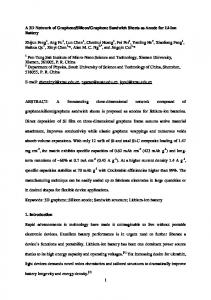
Figure S1. Characterization of the SBA-15 rods supports: (a) SEM image of SBA-15 Nanorods (inset with TEM magnification; scale bar = 100 nm). (b) Low angle XRD patterns of the SBA-15 rods. (c) Adsorption-Desorption nitrogen isotherms of the nanorods after SI-5
calcination and after functionalization with APTES. SBA-15 rods have dimensions of a few hundred nanometers with ordered channels running along their longitudinal axis. The lowangle XRD patterns (Figure 1b) confirm the characteristic hexagonal pore ordering of SBA15 mesostructures with three well-defined peaks in the 2θ range 1–3°, corresponding to the (1 0 0), (1 1 0), and (2 0 0) planes of the SBA-15 mesoporous structure with p6mm symmetry [8, 9] . The N2 adsorption isotherms (Figure 1c) retrieved can be classified as type IV, which are associated to mesoporous structures[10]. The hysteresis corresponds to H1 type characteristic of well-defined cylindrical pores and a uniform pore-size distribution. The hysteresis could be also consistent with the presence of large mesoporous [11]. BET surface areas of 650 m2·g−1were obtained for the calcined SBA-15 rods. These values decreased to ca. 350 after the amination step due to deposition of an additional Si layer and the amino grafting on the pore wall surface. The organic modification was confirmed by TGA. Aminografted SBA-15 supports showed weight losses (3.2 wt. %) in the range of 300 to 500 ºC, attributed to the decomposition of APTES in a nitrogen atmosphere[10]. Pore sizes and specific pore volumes were also calculated using the BJH theory taking into account the desorption branch of the isotherms. Pore sizes for the SBA-15 rods were estimated at 9.6 nm and they diminished after amination to 8.7 nm. Pore volumes were also reduced from 1.3 to 1.0 cm3·g−1 after the amination step. Therefore, amination strongly reduced specific surface areas and pore volumes of the parent materials due to surface grafting and partial poremouth blocking.
SI-6
Figure S2: FT-IR spectra of the SBA-15 rod supports before and after APTES functionalization with especial attention paid to CH2 stretching vibration modes present in the functionalized sample. Fourier transform infrared spectroscopy (FT-IR) was able to identify stretching vibrations corresponding to CH2 bonds in the amine-functionalized sample. This feature was not observed in the original SBA-15 sample and is indicative of the presence of the alkyl groups of APTES onto the surface of the mesoporous supports.
SI-7
Figure S3: Microscopy Analysis of the Pt-SBA15 rod catalyst: (a) Low-magnification TEM image; (b) High-magnification TEM image of a Pt/SBA-15 Rod; (c)-(d) STEM-HAADF images of a Pt/SBA-15 Rod to show that Pt NPs are anchored following the mesoporous pattern; (e) particle size histogram obtained from microscopy measurements; (f) Representative EDX spectra of the main composition detected.
SI-8
Figure S4: Influence of the amination step: (left tube) aqueous dispersion containing SBA-15 without APTES modification and Pt NPs after centrifugation; (right tube) Amine-grafted SBA-15 and Pt NPs after centrifugation; total volume in both tubes is approximately 2.5 mL. Figure S3 shows the influence of APTES and the necessity of the amination step in order to obtain a good electrostatic attraction of the Pt NPs. Nitrogen acts always as a donor stabilizing the Pt(II) and Pt(IV) complexes. The aqueous dispersion containing the SBA-15 rods without functionalization has a dark colour in the supernatant (left centrifuge tube). In contrast, the amine-grafted SBA-15 rods exhibit a clear and transparent supernatant after centrifugation and the entire solid at the bottom of the tube preserves the dark colour of the NPs (right centrifuge tube). Therefore, the SBA-15 rods precipitated at the bottom of the tubes are properly coated in the latter case where APTES pre-functionalization has been carried out and no-free Pt NPs are suspended in solution. SI-9
0s
30 s 60 s 100 s
208
204
200
196
Binding energy (eV)
Figure S5. Multiple XPS analysis of the initial catalysts at different etching rates to confirm the absence of chlorinated species on the surface of the catalyst.
SI-10
Figure S6. Representative XPS profile of Pt-4f including the main binding energies associated to Pt(0) and Pt(δ+) states and the corresponding fitting to accommodate the Pt4f7/2 and Pt4f5/2 doublets.
SI-11
Figure S7. Evaluation of the catalytic stability and the n-hexane conversion of the catalyst after operating on stream for 70 hours at a fixed temperature of 160 ºC that corresponds to a 40% conversion of n-hexane; All the experiments were carried out with a GHSV = 31000 h−1 and an n-hexane concentration of 200 ppm.
SI-12
Figure S8. HRTEM/STEM-HAADF images corresponding to the Pt-SBA-15 catalyst after 70 h on reaction stream. Note that most of the bigger Pt nanoparticles appear in the outer fraction of the silica rods.
SI-13
Figure S9. (Left) 3D model of the nanoparticle obtained by a segmentation procedure from a reconstructed HAADF-STEM tilt series, with the mean surface of the mesoporous SAB-15 material in blue and the Pt nanoparticles in red respectively, highlighting the XZ slices selected; (Right) Slices taken through the XZ plane showing more clearly the presence of the small Pt NP 1.5-3 nm. The different slices are marked as 2-4 in the 3D model.
SI-14
Supporting References [1]
L.C. Liu, U. Diaz, R. Arenal, G. Agostini, P. Concepcion, A. Corma, Nat Mater 16
(2017) 132-138. [2]
S. Moldovan, R. Arenal, O. Ersen, in: F.L. Deepak, A. Mayoral, R. Arenal (Eds.),
Advanced Transmission Electron Microscopy: Applications to Nanomaterials, Springer International Publishing, Cham, 2015, pp. 171-205. [3]
K. Sohlberg, T.J. Pennycook, W. Zhou, S.J. Pennycook, Phys Chem Chem Phys 17
(2015) 3982-4006. [4]
D.N. Mastronarde, J. Struct. Biol. 120 (1997) 343-352.
[5]
R. Gordon, R. Bender, G.T. Herman, J. Theor. Biol. 29 (1970) 471-&.
[6]
C. Messaoudil, T. Boudier, C.O.S. Sorzano, S. Marco, BMC Bioinformatics 8 (2007).
[7]
http://www.Slicer3D.org.
[8]
X. Cui, S.-W. Moon, W.-C. Zin, Mater. Lett. 60 (2006) 3857-3860.
[9]
D.Y. Zhao, J.L. Feng, Q.S. Huo, N. Melosh, G.H. Fredrickson, B.F. Chmelka, G.D.
Stucky, Science 279 (1998) 548-552. [10]
L. Uson, M.G. Colmenares, J.L. Hueso, V. Sebastian, F. Balas, M. Arruebo, J.
Santamaria, Catal Today 227 (2014) 179-186. [11]
J.R. Matos, M. Kruk, L.P. Mercuri, M. Jaroniec, L. Zhao, T. Kamiyama, O. Terasaki,
T.J. Pinnavaia, Y. Liu, J Am Chem Soc 125 (2003) 821-829.
SI-15