it suitable for high security access control application. The three main .... Development Environment ... interface whic
2009 Sixth International Conference on Fuzzy Systems and Knowledge Discovery
DSP-Based Implementation and Optimization of an Iris Verification Algorithm using Textural Feature Richard Yew Fatt Ng, Yong Haur Tay, Kai Ming Mok Computer Vision and Intelligent Systems (CVIS) group Universiti Tunku Abdul Rahman (UTAR), Petaling Jaya, Malaysia
[email protected], {tayyh, mokkm}@utar.edu.my from Cartesian coordinates to Polar coordinates. The iris image has low contrast and non-uniform illumination caused by the position of the light source. All these factors can be compensated by applying local histogram equalization [4]. The paper presents an innovative method for feature extraction and template matching stages. The iris region is divided into three zones according to the characteristic of the iris texture. Texture of the iris in each zone is analyzed in terms of the discriminating frequency information. Log Gabor filters with different center frequency are chosen accordingly to extract the most significant texture features of the iris. Different weightings are selected for each zone based on its contribution to the verification [5]. In this paper, iris verification algorithm with high speed and accuracy and its implementation on embedded processor are presented. The prototype demonstrates that the compact size DSP-based iris verification system is suitable for portable devices. Digital signal processor technology provides a low power and fast authentication solution for iris verification system.
Abstract In this paper, iris verification algorithm using textural feature and its implementation and optimization on Digital Signal Processor (DSP) are presented. An innovative method is proposed to extract the iris textural feature. The method evaluates on iris images taken from the CASIA iris image database version 1.0 [1]. Experimental results show that the proposed method has achieved high accuracy of 98.62%. For the DSP implementation, the algorithm is mapped into DSP without compromising performance. Optimization is done by source code tuning, loop optimization using pragmas and optimizing conditional code. Experimental results demonstrate that the iris verification system is capable to complete verification in less than one second. The DSP based iris verification system provides a low power and fast authentication solution within a compact device.
1. Introduction
2. Iris Segmentation
Due to raising security concern, access control has become important in protecting resources for authorized personnel. Biometrics is reliable because it is based on inherent traits of a person which is difficult to steal, forged or being forgotten. This leads to the awareness of the importance of biometrics. Iris recognition is one of the most reliable and accurate biometric identification, which makes it suitable for high security access control application. The three main stages of an iris verification system are image preprocessing, feature extraction and template matching. The iris image needs to be preprocessed to obtain useful iris region. Image preprocessing is divided into three steps: iris localization, iris normalization and image enhancement. Iris localization detects the inner and outer boundaries of iris. Iris normalization converts the iris image 978-0-7695-3735-1/09 $25.00 © 2009 IEEE DOI 10.1109/FSKD.2009.757
Iris segmentation method is described in this section. It includes the iris inner and outer boundaries localization, eyelashes, reflection and pupil noise removal algorithm.
2.1 Iris Inner Boundary Localization First, the pupil is detected using thresholding operation. An appropriate threshold is selected to generate the binary image which contains only the pupil. Morphological operator is applied to the binary image for removing the reflection inside the pupil region and other dark spots caused by the eyelashes. Since the inner boundary of an iris can be approximately modeled as a circle, circular Hough transform is used to 374
localize the iris [6]. First, the edge detector is applied on the binary image to generate the edge map. Gaussian filter is applied to smooth the image by selecting the proper scale of edge analysis. The center coordinate and radius of the circle with maximum number of edge points are defined as the pupil center and iris inner boundary respectively.
Reflection
Eyelashes
Pupil
Figure 2. Normalized iris image with eyelashes and reflection noises.
2.2 Iris Outer Boundary Localization
pupil,
Figure 3. Enhanced iris image.
4. Feature Extraction (a) (b) Figure 1. (a) Right and left search regions of the iris image. (b) Iris inner and outer boundaries localization.
An iris has many unique texture features, especially inside the pupillary zone. Based on texture analysis, local spatial pattern of the iris consists of orientation and frequency information. Frequency information is discriminant for iris recognition [9]. 1D Log Gabor filter is used to extract the frequency information which represents the iris textures. A Log Gabor filter is a Gaussian transfer function on a logarithmic scale [7]. It has narrow band pass filter to remove the DC components caused by background brightness. The 1D Log Gabor filter on the linear frequency scale has a transfer function as in (1).
To locate the iris outer boundary, the method selects two search regions including the outer iris boundary. The pupil center is referred as origin. The search region is a sector with a radius from pupil boundary to a maximum radius. The intensities of each radius in the two search regions are added up. The right and left iris boundaries are the maximum difference between the sum of intensities of two outer radii and two inner radii. Fig. 1 shows the results of iris inner and outer boundaries localization.
G(w) exp(( log( w / w0 ) 2 ) / 2(log( k / w0 )) 2 )
2.3 Eyelashes, Reflection and Pupil Noise Removal
(1)
where w0 denotes the filter’s centre frequency and k denotes the bandwidth of the filter. The ratio k/w0 is set to be constant to generate consistent filter shape [8]. The iris feature is extracted based on texture analysis. It is observed that the inner zone Z1 contains the finest iris texture. The finest texture can be extracted using Log Gabor filter with high center frequency, w0. The middle zone Z2 with larger block of texture is processed using filter with a lower center frequency. A coarsest filter with lowest center frequency is used to capture the flattest texture in the outer zone Z3. The phase information is quantized into four quadrants in the complex plane. Each quadrant is encoded with two bits code to generate the template. The phase information is extracted because it provides the discriminating information for recognizing irises from different people. It does not depend on extraneous factors, such as illumination and imaging contrast.
Reflection regions are characterized by high intensity values close to 255. A high threshold value can be used to separate the reflection noise. The eyelashes and pupil noises are observed to have lower intensity values. A simple thresholding technique is applied to segment the eyelashes and pupil noises accurately.
3. Normalization and Enhancement Iris may be captured in different sizes with varying imaging distances. Normalization remaps each pixel in the localized iris region from the Cartesian coordinates to Polar coordinates. The normalized iris image with the pupil, eyelashes, and reflection noises is illustrated in Fig. 2. The normalized iris image has low contrast and nonuniform illumination caused by the position of the light source. Local histogram analysis is applied to the normalized iris image to reduce the effect of the nonuniform illumination and obtain a well-distributed texture image. Fig.3 illustrates the enhanced iris image.
375
5. Template Matching
ROC Curve
HD
(templateA templateB ) maskA maskB maskA maskB
FAR (False Acceptance Rate)
Hamming distance is defined as the measure of dissimilarity between two binary templates [2, 3]. A value of zero would represent a perfect match. The two templates that are completely independent would give a Hamming distance near to 0.5. A threshold is set to decide whether the two templates are from the same iris or different irises. The fractional hamming distance is the sum of the exclusive-OR between two templates over the total number of bits as in (2). Masking template is used in the calculation to exclude the noise regions. (2)
0.05 0.04
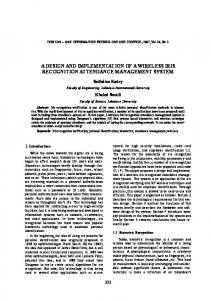
EER=1.38%
0.03 0.02 0.01 0.00 0.00
0.01
0.02
0.03
0.04
0.05
0.06
FRR (False Rejection Rate)
Figure 4. ROC Curve for iris verification results.
Total hamming distance is the summation of Hamming distances from three different zones with different weightings as in (3). (3) THD HD1 HD2 HD3 where HDi, i=1,2,3 denotes the Hamming distances between two templates computed from three different zones, Z1, Z2 and Z3. α, β and γ represent the weightings of the Hamming distance for zone Z1, Z2, and Z3 respectively. The weightings must satisfy the condition defined as in (4).
1
0.06
(a) (b) (c) Figure 5. (a) An occluded eye. (b) A defocused eye. (c) A motion blurred eye.
7. Development Environment
(4)
The iris verification system is implemented on Blackfin processor, ADSP-BF561 [10]. It is widely used for image and video processing. Blackfin is a new processor type known as convergent processor. It provides signal processing and microcontroller (MCU) functionality in a unified architecture. Therefore, Blackfin processor is suitable for computer vision algorithms which are controloriented and computationally intensive. The iris verification algorithm is realized on ADSP-BF561 EZ-KIT LITE evaluation board [11]. It is a low cost hardware platform that includes the Blackfin processor and other devices such as video decoder, video encoder, Synchronous Dynamic Random Access Memory (SDRAM) and etc.
α, β and γ have decreasing weightings because the inner zone provides more texture information than the outer zone. Zone Z1 contains most of the significant texture features that contribute to the verification. Outer zone has less discriminating information and is often occluded by the eyelids and eyelashes.
6. Performance Evaluation In order to evaluate the performance of the proposed algorithm, CASIA iris image database version 1.0 [1] is chosen for validation. It contains 756 iris images from 108 different irises. Fig. 4 shows the ROC plot to evaluate the verification performance. In this experiment, the best performance of 1.38% EER is achieved. It is noted that the result is not perfect due to low quality of the iris images. The iris region is heavily occluded by the eyelids and the eyelashes or distorted due to the pupil dilation and constriction. Some of the iris images are in defocused or motion blurred condition as shown in Fig. 5. Image quality assessment is needed to select clear images with high quality for the verification purpose.
7.1
Integrated software development debugging environment (IDDE)
and
The IDDE provided by Analog Devices Inc is VisualDSP++ 5.0 [12]. It is a user friendly environment which includes C/C++ compiler, assembler, expert linker, loader, run-time library, simulator and hardware emulator. The software development tools provide easy-to-use interface which speeds up development time and reduces design errors.
376
(L2) on-chip memories. On-chip memory supports instruction execution in fastest speed with minimum latency. DSP is well suited for Fast Fourier Transform (FFT) algorithm required in the feature extraction stage.
7.2 System Architecture Blackfin A-V EZExtender Board SDRAM CMOS Sensor TV Tuner
Parallel DMA peripheral controller interface 1 Core/system bus interface
7.2.3 Video Encoder. In the encoding part, the localized iris images and the verification results are transferred to the video encoder. Multiple peripherals are chained to build up the video channels. The peripherals include SDRAM, core/system bus, DMA channel and PPI. The video encoder converts the digital data into its corresponding analog TV signal output. A TV tuner is used to convert the analog signal into digital video format for display on the computer monitor.
Blackfin processor Video encoder
Parallel peripheral interface 2
DMA controller Blackfin processor
EZ-KIT LITE Evaluation board
Figure 6. System architecture for embedded iris verification system
7.3 Optimization and Performance Profile
The embedded iris verification system is implemented on ADSP-BF561 EZ-KIT LITE evaluation board, which is based on the Blackfin ADSP-BF561 dual-core processor. The system comprises of three parts, decoding part, encoding part and DSP processing part. Fig. 6 illustrates the system architecture of the embedded iris verification system.
The optimization strategies such as source code tuning, compiler’s pragmas, and conditional code optimization are implemented to obtain the best code execution performance of the processor. Data cache and memory optimization are implemented to utilize the memory hierarchy. The performance is evaluated in term of speed before and after optimization. The performance profile for the iris verification algorithm is gathered using statistical profiler tool. The DSP runs at clock frequency of 525 MHz. Table I shows the performance profile of the iris verification system before optimization. The experimental results reveal that the iris verification system has not achieved the speed requirement for less than one second. It shows that iris segmentation stage consumes 67.2% of the total computation time. After optimization, the total computation time of iris verification algorithm drops for about 67%. The computation time for iris verification system before and after optimization is shown in Fig. 7. The total computation time is 0.475 second, which conforms to the speed requirement of the iris verification system.
7.2.1 Video decoder. The decoding side captures iris images using Complementary Metal Oxide Semiconductor (CMOS) sensor and transmit data to the DSP via Blackfin A-V EZ-Extender card. First, iris image is captured using CMOS image sensor. Blackfin A-V EZ-Extender decodes the image into digital format. Parallel peripheral interface (PPI) serves as a video interface between the video decoder and the Blackfin processor. The data is transferred from PPI to SDRAM via Direct Memory Access (DMA) channel and core/system bus interface. The data is buffered in the SDRAM for further image processing. However, in this paper, the experiment loads offline iris images from the dataset into the SDRAM for verification purpose. 7.2.2 DSP Processing. The iris images are verified using the iris verification algorithm which is ported into the DSP. The iris verification code is stored into Level 1 (L1) and Level 2
Figure 7. Total computation time for iris verification system before and after optimization.
377
Table 1. Performance profile of iris verification system before and after optimization Iris Verification Stages
Before Optimization Number of Cycles Comp. Time (ms)
After Optimization Number of Cycles Comp. Time (ms)
Optimization Gain (%)
Iris segmentation
519,440,248
989.41
134,215,137
255.65
74.16
Iris normalisation
59,208,968
112.78
34,935,278
66.54
41.00
Iris verification
194,721,961
370.89
80,344,065
153.04
58.74
All stages
773,371,177
1473.08
249,494,480
475.23
67.74
the Fifth International Conference on Visual Information Engineering, July 2008, pp. 548-553.
8. Conclusion
[5] R. Y. F. Ng, Y. H. Tay, and K. M. Mok, “Iris Recognition Algorithms Based on Texture Analysis,” Proc. 3rd International Symposium on Information Technology, vol. 2, Aug 2008, pp. 904-908.
A robust iris verification algorithm using textural feature is successful implemented on Blackfin DSP. The algorithm has achieved a high recognition rate of 98.32%. The iris verification algorithm is mapped on the EZ-KIT Lite evaluation board. Optimization strategies such as source code tuning, loop optimization using pragmas and optimizing conditional code are implemented to achieve fastest code performance. The optimized iris verification system has achieved the desired speed performance. The total verification time is 470.23 milliseconds to process an iris image. Thus, DSP-based iris verification system can be applied for portable device because it is power efficient, fast authentication and compact in size.
[6] R.P. Wildes, “Iris recognition: an emerging biometric technology,” Proceedings of the IEEE, vol.85, 1997, pp.1348-1363. [7] D. Field, “Relations between the statistics of natural images and the response properties of cortical cells,” Journal of the Optical Society of America, 1987. [8] X. Yuan and P. Shi, “Efficient iris recognition system based on iris anatomical structure,” IEICE Electronic Express, vol. 4, no. 17, 2007, pp.555-560. [9] L. Ma, T. Tan, Y. Wang, and D. Zhang, “Personal identification based on iris texture analysis,” IEEE Trans. On Pattern Analysis and Machine Intelligence, vol. 25, no.12, 2003, pp. 1519-1533.
9. Acknowledgment The author would like to acknowledge Institute of Automation, Chinese Academy of Science for providing CASIA iris image database v1.0 [1]. This research is partially funded by Malaysia MOSTI ScienceFund 01-02-11-SF0019.
[10] Analog Devices Inc, “ADSP-BF561 Blackfin processor hardware reference,” Revision 1.1, Norwood, USA, 82000561-01, 2007. [11] Analog Devices Inc, “ADSP-BF561 EZ-KIT LITE evaluation system manual,” Revision 3.2, Part Number 82-000811-01, 2008.
10. References
[12] Analog Devices Inc, “VisualDSP++ 5.0 user’s guide rev. 3.0,” Norwood, USA, 82-000420-02, 2007.
[1] “CASIA iris image database,” http://www.sinobiometrics.com/Databases.htm, 2007. [2] J. Daugman, “High confidence visual recognition of persons by a test of statistical independence,” IEEE Tans. Pattern Analysis and Machine Intelligence, vol.15, 1993, pp.1148-1161. [3] J. Daugman, “How iris recognition works,” IEEE Trans. CSVT, vol. 14, no. 1, 2004, pp. 21 – 30. [4] R. Y. F. Ng, Y. H. Tay, and K. M. Mok, “An effective segmentation method for iris recognition system,” Proc.
378