coatings Article
Effect of TiN/C Microstructure Composite Layer on the Adhesion of FDLC Film onto Silicon Substrate Jianrong Xiao Jiafeng Ma *
ID
, Chenyang Gong, Meng Qi, Aihua Jiang *, Zhiyong Wang, Ming Li and
College of Science, Guilin University of Technology, Guilin 541004, China;
[email protected] (J.X.);
[email protected] (C.G.);
[email protected] (M.Q.);
[email protected] (Z.W.);
[email protected] (M.L.) * Correspondence:
[email protected] (A.J.);
[email protected] (J.M.); Tel.: +86-773-387-1615 (A.J.); +86-773-369-6613 (J.M.) Received: 2 November 2017; Accepted: 30 December 2017; Published: 3 January 2018
Abstract: Deposition techniques of direct current and radio-frequency magnetron sputtering were used to separately prepare TiN/C microstructural composite layer and fluorinated diamond-like carbon (FDLC) film on monocrystalline silicon. The aim was to investigate the effects of microstructural composite layers on the adhesion property of FDLC film. The results indicated that the TiN/C microstructural composite layer can distinguish from the substrate and the FDLC film. After adding the composite layers, the film–substrate binding force significantly increased. When the composite film were prepared at a partial pressure of 0.25, the binding force reached 30.5 N, which was greater than the value of 22.6 N for the sample without composite layers. TiN/C in the composite layers intensified the integration with silicon substrate because the C–C bond acted as a bridge linking the FDLC film to the silicon substrate. Furthermore, the bulges on the surface of the composite layers strengthened the physical bonding of the film with silicon substrates. Keywords: FDLC film; magnetron sputtering; TiN/C composite layers; adhesion
1. Introduction Diamond-like carbon (DLC) film is characterized by high hardness, low friction coefficient, good optical transparency, excellent electrical insulating property, and great corrosion resistance. Hence, DLC film is widely applied in mechanical engineering, electronic engineering, military equipment, aerospace, and biomedicine [1–5]. Fluorinated diamond-like carbon (FDLC) film is modified materials that are based on the DLC film. FDLC film possess not only the excellent properties of DLC film but also strong absorption of ultraviolet light, low dielectric constant, small friction coefficient, and biocompatibility [6–11]. Accordingly, FDLC film has been a research focus in material science. However, the unsatisfactory binding force between the film and substrate hinders its industrialization. To solve the low adhesive force of the DLC film and substrate (film–substrate), a number of studies have been conducted to actively investigate various ways to increase the film–substrate binding force. Some methods that are mentioned in these studies include the following: (1) insertion of a transition layer such as SiC layer [12–14], chromium nitride film [15,16], and WC–Co layer [17] between the film and substrate (most commonly used method); (2) addition of a buffer layer on the surface finish of the substrate (mostly monometal layers) [18,19]; (3) doping of a third element in the film (or implantation of an ion, such as Si [20,21], N [22–24], Ti [25], and Al [21]) to improve the film–substrate binding; and, (4) combination of a buffer layer and ion implantation to increase the film–substrate binding force [9,26]. These techniques decrease the unconformability of the film–substrate boundaries or the stress that is caused by different thermal expansion factors, thereby greatly improving the film–substrate binding force. However, some specific practical requirements are Coatings 2018, 8, 18; doi:10.3390/coatings8010018
www.mdpi.com/journal/coatings
Coatings 2018, 8, 18
2 of 10
still not met, including the requirements for use as bioelectrode coatings [27], as protective coatings for automobile components [28,29], and as low-k materials in ultra-large-scale integrated circuit (ULSI) chips [30]. Hence, other methods are continually being explored. Nevertheless, reports on the binding force of FDLC film and substrate are few. Some researchers have deposited a thin SiC layer onto steel substrate before depositing FDLC film. The resulting improvement in the binding force of FDLC film and substrate is certain, but is still unsatisfactory [31,32]. In this work, we increased the film–substrate binding force through direct-current (DC) magnetron sputtering by adding microstructural composite layers between film and substrate. The microstructural layer of TiN and carbon (TiN/C) was initially deposited onto substrate, followed by FDLC film. Afterwards, the effects of composite layers on the film–substrate bonding structure were analyzed to determine the factors that were influencing the adhesion between film and substrate. 2. Materials and Methods TiN/C and FDLC film were developed using a JGP-450a radio frequency magnetron sputtering (RFMS) system from Sky Technology Development Co., Ltd. Chinese Academy of Sciences (Shenyang, China). The substrate, which had monocrystalline silicon (100) indices, was ultrasonically cleaned for 10 min by immersing in acetone, alcohol, and deionized water to remove the contamination on the surface. Afterwards, the substrate was dried in an oven and placed in a vacuum chamber to prevent dust contamination. During each experiment, the background pressure of the vacuum was 1.5 × 10⁻³ Pa. Before deposition, the target material was bombarded on the surface at 100 W of power for 10 min in an Ar environment, and the surface was cleaned further. During deposition, the substrate was not heated. The TiN/C microstructural composite layer was prepared by DC magnetron sputtering. The target material was highly pure Ti (99.99%). DC sputtering power remained at 20 W. The sputtering gas was a mixture of CH4 , Ar, and N2 . The total flow was 50 sccm, and the Ar flow rate was fixed at 10 sccm. The partial pressure of the mixed gas R (R = [CH4 ]/([CH4 ] + [N2 ] + [Ar])) was 25%, 50%, and 75%, respectively, and the corresponding film samples were marked as TiN/C25%, TiN/C50%, and TiN/C75%. The deposition gas pressure was maintained at 1.0 Pa. The use of CH4 during gas preparation induced the formation of C–C bonds in the prepared composite layer; these bonds intensified the bonding of the composite layers and FDLC film. The deposition time was 3.0 min. The FDLC film was prepared using RFMS. Highly pure carbon (99.99%) was the target material, and CH4 and CF4 were the source gases, at a flow of 40 sccm. Ar was the working gas at a flow of 10 sccm. The deposition gas pressure was 1.0 Pa. RF power was 150 W. The deposition time was 30 min. The FDLC film samples that were prepared on Si substrate, TiN/C25%, TiN/C50%, and TiN/C75%, were marked as FDLC, TiN/C25%-FDLC, TiN/C50%-FDLC, and TiN/C75%-FDLC, respectively. The chemical composition of the film surface was analyzed using an X-ray photoelectron spectroscopy (XPS; ESCALAB 250Xi model, Boston, MA, USA, using Mg Kα X-ray anode operating at 10 kV and 15 mA). An X-ray diffractometer (XRD; Lambda 750 model, Waltham, MA, USA, using Cu Kα radiation, and X-ray optical wavelength = 0.15406 nm) was used to test the chemical bond structure of the microstructural composite layers. Scanning electron microscopy (SEM; SU5000 model, Tokyo, Japan) and atomic force microscopy (AFM; Bruker Dimension Icon model, Lyrique, MA, USA) were used to observe the surface morphology and cross-sections of the film. A micro-scratch tester (WS-2005 model, Lanzhou, China) was used to examine the wearing features of film friction on silicon substrate (diamond indenter = 100 µm radius of curvature; 120◦ taper angle; and, linear step loading), and then the binding force between film and substrate was analyzed in detail. The morphology of the microstructure composite layer after being subjected to tribological test was observed with an optical metallographic microscope (Olympus pmg3 model, Tokyo, Japan).
Coatings 2018, 8, 18 Coatings 2018, 8, 18
3 of 10
3. Results and Discussion 3. Results and Discussion
3.1. Test Results and Analysis of the Sample Structures 3.1. Test Results and Analysis of the Sample Structures
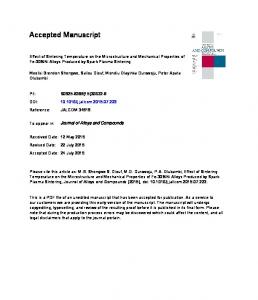
The surface morphology of the samples is shown in the SEM images in Figure 1a–d, and the The surface morphology of the samples is shown in the SEM images in Figure 1a–d, and the cross‐section of the TiN/C composite layer and FDLC film prepared at different R values are shown cross-section of the TiN/C composite layer and FDLC film prepared at different R values are shown in in Figure 1e,f. Evidently, R and the surface roughness of TiN/C composite layer increased. Although Figure 1e,f. Evidently, R and the surface roughness of TiN/C composite layer increased. Although the the massif‐like bulge on the surface is distinct, the film is still compact. This bulge may be due to the massif-like bulge on the surface is distinct, the film is still compact. This bulge may be due to the matrix’s impurities on the substrate or preferentially grown grains on the film, as shown in Figure 1a. matrix’s impurities on the substrate or preferentially grown grains on the film, as shown in Figure 1a. The SEM surface morphology image of FDLC film showed that the prepared samples had a smooth The SEM surface morphology image of FDLC film showed that the prepared samples had a smooth compact surface and uniform size without pinholes, and only a few flaws, as shown in Figure 1d. compact surface and uniform size without pinholes, and only a few flaws, as shown in Figure 1d. Figure 2 shows the morphology AFM images the composite TiN/C composite layer Figure 2 shows thesurface surface morphology AFM images of theof TiN/C layer prepared atprepared R = 25% at R = 25% and The 75%. The root‐mean‐square (RMS) surface‐roughness of the and 75%. root-mean-square (RMS) surface-roughness values of the values composite layercomposite prepared atlayer prepared at R = 25% and 75% were 1.302 and 3.379 nm, respectively. In our experimental conditions, R = 25% and 75% were 1.302 and 3.379 nm, respectively. In our experimental conditions, a smaller a smaller RMS was obtained at a smaller R. RMS was obtained at a smaller R.
Figure 1. SEM image of of the and cross-sections cross‐sections TiN/C microstructural Figure 1. SEM image thesurface surfacemorphology morphology and of of thethe TiN/C microstructural composite layer and fluorinated carbon (FDLC) (FDLC) film: TiN/C25%; (b) TiN/C50%; composite layer and fluorinateddiamond‐like diamond-like carbon film: (a)(a) TiN/C25%; (b) TiN/C50%; (c) TiN/C75%; (d) FDLC is 20,000 times surface morphology of the film, the illustration is 40,000 times (c) TiN/C75%; (d) FDLC is 20,000 times surface morphology of the film, the illustration is 40,000 times surface morphology; and (e) FDLC and (f) TiN/C25%-FDLC is the cross-section of the film. surface morphology; and (e) FDLC and (f) TiN/C25%‐FDLC is the cross‐section of the film.
Figure 3 shows the XRD spectrum of the TiN/C composite layer. Two significant diffraction peaks (111) and (200) corresponded to TiN (PDF 38‐1420), whereas the weaker diffraction peak (002) corresponded to Ti (PDF 01‐1197) [33,34]. This result indicated that a small R induced minimal changes in the diffraction peak of TiN (200), but R = 75% caused a significantly intensified and broadened peak. Conversely, TiN (111) and Ti (002) remained almost unchanged. No diffraction peak
Coatings 2018, 8, 18
4 of 10
Figure 3 shows the XRD spectrum of the TiN/C composite layer. Two significant diffraction peaks (111) and (200) corresponded to TiN (PDF 38-1420), whereas the weaker diffraction peak (002) corresponded to Ti (PDF 01-1197) [33,34]. This result indicated that a small R induced minimal changes in Coatings the diffraction 2018, 8, 18 peak of TiN (200), but R = 75% caused a significantly intensified and broadened peak. Conversely, TiN (111) and Ti (002) remained almost unchanged. No diffraction peak of the combination of combination Ti and Cwas in XRD spectrum found. This finding demonstrated the major ofCoatings Tithe and C 8,in18XRD of spectrum found. This was finding demonstrated that the majorthat element of the 2018, element of thewas composite film was TiN under the present preparation and parameters. composite film TiN under the present preparation conditions andconditions parameters. of the combination of Ti and C in XRD spectrum was found. This finding demonstrated that the major element of the composite film was TiN under the present preparation conditions and parameters.
Figure2. 2.Atomic Atomicforce forcemicroscopy microscopy (AFM) (AFM) three-dimensional three-dimensional image 5.05.0 μm × Z) of the Figure image(5.0 (5.0μm µm× × µm × Z) of the surface morphology of the TiN/C microstructural composite layer: (a) TiN/C25%; and (b) TiN/C75%. Figure morphology 2. Atomic force microscopy (AFM) three-dimensional image × 5.0 μm and × Z) (b) of the surface of the TiN/C microstructural composite layer:(5.0 (a)μm TiN/C25%; TiN/C75%.
TiN(200)
TiN(111)
TiN(200)
Ti(200)
TiN(111)
Ti(200)
Intensity / arb. units
Intensity / arb. units
surface morphology of the TiN/C microstructural composite layer: (a) TiN/C25%; and (b) TiN/C75%.
TiN/C25% TiN/C25%
TiN/C50% TiN/C50%
TiN/C75%
TiN/C75% 20 20
25 25
30 30
35 35
40
40 45
45 50o
Two theta o / ( )
50 55
55
60
60
Two theta / ( )
Figure 3. X-ray diffractometer (XRD) spectrum of the TiN/C microstructural composite layer prepared Figure 3. X-ray diffractometer (XRD) spectrum of the TiN/C microstructural composite layer prepared Figure 3. X-ray at different R. diffractometer (XRD) spectrum of the TiN/C microstructural composite layer prepared at different R. at different R.
Thelattice latticeconstant constant TiN crystalline is calculated using Bragg’s Equation (1)cubic and cubic system The ofof TiN crystalline is calculated using Bragg’s Equation (1) and system interplanar distance Equation [35]: The lattice constant of TiN crystalline is calculated using Bragg’s Equation (1) and cubic system interplanar distance Equation (2)(2) [35]:
interplanar distance Equation (2) [35]:
=ℎ𝑘𝑙 2𝑑sin sin θ ℎ𝑘𝑙 θ λ =λ2𝑑
(1) (1) λ = 2dhkl sin θ (1) p 2 2 2 2 2 2 (2) (2) 𝑎 = 𝑑√ ℎ 𝑘2 ++𝑘 𝑙2 + 𝑙 2 𝑎= ℎ √+ ℎ𝑘𝑙 a 𝑑=ℎ𝑘𝑙dhkl h +k +l (2) where λ is X-ray wavelength; θ is θthe angle; h, k, and referl refer whereaaisisthe thelattice latticeconstant; constant; λ the is the X-ray wavelength; is diffraction the diffraction angle; h, k,l and where a is the lattice constant; λinterplanar is the X-ray wavelength; θ is the diffraction h,constant k, and l refer to to dhkldhkl is is thethe distance of the crystal plane (hkl).(hkl). Theangle; lattice tocrystal crystalindices; indices;and, and, interplanar distance of the crystal plane The lattice constant crystal indices; and, d is the interplanar distance of the crystal plane (hkl). The lattice constant of TiN hkl of TiN under R = 25%, 50%, and 75% is 0.4205 nm, 0.4247 nm, and 0.4195 nm, respectively. When of TiN under R = 25%, 50%, and 75% is 0.4205 nm, 0.4247 nm, and 0.4195 nm, respectively. When under R = 25%, and 75% is 0.4205 nm,of 0.4247 nm, and 0.4195cubic nm,cubic respectively. When compared compared with the lattice constant similar face-centered structure (~0.3570 nm) compared with50%, thediamond diamond lattice constant of similar face-centered structure (~0.3570 nm) with the diamond lattice constant of similar face-centered cubic structure (~0.3570 nm) and the and the intergranular lattice constant of graphite (~0.340 nm), the lattice constant of TiN is slightly and the intergranular lattice constant of graphite (~0.340 nm), the lattice constant of TiN is slightly greater. compared with monocrystalline silicon (0.5431 nm),nm), the difference is less; hence, intergranular lattice constant of graphite (~0.340 nm), the lattice constant of TiN isisslightly greater. greater.When When compared with monocrystalline silicon (0.5431 the difference less; hence, they match comparatively. When compared with monocrystalline silicon (0.5431 nm), the difference is less; hence, they they match comparatively. XPS of the FDLC film and composite layers are shown in Figure 4. In the XPS of the TiN/C matchThe comparatively. The XPS of the FDLC film and composite layers are shown in Figure 4. In the XPS of the TiN/C composite layer, an evident substrate Si2p peak appears. At the same time, one strong O peak was The XPSlayer, of theanFDLC film and composite layers are shown in Figure In the XPSOofpeak the TiN/C composite evident substrate Si2p peak appears. At the same time,4.one strong was observed, and this peak was caused by the residual oxygen in the vacuum chamber or the samples observed,layer, and this peak wassubstrate caused by the peak residual oxygenAtinthe thesame vacuum chamber or theOsamples composite an evident Si2p appears. time, one strong peak was that were absorbing oxygen from air before being tested. From the XPS results, the F/C ratio on the that were absorbing oxygen from airby before being tested. From XPS results, the F/Cor ratio the observed, this peak was TiN/C75%-FDLC, caused the residual oxygen in the the chamber theon samples surface ofand TiN/C25%-FDLC, and FDLC samples is vacuum 9.06%, 9.31%, and 9.92%, surface of TiN/C25%-FDLC, TiN/C75%-FDLC, and FDLC samples is 9.06%, 9.31%, and 9.92%, that were absorbing oxygen air before of being tested. From the results, the respectively. This indicated thatfrom the composition FDLC film deposited on XPS the composite layerF/C and ratio on respectively. This indicated that the composition of FDLC film deposited on the composite layer and silicon substrate has little change. silicon substrate has little change. Through the method of dividing overlapping peaks, Gaussian fitting is conducted on peak C1s the method dividing overlapping peaks, fitting is conducted of theThrough XPS of FDLC film, as of shown in Figure 5. According to Gaussian the reference [36–39], peak C1s on canpeak be C1s of the XPS of FDLC film, as shown in Figure 5. According to the reference [36–39], peak C1s can be
Coatings 2018, 8, 18
5 of 10
the surface of TiN/C25%-FDLC, TiN/C75%-FDLC, and FDLC samples is 9.06%, 9.31%, and 9.92%, respectively. This indicated that the composition of FDLC film deposited on the composite layer and silicon substrate has little change. Through the method of dividing overlapping peaks, Gaussian fitting is conducted on peak C1s of the XPS of FDLC film, as shown in Figure 5. According to the reference [36–39], peak C1s can be Coatings 2018, 8, 18 divided into three peaks. The two peak position at about 283.7 and 284.4 eV corresponds to the Csp2 3 and Csp hybrid-bonding structures, respectively, which indicate that graphite and diamond phases Coatings 2018, 18 divided into8,three peaks. The two peak position at about 283.7 and 284.4 eV corresponds to the Csp2 existed inCsp the3 composite layerstructures, or FDLC film. The peak positions atthat 285.5 eV corresponded tophases C–O bond. and hybrid-bonding respectively, which indicate graphite and diamond 2 divided into three peaks. The moved two peak position atenergy about 283.7 and 284.4 eV may corresponds to the Csp The peak position of the sample to the low direction, which be caused by different existed in the composite layer or FDLC film. The peak positions at 285.5 eV corresponded to C–O 3 hybrid-bonding structures, respectively, which indicate that graphite and diamond phases and Csp preparation conditions or by calibration of to the Awhich comparison of Figure bond. The peak position of the the sample moved theinstrument low energy wrong. direction, may be caused by 5a,b existed in the composite layer or FDLC film. The peak positions at 285.5 eV corresponded to C–O 2 3 different preparation conditions calibration of the instrument A comparison of the demonstrated that the ratio sp /sp or in by thethe composite layer increased withwrong. an increased R, whereas bond. The peak position of the sample moved to the low energy direction, which may be caused by 2/sp3 in the composite layer increased with an increased R, Figure of 5a,b demonstrated thatstructure the ratio sp proportion aromatic nucleus increased in the film, and that of chained (olefin) structures different preparation conditions or by the calibration of the instrument wrong. A comparison of whereas the proportion of aromatic nucleus structure increased in the and thatwas of chained (olefin) decreased compared the peak in Figure 4c,d, thefilm, difference and 3 in the Figure[40]. 5a,bWhen demonstrated thatwith the ratio sp2/spC1s composite layer increased with anminimal increased R, was structures decreased [40]. When compared with the peak C1s in Figure 4c,d, the difference was probably caused by the carbon in thenucleus FDLC film, but increased obvious in changes observed in Figure whereas the proportion of aromatic structure the film,were and that of chained (olefin)4c,d minimal and was probably caused by the carbon in the FDLC film, but obvious changes were whenstructures compareddecreased with Figure Meanwhile, comparison Figure 5a,c,d revealed little differences [40].4b. When comparedawith the peak of C1s in Figure 4c,d, the difference was observed in Figure 4c,d when compared with Figure 4b. Meanwhile, a comparison of Figure 5a,c,d minimal and was probably caused by the carbon in the FDLC film, but obvious changes were among the fitting peaks of the three, indicating that the bonding structure that was formed by carbon revealed little differences among the fitting peaks of the three, indicating that the bonding structure observed insame. FigureThis 4c,dfinding when compared with Figure 4b. a comparison of Figure 5a,c,d was almost the provided a basis for finding theMeanwhile, formation firmer between that was formed by carbon was almost the same. This providedofaabasis for bond the formation ofcarbon a revealed little differences among the fitting peaks of the three, indicating that the bonding structure in FDLC film and that in TiN/C microstructure composite layer. firmer bond between carbon in FDLC film and that in TiN/C microstructure composite layer.
O1s
TiN/C75% TiN/C25% F1s
N1s N1s
Si 2p Si 2p
TiN/C25%
Ti 2p Ti 2p
C1s
Intensity arb. units Intensity / arb./units
C1s
O1s
that was formed by carbon was almost the same. This finding provided a basis for the formation of a firmer bond between carbon in FDLC film and that in TiN/C microstructure composite layer.
F1s
TiN/C75% FDLC FDLC TiN/C50%-FDLC
0
100
200
300
400
500
600
TiN/C50%-FDLC
700
800
900
1000
800
900
1000
Binding Energy / eV 0
100
200
300
400
500
600
700
Intensity Intensity / arb./ arb. unitsunits
Figure 4. X-ray photoelectron spectroscopy (XPS) spectrum of the TiN/C25% and TiN/C75% Binding Energy / eV Figure 4. X-ray photoelectron spectroscopy (XPS) spectrum of the TiN/C25% and TiN/C75% microstructural composite layer, TiN/C25%-FDLC film, and FDLC film. microstructural composite layer, TiN/C25%-FDLC film,spectrum and FDLC Figure 4. X-ray photoelectron spectroscopy (XPS) of film. the TiN/C25% and TiN/C75% microstructural composite layer, TiN/C25%-FDLC film, and FDLC film.
(a)
TiN/C25%
(b)
TiN/C75%
(a)
TiN/C25%
(b)
TiN/C75%
280
(c)
280
282
284
286
288
280
282
284
286
FDLC 288
280
(c)
(d)
284
282
284TiN/C50%-FDLC 286 288
(d)
FDLC
288
282
280
286
288
TiN/C50%-FDLC
280
282
284
286
282
280
282
284
Binding Energy / eV 286 288 280 282
284
286
288
284
286
288
Figure 5. Gaussian fitting of XPS C1s peak of the TiN/C microstructural composite layer and FDLC Binding Energy / eV film. (a) TiN/C25%; (b) TiN/C75%; (c) FDLC; and (d) TiN/C25%-FDLC. Figure 5. Gaussian fitting of XPS C1s peak of the TiN/C microstructural composite layer and FDLC Figure 5. Gaussian fitting of XPS C1s peak of the TiN/C microstructural composite layer and FDLC film. film. (a)6a TiN/C25%; (b) Gaussian TiN/C75%;fitting (c) FDLC; and (d) TiN/C25%-FDLC. Figure shows the of peak Ti2p of the TiN/C composite layer, which can be
(a) TiN/C25%; (b) TiN/C75%; (c) FDLC; and (d) TiN/C25%-FDLC. divided into two doublets. The peak positions at 455.7 and 461.5 eV corresponded to Ti2p3/2 and Ti2p1/2 Figure 6a shows the Gaussian fitting of peak Ti2p of the TiN/C composite layer, which can be of TiN, whereas the peak positions at 457.6 and 464.2 eV corresponded to Ti2p3/2 and Ti2p1/2 of TiO [41,42]. divided into two doublets. The peak positions at 455.7 and 461.5 eV corresponded to Ti2p3/2 and Ti2p1/2 N1s can be divided into two peaks, i.e., at 397.9 and 399.3 eV, which corresponded to TiN and of TiN, whereas the peak positions at 457.6 and 464.2 eV corresponded to Ti2p3/2 and Ti2p1/2 of TiO [41,42]. N-oxide [41], as shown in Figure 6b. A comparison of Figure 6a,b indicated that an increased R led to N1s can be divided into two peaks, i.e., at 397.9 and 399.3 eV, which corresponded to TiN and N-oxide [41], as shown in Figure 6b. A comparison of Figure 6a,b indicated that an increased R led to
Coatings 2018, 8, 18
6 of 10
Figure 6a shows the Gaussian fitting of peak Ti2p of the TiN/C composite layer, which can be divided into two doublets. The peak positions at 455.7 and 461.5 eV corresponded to Ti2p3/2 and Ti2p1/2 of TiN, whereas the peak positions at 457.6 and 464.2 eV corresponded to Ti2p3/2 and Ti2p1/2 Coatings 2018, 8, 18 of TiO [41,42]. N1s can be divided into two peaks, i.e., at 397.9 and 399.3 eV, which corresponded to TiN and N-oxide [41], as shown in Figure 6b. A comparison of Figure 6a,b indicated that an increased decreased Ti–O bonding in the composite layer, whereas N–O increased bonding and slightly R led to decreased Ti–O bonding in the composite layer, whereas N–O increased bonding and slightly increased the Ti–N content. increased the Ti–N content.
Ti2p
454
456
458
460
462
464
466
TiN/C25%
Intensity / arb. units
TiN/C75%
452
N1s
(b)
TiN/C25%
Intensity / arb. units
(a)
TiN/C75%
468
394
396
Binding Energy / eV
398
400
402
404
Binding Energy / eV
Figure (a) Gaussian fitting peakTi2p Ti2pof ofTiN; TiN; (b) of of peak N1sN1s of TiN. Figure 6. (a)6.Gaussian fitting of of peak (b) Gaussian Gaussianfitting fitting peak of TiN.
3.2. Results and Analysis of the Film–SubstrateBinding Binding Force Force 3.2. Results and Analysis of the Film–Substrate During scratchtests, tests, completely completely identifying the the critical load of the film wasfilm difficult simply by During the the scratch identifying critical load of the wasbydifficult examining the changes in acoustic emission signals because the internal cohesive failures (flaws simply examining the changes in acoustic emission signals because the internal cohesive and failures large particles) of the film cause abnormal acoustic emission signals. Therefore, the acoustic emission (flaws and large particles) of the film cause abnormal acoustic emission signals. Therefore, the signal and scratch morphology were combined to eliminate interference signals, and thus estimate acoustic emission signal and scratch morphology were combined to eliminate interference signals, the film–substrate binding force. Figure 7 shows the micro-scratch test results of FDLC film before and thus estimate the film–substrate binding force. showsthe themetallographic micro-scratchmicroscope test results of and after the insertion of the composite layer, and Figure Figure 87shows FDLCimages film before and after the insertion of the composite layer, and Figure 8 shows the metallographic of the failure zones of the film in the scratch-adhesion tests. From Figure 7a, it can be seen microscope the failure zonesatofabout the film Figure 7a, it can that theimages acousticof signal has changed 22.6in N,the andscratch-adhesion that the scratches tests. on theFrom film are damaged. be seen thatinserting the acoustic signal has changed at the about and that scratches film are Before the composite layer between film22.6 andN, substrate, thethe binding forceon of the the film was small. the insertion, the binding is ~30the N. At = 25%, the forcethe reached 30.5force N, of damaged. BeforeAfter inserting the composite layerforce between filmR and substrate, binding indicating that the composite layer significantly theN. adhesive film.reached Obviously, the film was small. After the insertion, the bindingincreased force is ~30 At R = force 25%, of thethe force 30.5 N, the adhesive force in Figure 7c,d only slightly change. Only the sound signal has a greater change. indicating that the composite layer significantly increased the adhesive force of the film. Obviously, The remarkable increase the film–substrate binding force inserting layer the adhesive force in Figure 7c,dofonly slightly change. Only theafter sound signalTiN/C has acomposite greater change.
Friction signal /arb. units
Sound signal /arb.units
Sound signal /arb.units
Friction signal /arb. units
was possibly because TiN and C atom inlaid with each other in the microstructural composite layer. On6000 one interface of the composite layer (bottom surface), 6000 the lattice constant of TiN was closer 400 to 400 that of monocrystalline silicon than that of350diamond. Matching lattices benefit the mutual binding 350 of (b) 5000 5000 (a) crystalline and intensify the binding of the composite layer and substrate. At the other interface 300 of 300 4000 the4000 composite layer (top surface), C on the surface of composite layer bonded with C in FDLC film. 250 250 This3000 bond strengthens the bonding of the composite layer3000 and film layer. In addition, the bulges on 200the 200 surface of the composite layer become embedded into FDLC film like rivets after the deposition of 150 150 2000 the2000 FDLC film. Consequently, the contact area between the composite layer and FDLC film increased, 100 100 which physical bonding of the composite layer50and 1000 increased the possibilities of C–C bonding, and the1000 50 FDLC film intensified. Accordingly, after the insertion of TiN/C composite layer, the film–substrate 0 0 0 0 0 10 20 30 40 0 10 20 30 40 binding force evidently increased. Load /N 350 300 4000 3000 2000
250 200 150 100
1000
50
5000
400
(d)
350 300
4000 3000 2000
250 200 150 100
1000
50
riction signal /arb. units
(C)
ound signal /arb.units
5000
Load /N 6000
400
iction signal /arb. units
ound signal /arb.units
6000
microscope images of the failure zones of the film in the scratch-adhesion tests. From Figure 7a, it can be seen that the acoustic signal has changed at about 22.6 N, and that the scratches on the film are damaged. Before inserting the composite layer between the film and substrate, the binding force of the film was small. After the insertion, the binding force is ~30 N. At R = 25%, the force reached 30.5 N, indicating that the composite layer significantly increased the adhesive force of the film. Obviously, Coatings 2018, 8, 18 7 of 10 the adhesive force in Figure 7c,d only slightly change. Only the sound signal has a greater change.
300 4000
250
3000
200 150
2000
100 1000
50
0
Sound signal /arb.units
350
(a)
10
20
30
350 300
4000
250
3000
200 150
2000
100 1000
50
0
0 0
(b)
5000
0 0
40
10
Load /N
4000
250
3000
200 150
2000
100 1000
50
0
0 20
Load /N
30
40
Sound signal /arb.units
300
Friction signal /arb. units
Sound signal /arb.units
350
(C)
10
40
6000
400
0
30
Load /N
6000 5000
20
400 350
(d)
5000
300 4000
250
3000
200 150
2000
100 1000
50
0
Friction signal /arb. units
5000
400
Friction signal /arb. units
6000
400
Friction signal /arb. units
Sound signal /arb.units
6000
0 0
10
20
30
40
Load /N
Figure 7. Results of the film–substrate binding force of film the prepared FDLC film preparedmicrostructural on different Figure 7. Results of the film–substrate binding force of the FDLC on different microstructural composite (a) FDLC; (b) TiN/C25%-FDLC;and (c) (d) TiN/C50%-FDLC; and composite layers: (a) FDLC; (b)layers: TiN/C25%-FDLC; (c) TiN/C50%-FDLC; TiN/C75%-FDLC. (d) TiN/C75%-FDLC. Coatings 2018, 8, 18
Figure 8. 8. Metallographic microscope of films films in inscratch-adhesion scratch-adhesiontest: test: Figure Metallographic microscopeimages imagesofofthe thefailure failure zones zones of (a) (a) FDLC; (b) TiN/C25%-FDLC; (c) TiN/C50%-FDLC; and (d) TiN/C75%-FDLC. FDLC; (b) TiN/C25%-FDLC; (c) TiN/C50%-FDLC; and (d) TiN/C75%-FDLC.
The remarkable increase of the film–substrate binding force after inserting TiN/C composite layer was possibly because TiN and C atom inlaid with each other in the microstructural composite layer. On one interface of the composite layer (bottom surface), the lattice constant of TiN was closer to that of monocrystalline silicon than that of diamond. Matching lattices benefit the mutual binding of crystalline and intensify the binding of the composite layer and substrate. At the other interface of the composite layer (top surface), C on the surface of composite layer bonded with C in FDLC film.
Coatings 2018, 8, 18
8 of 10
The film–substrate binding force changed with R possibly variations in R consequently induced changes in the TiN lattice constant and spC hybrid structure in the composite layer. The intensified bonding and resulting structure increased the film–substrate binding force. Meanwhile, at R = 75%, the XRD diffraction peak broadened, grain size decreased, which resulted in a decreased number of pores (or increased film density) in the structure of the composite layer. This phenomenon further led to increased hardness [43] and a subsequent increase in film brittleness. Therefore, when considering that acoustic signals are discontinuous discrete signals, the film–substrate binding force slightly declined when this signal was relatively weak. 4. Conclusions The TiN/C microstructural composite layer on monocrystalline silicon substrate is sputtered before sputtering FDLC film. This method did not change the primarily diamond-like structure of FDLC film. The film–substrate binding force significantly increased from 22.6 N to 30 N. R influenced the surface roughness, lattice constant, and particle size of TiN/C composite layer to some degree. A certain preparation condition can improve the bonding structure of the composite layer and consequently optimize the ultimate film–substrate binding force. The increase of film–substrate binding force was largely due to the fact that the inlaid TiN and C–C bonds of the composite layer are, respectively, the bonds that are linked the silicon substrate and FDLC film. These bonds are the key to augmenting the film–substrate binding force. The massif-like bulges on the surface of the composite layer enabled the formation of more C–C structures on the interface of the composite layer and FDLC film. The bulges also functioned as rivets, which increased the film–substrate chemical bonding and physical binding force—which is another reason for the increase of binding force. Acknowledgments: This work was supported by National Natural Science Foundation of China (Grants No. 11364011), and Guangxi Natural Science Foundation (Grants Nos. 2015GXNSFAA139004, 2017GXNSFAA 198121). Author Contributions: Aihua Jiang conceived and designed the experiments; Chenyang Gong and Meng Qi performed the experiments; Jiafeng Ma, Ming Li and Zhiyong Wang analyzed the data; Jianrong Xiao wrote the paper; all authors participated and discussed this work. Conflicts of Interest: The authors declare no conflict of interest.
References 1. 2.
3. 4.
5.
6.
7. 8.
Robertson, J. Diamond-like amorphous carbon. Mater. Sci. Eng. R. 2002, 37, 129–281. [CrossRef] Hasebe, T.; Matsuoka, Y.; Kodama, H.; Saito, T.; Yohena, S.; Kamijo, A.; Shiraga, N.; Higuchi, M.; Kuribayashi, S.; Takahashi, K. Lubrication performance of diamond-like carbon and fluorinated diamond-like carbon coatings for intravascular guidewires. Diam. Relat. Mater. 2006, 15, 129–132. [CrossRef] Miyake, S.; Suzuki, S.; Miyake, M. Friction durability of extremely thin diamond-like carbon films at high temperature. Materials 2017, 10, 159. [CrossRef] [PubMed] Ashtijoo, P.; Bhattacherjee, S.; Sutarto, R.; Hu, Y.; Yang, Q. Fabrication and characterization of adherent diamond-like carbon based thin films on polyethylene terephthalate by end hall ion beam deposition. Surf. Coat. Technol. 2016, 308, 90–97. [CrossRef] Rose, F.; Wang, N.; Smith, R.; Xiao, Q.F. Complete characterization by Raman spectroscopy of the structural properties of thin hydrogenated diamond-like carbon films exposed to rapid thermal annealing. J. Appl. Phys. 2014, 116, 123516. [CrossRef] Prihandana, G.S.; Sanada, I.; Ito, H.; Noborisaka, M.; Kanno, Y.; Suzuki, T.; Miki, N. Antithrombogenicity of fluorinated diamond-like carbon films coated nano porous polyethersulfone (PES) membrane. Materials 2013, 6, 4309–4323. [CrossRef] [PubMed] Xiao, J.R.; Jiang, A.H. Effect of radio frequency power on the structural and optical properties of nitrogen doping of fluorinated diamond-like carbon thin films. J. Phys. D Appl. Phys. 2008, 41, 225304. [CrossRef] Jiang, A.; Xiao, J.; Li, X.; Wang, Z. Effect of structure, composition, and micromorphology on the hydrophobic property of F-DLC film. J. Nanomater. 2013, 2013, 690180. [CrossRef]
Coatings 2018, 8, 18
9. 10.
11. 12.
13.
14. 15. 16. 17.
18. 19. 20. 21. 22.
23.
24. 25. 26.
27.
28.
29.
9 of 10
Wang, J.; Ma, J.; Huang, W.; Wang, L.; He, H.; Liu, C. The investigation of the structures and tribological properties of F-DLC coatings deposited on Ti-6Al-4V alloys. Surf. Coat. Technol. 2017, 316, 22–29. [CrossRef] Maegawa, S.; Hasebe, T.; Yamato, Y.; Bito, K.; Nagashima, S.; Hayashi, T.; Mine, T.; Matsumoto, T.; Hotta, A.; Suzuki, T. Time course analysis of antithrombogenic properties of fluorinated diamond-like carbon coating determined via accelerated aging tests: Quality control for medical device commercialization. Diam. Relat. Mater. 2016, 70, 33–38. [CrossRef] Xiao, J.R.; Xu, H.; Deng, C.S.; Wang, H.Y.; Li, Y.F. Study on FN-DLC thin films: (III) hydrophobic nature analysis. Acta Phys. Sin. 2007, 56, 2998–3003. Hasebe, T.; Murakami, K.; Nagashima, S.; Yoshimoto, Y.; Ihara, A.; Otake, M.; Kasai, R.; Kasuya, S.; Kitamura, N.; Kamijo, A. Design for improved adhesion of fluorine-incorporated hydrogenated amorphous carbon on metallic stent: Three-layered structure with controlled surface free energy. Diam. Relat. Mater. 2011, 20, 902–906. [CrossRef] Capote, G.; Ramírez, M.A.; da Silva, P.C.S.; Lugo, D.C.; Trava-Airoldi, V.J. Improvement of the properties and the adherence of DLC coatings deposited using a modified pulsed-DC PECVD technique and an additional cathode. Surf. Coat. Technol. 2016, 308, 70–79. [CrossRef] Yu, S.; Chen, Z.; Wang, Y.; Hu, S.; Luo, R.; Cui, S. Growth of SiC as binder to adhere diamond particle and tribological properties of diamond particles coated SiC. J. Mater. Sci. Technol. 2015, 31, 1133–1138. [CrossRef] Fayer, A.; Glozman, O.; Hoffman, A. Deposition of continuous and well adhering diamond films on steel. Appl. Phys. Lett. 1995, 67, 2299–2301. [CrossRef] Glozman, O.; Hoffman, A. Adhesion improvement of diamond films on steel subtrates using chromium nitride interlayers. Diam. Relat. Mater. 1997, 6, 796–801. [CrossRef] Gowri, M.; van Enckevort, W.J.P.; Schermer, J.J.; Celis, J.P.; Meulen, J.J.T.; Buijnsters, J.G. Growth and adhesion of hot filament chemical vapor deposited diamond coatings on surface modified high speed steel. Diam. Relat. Mater. 2009, 18, 1450–1458. [CrossRef] Gotzmann, G.; Beckmann, J.; Wetzel, C.; Scholz, B.; Herrmann, U.; Neunzehn, J. Electron-beam modification of DLC coatings for biomedical applications. Surf. Coat. Technol. 2017, 311, 248–256. [CrossRef] Utsumi, T.; Oka, Y.; Fujiwara, E.; Yatsuzuka, M. Effect of a hard supra-thick interlayer on adhesion of DLC film prepared with PBIID process. Nucl. Instrum. Methods Phys. Res. Section B 2007, 257, 706–709. [CrossRef] Hatada, R.; Baba, K.; Flege, S.; Ensinger, W. Long-term thermal stability of Si-containing diamond-like carbon films prepared by plasma source ion implantation. Surf. Coat. Technol. 2016, 305, 93–98. [CrossRef] Dai, W.; Gao, X.; Liu, J.; Wang, Q. Microstructure, mechanical property and thermal stability of diamond-like carbon coatings with Al, Cr and Si multi-doping. Diam. Relat. Mater. 2016, 70, 98–104. [CrossRef] Bootkul, D.; Supsermpol, B.; Saenphinit, N.; Aramwit, C.; Intarasiri, S. Nitrogen doping for adhesion improvement of DLC film deposited on Si substrate by Filtered Cathodic Vacuum Arc (FCVA) technique. Appl. Surf. Sci. 2014, 310, 284–292. [CrossRef] Kovacı, H.; Baran, Ö.; Bayrak, Ö.; Yetim, A.F.; Çelik, A. Influence of plasma nitriding treatment on the adhesion of DLC films deposited on AISI 4140 steel by PVD magnetron sputtering. J. Adhes. Sci. Technol. 2017, 31, 2015–2027. [CrossRef] Podgornik, B.; Vizintin, J.; Ronkainen, H.; Holmberg, K. Friction and wear properties of DLC-coated plasma nitrided steel in unidirectional and reciprocating sliding. Thin Solid Films 2000, 377–378, 254–260. [CrossRef] Peters, A.M.; Nastasi, M. Titanium-doped hydrogenated DLC coatings deposited by a novel OMCVD-PIIP technique. Surf. Coat. Technol. 2003, 167, 11–15. [CrossRef] Wang, Y.; Pu, J.; Wang, J.; Li, J.; Chen, J.; Xue, Q. Interlayer design for the graphite-like carbon film with high load-bearing capacity under sliding-friction condition in water. Appl. Surf. Sci. 2014, 311, 816–824. [CrossRef] Laurila, T.; Rautiainen, A.; Sintonen, S.; Hua, J.; Kaivosoja, E.; Koskinen, J. Diamond-like carbon (DLC) thin film bioelectrodes: Effect of thermal post-treatments and the use of Ti adhesion layer. Mater. Sci. Eng. C 2014, 34, 446–454. [CrossRef] [PubMed] Cemin, F.; Bim, L.T.; Menezes, C.M.; da Costa, M.E.H.M.; Baumvol, I.J.R.; Alvarez, F.; Figueroa, C.A. The influence of different silicon adhesion interlayers on the tribological behavior of DLC thin films deposited on steel by EC-PECVD. Surf. Coat. Technol. 2015, 283, 115–121. [CrossRef] Bewilogua, K.; Hofmann, D. History of diamond-like carbon films—From first experiments to worldwide applications. Surf. Coat. Technol. 2014, 242, 214–225. [CrossRef]
Coatings 2018, 8, 18
30. 31. 32. 33. 34.
35.
36. 37.
38. 39.
40. 41. 42.
43.
10 of 10
Grill, A. From tribological coatings to low-k dielectrics for ULSI interconnects. Thin Solid Films 2001, 398, 527–532. [CrossRef] She, Q.; Jiang, M.F.; Qian, N.; Pan, Y. Effects of preparation temperature of SiC intermediate layers on the hemocompatibility of SiC/F-DLC composite film. Acta Phys. Sin. 2014, 63, 12–21. Lung, B.H.; Chiang, M.J.; Hon, M.H. Effect of gradient a-SiCx interlayer on adhesion of DLC films. Mater. Chem. Phys. 2001, 72, 163–166. [CrossRef] Ghasemi, S.; Shanaghi, A.; Chu, P.K. Nano mechanical and wear properties of multi-layer Ti/TiN coatings deposited on Al 7075 by high-vacuum magnetron sputtering. Thin Solid Films 2017, 638, 96–104. [CrossRef] Ghasemia, S.; Shanaghia, A.; Chub, P.K. Corrosion behavior of reactive sputtered Ti/TiN nanostructured coating and effects of intermediate titanium layer on self-healing properties. Surf. Coat. Technol. 2017, 326, 156–164. [CrossRef] Freeda, M.; Subash, T.D. Comparision of Photoluminescence studies of Lanthanum, Terbium doped Calcium Aluminate nanophosphors (CaAl2 O4 : La, CaAl2 O4 : Tb) by sol-gel method. Mater. Today Proc. 2017, 4, 4302–4307. [CrossRef] Mérel, P.; Tabbal, M.; Chaker, M.; Moisa, S.; Margot, J. Direct evaluation of the sp3 content in diamond-like-carbon films by XPS. Appl. Surf. Sci. 1998, 136, 105–110. [CrossRef] Varga, M.; Izak, T.; Vretenar, V.; Kozak, H.; Holovsky, J.; Artemenko, A.; Hulman, M.; Skakalova, V.; Dong, S.L.; Kromka, A. Diamond/carbon nanotube composites: Raman, FTIR and XPS spectroscopic studies. Carbon 2016, 111, 54–61. [CrossRef] Ghosh, B.; Guzmán-Olivos, F.; Espinoza-González, R. Plasmon-enhanced optical absorption with graded bandgap in diamond-like carbon (DLC) films. J. Mater. Sci. 2017, 52, 218–228. [CrossRef] Gayathri, S.; Kumar, N.; Krishnan, R.; Ravindran, T.R.; Amirthapandian, S.; Dash, S.; Tyagi, A.K.; Sridharan, M. Influence of transition metal doping on the tribological properties of pulsed laser deposited DLC films. Ceram. Int. 2015, 41, 1797–1805. [CrossRef] Xiao, J.R.; Xu, H.; Guo, A.M.; Wang, H.Y. Study of FN-DLC thin films: (I) sp structure and chemical bond analysis. Acta Phys. Sin. 2007, 56, 1802–1808. Banerjee, T.; Chattopadhyay, A.K. Structure, mechanical and tribological characterisations of pulsed DC magnetron sputtered TiN-WSx composite coating. Vacuum 2016, 130, 93–104. [CrossRef] Shaginyan, L.R.; Mišina, M.; Zemek, J.; Musil, J.; Regent, F.; Britun, V.F. Composition, structure, microhardness and residual stress of W–Ti–N films deposited by reactive magnetron sputtering. Thin Solid Films 2002, 408, 136–147. [CrossRef] Khojier, K.; Savaloni, H.; Shokrai, E.; Dehghani, Z.; Dehnavi, N.Z. Influence of argon gas flow on mechanical and electrical properties of sputtered titanium nitride thin films. J. Theor. Appl. Phys. 2013, 7, 37. [CrossRef] © 2018 by the authors. Licensee MDPI, Basel, Switzerland. This article is an open access article distributed under the terms and conditions of the Creative Commons Attribution (CC BY) license (http://creativecommons.org/licenses/by/4.0/).