This is a preprint of the paper presented at the 6th International Conference on Human System Interaction, June 06-08 2013 in Gdansk, Poland and published in the IEEE Xplore Digital Library. DOI: 10.1109/HSI.2013.6577875
Emotions in the software development process Michal R. Wrobel Faculty of Electronics, Telecommunications and Informatics, Gdansk University of Technology, Poland
[email protected]
Abstract— This paper presents the results of a survey on the experience of emotions in the work of software developers. Quantitative analysis revealed information about emotions affecting programmers, their frequency and impact on their performance. The concept of emotional risk to productivity was also presented. It allows to choose the emotional states, which should be avoided. Furthermore, all collected data were analyzed with information about the experience of developers. In addition to most hazardous emotions, those with the most positive impact on productivity were selected.
I. I NTRODUCTION Emotions play an important role in the life of most people. Many research and scientific papers cover their impact on professional work [1], [2]. The Affective Events Theory (AET) proposed in 1996 by Weiss and Cropanzano, is a well known and accepted model explaining the influence of emotions and moods on work productivity [3]. However, there is a lack of studies on the role of emotional states in software engineering. Some researchers claim that software engineers differ significantly from other people. Therefore, it is reasonable to investigate the influence of emotions on this particular group of professionals. One of the main motivations to address this topic is telecommuting, which is one of the areas in which the influence of emotional states on employees is especially important. This way of working has been rapidly growing in recent years. For example, research in the U.S. government agencies revealed that with more than 2 million workers, over 160,000 were teleworking [6]. Telecommuting is supported by a variety of collaboration tools, including chat, VoIP, video conferencing, which help to work in a geographically distributed environment. However, very important psychological issues, associated for example with the feeling of isolation and lack of another human being support so far have not been addressed. From the viewpoint of software engineering, this is particularly important considering that software is rarely produced by a single person. The software should be developed as a product of interaction between team members, both at the level of code and exchange of ideas. Since software engineering is a discipline consisting of design, development, deployment, and maintenance, there are also distinguished occupations such as programmers, systems analysts, and project managers. Wynekoop and Walz claim that the personality profiles of analysts and managers differed widely from that of programmers [7]. In this article only the c 978-1-4673-5637-4/13/$31.00 2013 IEEE
role of programmers’ emotions on their productivity will be considered. Research related to the role of emotions in programming have so far been carried out in two fields. The first is affective computing, which focuses on the emotions of users in interaction with computers and applications [8]. However, the problem of programming and telecommuting has not yet been thoroughly explored in this field. Nevertheless, many of the problems are common in e-learning and telework areas. E-learning is one of the most studied areas of affective computing. Many of the existing problems and their solutions have been described in the peer-reviewed articles [9], [10]. Therefore, it is important to identify these common problems and take advantage of existing solutions, developed by the researchers. The second related field focuses on motivation in software engineering. Many papers describe the impact of motivation on productivity in software engineering. Although the existing studies did not cover the impact of emotions on the productivity of the programmers, they provide a good reference point for further research. This paper covers an initial stage of research on the role of emotions in the software development process. II. O BJECTIVES OF RESEARCH The purpose of this article is to reveal which emotional states are present in the software development process, how often they occur and what their impact on productivity is. The research was conducted from the viewpoint of the software developers. The article raised the following research questions: • RQ1: What emotions occur during programming? • RQ2: How often do different emotions appear? • RQ3: How do emotions affect productivity? • RQ4: What emotions pose a risk to the productivity? A. Data collection method Quantitative research method was chosen for this study because it is the most suitable for the collection of numerical data from a large group of people. It provides a numeric comparison, classification, etc. The study was conducted in the form of a survey, because other strategies (experiment, case study, a post-mortem analysis), do not seem appropriate at this early stage of research. There were considered two methods of data collection: a questionnaire and an interview. The interview allows more
detailed examination of the subject, for example, by extending the questions. However, at this point of research, it is important to gather more feedback, which will subsequently be verified and enhanced through interviews, experiments and case studies. Therefore, the study was conducted using a web-based questionnaire. This approach allowed to conduct rapid research on a large group of software developers at low cost.
The survey was published in mid-November 2012, and the data were collected during 4 weeks. At this time, 56 responses were collected, of which 49 were complete. Using GeoIP mechanism, the location of the respondents was collected. It has been shown in Table II. Vast majority were from Poland. TABLE II L OCATION OF RESPONDENTS
B. Job Emotions Scale (JES) There are many approaches to measuring human emotions. They can be divided into two groups. In the first one, people assess their own emotional state. In the second, the state is determined by monitoring physiological changes with biometric sensors. Self-reporting measurements can in turn be divided into verbal and visual ones. In the verbal measurement emotions are described by single words while in the visual by images or photographs [12]. For the purpose of this survey online, verbal self-reporting approach was chosen. Different emotions measurement scales were analyzed, including PANAS [13], PAD [14], JAS [15] and JES. Eventually, it was decided to use the Job Emotions Scale (JES) proposed by Cynthia Fisher [16]. It was designed to measure job satisfaction in the form of a questionnaire. Therefore, emotions descriptions are accurate and clear for users. The JES scale distinguishes 16 emotions - 8 positive and 8 negative. However, it was reported that pride, liking, embarrassment, and worry were the least frequently reported. Therefore, for the purposes of this study 12 emotions were selected. They are shown in Table I, divided into positive and negative ones. TABLE I E MOTIONS DESCRIPTION Positive Happy Enthusiastic Pleased Optimistic Enjoying Content
III. S URVEY RESULTS AND DATA ANALYSES
Negative Depressed Frustrated Angry Disgusted Unhappy Disappointed
C. Questionnaire construction For the purpose of the study a dynamic on-line survey was developed. Respondents were asked to assess each of the 12 selected emotional states in three questions. The first two questions concern the prevalence of emotions during programming. In the third question, the respondents assessed the impact of each emotional state on productivity. In addition, at the end of the survey there were collected information on the professional experience of the programmers. The survey was prepared in two languages: English and Polish. It was announced on the programming groups on LinkedIn, Facebook, Twitter, and sent to the author’s fellow programmers.
Country Poland UK Ireland USA Other Unknown
Users 40 6 3 2 2 2
The data collected in the on-line survey were exported to a spreadsheet. These raw data are available on EmoRG (Emotions in HCI Research Group) website1 in Publications section. Answers to questions were analyzed individually and comprehensively. A. The experience of emotion (Q1) In the first question, respondents had to point out which emotional states they experience in the software development process. This was intended to answer the RQ1. The selection was made from a list of 12 emotional states. Almost half of the participants (24 people out of 49) indicated that they experienced all listed emotional states. The smallest number of participants felt depressed and unhappy when programming. The Table III shows the number of respondents who have not experienced particular emotional states, arranged from the most rare. TABLE III E MOTIONS EXPERIENCED DURING PROGRAMMING Emotional state Depressed Unhappy Disgusted Disappointed Optimistic Enjoying Angry Happy Content Frustrated Pleased Enthusiastic
Not experienced 16 14 10 8 6 6 5 5 4 2 2 1
Percent 67.3% 71.4% 79.5% 83.6% 87.7% 87.7% 89.7% 89.7% 91.8% 95.9% 95.9% 97.9%
Among the most experienced emotional states indicated by more than 90% of programmers, were 4 positive: enthusiastic, satisfied, content and happy, and only one negative: frustrated. The results show that all the negative states, in addition to frustrated and angry, were experienced by a 1 http://www.emorg.eu/
smaller group of respondents than by those experiencing positive emotions. To sum up, in response to RQ1, more than 75% of respondents experience all the emotional states and over 90% only positive states, along with anger and frustration. B. Frequency of experiencing emotions The next question (Q2) has investigated how often developers experience specific emotional states during programming. Each emotion was evaluated on a scale from 0 to 5, where 0 indicates the lack (based on Q1), and 5 almost always experiencing an emotion. Mean values of occurrence of emotional states and standard deviations are shown in Table IV and Fig. 1. TABLE IV F REQUENCY OF EXPERIENCING EMOTIONS Emotion Depressed Unhappy Disgusted Disappointed Angry Enjoying Happy Frustrated Optimistic Enthusiastic Content Pleased
Mean 1,53 1,67 2,02 2,04 2,35 2,78 2,78 2,80 3,14 3,18 3,24 3,29
Standard deviation 1,40 1,36 1,44 1,37 1,41 1,34 1,36 1,27 1,46 1,13 1,22 1,02
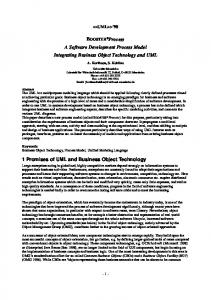
Fig. 2.
Disgust and frustrated distribution
not only differences between individuals in the perception of emotions, but also a measure of understanding of what the name of the emotion is. The descriptions of emotions selected for this questionnaire may not be clear to all participants. Disgust has the largest standard deviation value, and distribution of its evaluation is shown in Fig. 2. The shape of the distribution may indicate that respondents have different interpretations of the word disgust in relation to the emotions experienced at work. For comparison, evaluation of emotion frustrated has a shape similar to a normal distribution. Fig. 1.
Frequency of experiencing emotions
The mean values of the responses given by the participants indicates that positive emotions dominate in their work. The four most frequently occurring emotional states were happy, content, enthusiastic and optimistic. The fifth emotion arranged by the frequency was frustrated, the first negative emotion. Additionally all other negative emotions received an average value of occurrence less than 2.5, and all the positive emotions more than 2.5. This leads to the conclusion that respondents are generally satisfied with their job. However, the results may be distorted because of that people are not willing to expose their negative emotions. These results correspond to RQ2. The distribution of responses should be further analyzed. The distribution of responses similar to uniform may indicate
TABLE V E MOTIONS IMPACT ON PRODUCTIVITY Emotion Depressed Disgusted Frustrated Disappointed Unhappy Angry Content Enjoying Optimistic Pleased Happy Enthusiastic
Impact -1,36 -1,36 -1,15 -1,10 -1,08 -0,89 1,05 1,19 1,35 1,38 1,39 1,60
C. Emotions impact on productivity In question Q3, users were asked to assess the impact of emotional states on the effectiveness of their work on a scale from -2 (very negative) to +2 (very positive). They could evaluate only those states which they pointed out in Q1. The average results are presented in Table V and Fig. 3.
that most increases productivity is enthusiastic, while depression and disgust decrease it. D. Emotional risk to productivity According to ISO/IEC 27005:2008 standard, the risk is defined as combination of the probability of occurrence of an event and its consequence [18]. This definition can be used to introduce the concept of emotional risk to productivity, as the product of frequency of emotion and its negative impact on productivity. In this way, emotional states that needs to be eliminated in the first place may be chosen as the most risky. In Table VII and in Fig. 4 the product of the average values of responses from questions Q2 and Q3 normalized to the range from -100% to 100% is shown. TABLE VII E MOTIONAL RISK TO PRODUCTIVITY
Fig. 3.
Emotions impact on productivity
As expected, all positive states were on average identified as increasing productivity while negative as reducing it. Although some negative emotional states can actually mobilize employees, they are seen as a reduction in productivity due to discomfort. Let us examine a detailed assessment of individual users. Table VI shows the exact number of assessments for each values and emotions.
Emotion Frustrated Disgusted Disappointed Depressed Angry Unhappy Enjoying Content Happy Optimistic Pleased Enthusiastic
Opportunity/Risk -32% -27% -22% -21% -21% -18% 33% 34% 38% 42% 45% 51%
TABLE VI D ISTRIBUTION OF ANSWERS TO Q3
Happy Enthusiastic Pleased Optimistic Enjoying Content Unhappy Frustrated Disgusted Disappointed Angry Depressed
-2 0 0 0 0 0 0 14 21 23 18 19 19
-1 2 0 0 0 1 0 13 14 9 11 11 9
0 2 2 5 5 8 12 7 9 5 10 8 4
1 17 15 19 18 16 18 2 1 2 2 2 0
2 23 31 23 20 18 14 0 1 0 0 4 1
An interesting effect can be observed for the angry emotions, for which 13% of the developers indicated a positive or very positive impact on productivity. This also has an impact on the average assessment, which is the highest of the negative. This is consistent with the cognitive theory of emotions proposed by Oatley and Johnson-Laird, according to which angry evokes the state meaning ”try harder” [17]. Therefore, a more detailed research should be conducted on the impact of this emotion on productivity both in the form of interviews and experiments with biometric sensors. Responding to RQ3, the results show that the emotions
Fig. 4.
Emotional risk to productivity
From the point of view of the risk negative emotions are the most important. Taking into consideration both impact on productivity and the frequency of the programming, frustrated is the most risky emotional state. The next state disgusted could be misinterpreted by respondents, which was discussed in Chapter III-B. Other negative emotional states have similar, relatively low risk value. The desired emotional states are those with the highest value of the product, which can be called opportunities. On one hand, they are relatively easy to induce in the developers, but at the same time have large positive effects on productivity. Of course, it seems impossible to easily
influence the user to switch his emotional state directly from frustration to enthusiasm. Therefore, emotions transition model for developers was proposed, which is shown in the Fig. 5.
Fig. 5.
Emotions transition model for developers
The only negative emotion, which has been recognized by some people that may have a positive impact on productivity is angry. Therefore in the proposed model the first step should be to transform the emotional state of the user from frustrated to angry. In the next step calm user emotions to content state. At this point, the state of enthusiastic can be induced. This hypothetical model will be verified in further studies, including the development of suitable transition algorithms. E. Influence of experience on the results of the study The survey also collected data on the experience of working as a programmer. Respondents had a choice of five ranges. The results of the collected data is shown in Table VIII. TABLE VIII E XPERIENCE OF RESPONDENTS Years of experience More than 15 9 - 14 5-7 2-4 Less than 1
Number of respondents 1 8 14 24 2
Due to the small number of people with experience of more than 14 years and less than 1 year, 3 ranges were separated: • less than 4 years (-4), • between 5 and 8 years (5-8), • more than 9 years (9+). The compilation of information about the experience and Q3 results showed that respondents with more experience believe that emotions have a greater impact on their productivity. This is in contrast to the novice programmers. Table IX shows that more experienced developers assessed greater impact of emotions both positive and negative, on
TABLE IX Q3 RESULTS DIVIDED ACCORDING TO EXPERIENCE Emotion Happy Enthusiastic Pleased Optimistic Enjoying Content Unhappy Frustrated Disgusted Disappointed Angry Depressed
9+ 2,00 1,78 1,67 1,88 1,86 1,67 -2,00 -1,63 -1,63 -1,29 -1,13 -2,00
5-8 1,69 1,79 1,62 1,62 1,38 1,08 -1,08 -0,92 -1,33 -1,25 -0,85 -1,58
-4 1,08 1,44 1,16 1,00 0,87 0,77 -0,90 -1,12 -1,26 -0,95 -0,83 -1,06
their performance. The exception is for frustrated emotional state. But one should not conclude that emotions have less impact on novice programmers. Rather, it is more reasonable to say that more experienced developers understand the true role of emotions in work. TABLE X Q3 RESULTS DIVIDED ACCORDING TO EXPERIENCE Emotion Happy Enthusiastic Pleased Optimistic Enjoying Content Unhappy Frustrated Disgusted Disappointed Angry Depressed
5+ 1,79 1,78 1,64 1,71 1,55 1,32 -1,31 -1,19 -1,45 -1,26 -0,95 -1,69
-4 1,08 1,44 1,16 1,00 0,87 0,77 -0,90 -1,12 -1,26 -0,95 -0,83 -1,06
Due to the smaller sample size in the range of 9 and more years, the compartments have been merged. Table X shows the results from Q3 divided into two compartments: more then 5 years (+5) and less then 4 years (4-). Analysis of the data indicates that generally the order of evaluation of emotions is not significantly different in the two compartments. The average values of answers to questions Q2, presented in Table XI, show that advanced programmers often experience more positive emotions in their work, while novice negative once. This may result from the experience which allows better control of their emotions with greater distance to work. IV. C ONCLUSIONS The article presented the results of a survey on the experience of emotion in the work of software developers. A large number of surveyed software developers entitles to state reasonable answers to research questions. Among the negative emotional states, the majority of respondents indicated that they most often experienced frustration. This emotional state was also assessed as the most
TABLE XI Q2 RESULTS DIVIDED ACCORDING TO EXPERIENCE Emotion Content Optimistic Pleased Enthusiastic Enjoying Happy Frustrated Angry Disgusted Disappointed Depressed Unhappy
5+ 3,70 3,65 3,48 3,43 3,04 2,87 2,52 2,26 2,04 2,00 1,61 1,48
-4 2,85 2,69 3,12 2,96 2,54 2,69 3,04 2,42 2,00 2,08 1,46 1,85
disturbing in high productivity and therefore, it is the most risky. Another emotional state, to which further research shall be paid particular attention is angry. It was the only negative state assessed as increasing productivity by notable part of the respondents. Among the positive emotions developers distinguished an enthusiastic state. It was assessed as having the most positive impact on productivity. At the same time, it was frequently experienced by respondents in their work. Further work on the role of emotions in software engineering will proceed in two ways. The first part will address the developers emotional states transition model. The concept proposed in Chapter III-D will be validated. The research will specifically focus on the transition from frustration to enthusiasm. Next step will be to develop mechanisms to induce appropriate emotions in developers. Only then it will be possible to develop prototype tools to verify the assumed model. The second path involves a more accurate exploration of emotions associated with the software development. The corresponding experiments using biometric sensors and malicious IDE were already designed. Subsequent research will be carried out with the RGB-D camera and FEEDB database [19]. This way it will be possible to examine the real emotions of users, including those they do not want to reveal or do not realize.
R EFERENCES [1] Fisher CD, , Ashkanasy NM (2000) The emerging role of emotions in work life: An introduction. Journal of Organizational Behavior, 21(2): 123-129. [2] Seo MG, Barrett LF, Bartunek JM (2004) The Role of Affective Experience in Work Motivation. Academy of Management Review, 29(3): 423-439. [3] Weiss HM, Cropanzano R (1996) Affective events theory: A theoretical discussion of the structure, causes and consequences of affective experiences at work. Research in organizational behavior, 18: 1-74. [4] Couger JD, Adelsberger H (1988) Environments: Austria compared to the United States. ACM SIGCPR Computer Personnel, 11(4): 13-17. [5] Ramachandran S, Rao SV (2006) An effort towards identifying occupational culture among information systems professionals. In Proceedings of the 2006 ACM SIGMIS CPR conference on computer personnel research: Forty four years of computer personnel research: achievements, challenges & the future, 198-204, ACM. [6] ”2012. Status of Telework in the. Federal Government. Report to the Congress.”, United States Office of Personnel Management, retrieve from http://www.telework.gov/Reports and Studies/Annual Reports/ 2012teleworkreport.pdf [7] Wynekoop JL, Walz DB (1998) Revisiting the perennial Question: are IS People Different? The Database for Advances in Information Systems, 29(2): 6272. [8] Picard R (2010) Affective computing: From laughter to IEEE. IEEE Transactions on Affective Computing, 1(1): 11-17 [9] Duo S, Song LX (2012) An E-learning System based on Affective Computing. In Physics Procedia, 24: 1893-1898. [10] Landowska A (2013) Affect-awareness Framework for Intelligent Tutoring Systems. In Proc. of 6th International Conference on Human System Interaction. [11] Beecham S, Baddoo N, Hall T, Robinson H, Sharp H (2008) Motivation in Software Engineering: A systematic literature review. Information and Software Technology, 50(9): 860-878. [12] Dasborough MT, Sinclair M, Russell-Bennett R, Tombs A (2008) Measuring emotion: methodological issues and alternatives. Research companion to emotions in organizations, 197-208. [13] Watson D., Clark LA, Tellegen A (1988) Development and validation of brief measures of positive and negative affect: the PANAS scales. Journal of personality and social psychology, 54(6). [14] Mehrabian A (1997) Comparison of the PAD and PANAS as models for describing emotions and for differentiating anxiety from depression. Journal of psychopathology and behavioral assessment, 19(4): 331-357. [15] Brief AP, Burke MJ, George JM, Robinson BS, Webster J. (1988) Should negative affectivity remain an unmeasured variable in the study of job stress? Journal of Applied Psychology, 73(2). [16] Fisher CD (1998) Mood and emotions while working-missing pieces of job satisfaction. Journal of Organizational Behavior, 21(2): 185-202. [17] Oatley K, Johnson-Laird PN (1987) Towards a cognitive theory of emotions. Cognition and emotion, 1(1): 29-50. [18] ISO/IEC 27005:2008. Information security risk management. ISO/IEC. [19] Szwoch M (2013) FEEDB: a Multimodal Database of Facial Expressions and Emotions. In Proc. of 6th International Conference on Human System Interaction.