3INRS-Telecommunications, Verdun, Quebec, Canada. 4Dept. of Elect. Eng., McGill University, Montreal, Canada. ABSTRACT: A new approach to parametric.
Int. Conf. Telecommun. (Melbourne), pp. 1033-1037, April 1997
Extended Source Localization using the ESPRIT Algorithm S. Shahbazpanahi 1 J S. Valaee 2 ,1 J B. Champagne3 J P. J( abaf! 1
Dept. of Elect. Eng., Sharif University of Technology, Tehran, Iran
2Dept. of Elect. Eng., Tarbiat Modares University, Tehran, Iran
3INRS-Telecommunications, Verdun, Quebec, Canada
4Dept. of Elect. Eng., McGill University, Montreal, Canada
alent to a superpositIOn of plan~waves originat ing from a continum of angles [4]. Other exam ples are acoustic sources in a reverberant room, tropospheric or ionospheric propagation of radio waves, the reflection of a low radio link signal from ground, etc. The above examples show the impor tance of the distributed source modeling. Jantii [4] models a distributed source as a sum of finite number of point sources and then estimates the angle of arrival of those point sources using the MUSIC and ESPRIT algorithms. A shortcoming of this technique is that for unique localization of sources, the number of point sources must be upper bounded by the number of sensors [5]. Fur thermore, inference of the spatial extension using the point source location estimate is not Clear.
ABSTRACT: A new approach to parametric localization of a distributed source is proposed. This method is based 071 the ESPRIT Algorithm. the Central angle and the angular extension of an incoherently distributed source are estimated. This algorithm has a low computational complex ity. The method does not require array calibration
1
Introduction
Array signal processing is used to detect and lo calize signal emitting sources. Several algorithms ranging from the low to high resolution techniques have been proposed in the literature. The conventional array processing techniques assume point source modeling. By a point source, we mean that the radiated energy is emitted from a discrete angle in space. Various algorithms have been developed for point source localization. Among these methods, MUSIC [I] and ESPRIT [2] [3] are well-known. MUSIC carries out a one dimensional search over the MUSIC spatial spec trum to find its prominant peaks. The location of these peaks corresponds to the estimate of the Direction Of Arrivals (DOA). In constructing the MUSIC spectrum, one needs to measure the ar ray manifold, the set of possi ble steering vectors over all angular parameters. This is called array calibration which is practically expensive. An al ternative is to use the ESPRIT algorithm which does not need array calibration. The point source modeling may fail in certain practical situations. For example, the variation of sound speed in water may cause energy be distributed over an angular volume in a bottom mounted passive sonar. In an undersea echo beam sounder, scattered signal from lower layers is dis tributed over an angular volume which is equiv
Valaee et.al. [6] have presented a parametric method for localization of distributed sources. They generalize the concept of the signal and noise subspaces and derive a MUSIC-type spatial spec trum estimator. Similar to the original MUSIC algorithm, their approach also requires array man ifold calibration. In this paper, a new technique is presented for estimation of the central angle and the angu lar extension of a IIniform incoherently distributed (UI D) source. Estimation of the central angle is performed using an ESPRIT-type algorithm. Hence, there is no need for array calibration. The angular extension is estimated using the eigenval ues of covariance matrix. It is shown that the co varinace matrix for a uniformly distributed source can be represented in terms or the Discrete Prolate Spheroidal Sequences (DPSS) [8]. The paper is organized as follows. In the next section, the array output model for distributed sources is presented. Properties for the uniform linear array (ULA) covariance matrix is expressed 1
in Section 3. Section 4 summerizes the estimation algorithm and Section 5 contains the simulation results.
a(8)p(8, 8'; l/Jm)a H (8')d8d8'
+ O'~I, (5)
~[:[:
R xy =
a( 8)p( (), ()'; l/Jm )e jwoT (8') a H (8')dOdO'(6)
2 Distributed Source Modeling
where O'~ is the noise power and
Consider an array of 2p sensors (p doublets). As sume that the two sensors in each doublet are iden tical and have the same gain and phase and sen sitivity pattern and are seperated by a constant displacement vector d. It means that the array is divided into two subarrays. We call them the X and Y subarrays. Also, it is assumed that q narrowband distributed sources with central fre quency Wo are present in the environment of these subarrays. The complex envelope of the out.put of ith sensor in subarray X is
is the aTigulal' cross correlation for the source m. If different rays of the signal which arrive at the array are uncorrelated, the source is called an in coherently distributed (ID) source. This model has been introduced in [9] ancl [6]. For an ID source, we have
E{s(8, l/Jm)s·(8', l/Jm)} = p((), l/Jm)J(8 - 8')
(8)
where p(O, l/Jm) is called the angulm' power density.
(I)
3 ULA Covariance Matrix where aj (8) is the response of the ith sensor to a unit energy source emitting at direction 0, s( 8, l/Jm) is the angular density of the mth source, l/Jm is the mth source location parameter vector, and n",; is the additive zero mean noise at the ith sensor. The corresponding element output in sub array Y is
= 2: q
Yj
~
f'w aj(8)e-
jwoT
(8)s(8, l/Jm)d8
+ n y ; (2)
m=! - ,
where n y ; is the additive zero mean noise at. t.he ith sensor of the subarray Y, and r(8) is t.he prop agation delay between t.he identical elements of a doublet for the signal arriving at the direction (). Using a vector notation, we have
=2: f'w a(8)s(8,l/Jm)d8+u q
x y
=
aj(8) = ej (j-!) .... in(8).
x,
(3)
2: f'w e~
jwoT
(8)a(8)s(8, l/Jm)d8
+ n y (4)
m=! - ,
where x and yare the subarray X and Y output vectors, respectively, n x and u y are the noise vec tors for subarray X and Y, a(()) is the location vector for a source at the direction (). For uncorrelated sources, the covariance matrix at the output of array X and the cross-covariance matrix between the two subarrays are [6]
(9)
Therefore, for a single ID source scenario, the mnth element of the covariance matrix can be written as
= j' , w
[R] xx mn
"')d8 ej(m-n) .... in 8 p (8 ,'f/
_~
+ O'num-n· 2r (10)
For a uniformly distributed source,
~
m=! - ,
q
For a uniform linear array with interelement spac ing ~ (half the signal wavelength), the response of the ith sensor for a signal arriving at.. the angle 8 made with the array broadside is
I
p(8,l/J) =
2A {
if /8 - 80 I < L\
(11 )
0 otherwise
where 80 is the source central angle and L\ is the source half extension width,
for small L\, it can be shown that [4], [7]
- ej (m-n)7r 9in(8 0 ) [R] xx mn sin( (m - n)1T L\ cos( ()o))
x
(m - n )1T L\ cos () ()o
+0'~om_n(13)
Planar wavefront
Define W
9
LJ. ~
= "2 cos(90),
( 14)
~O.O.O.O.
d
and the p x p matrix M(W) as [M ( W )] mn
~ sin(21TW(m -
1T ( m - n )
n))
• Y subarray
oX subarray
(15)
.
(b)
Then
[R] xx mn
j (m-n)1rsin(B o)[M(W)] = _l_e 2vV
mn
+u 2 6_ n
m
Planar wavefront n
(16)
X Subarray
which can also been written as I
R xx = 2W DM (W)D
11
2 + Un!
( 17)
0
0
Y Subarray.
•
where
•
• •
(a)
D = diag(I,ej1rSin90, ... ,e j1r (P-I)sin9 0).
(18)
diag(-) is a representation for a diagonal matrix with the diagonal elements in the parantheses. The eigenvectors of M(W) are the Discrete Pro late Spheroidal Sequences (DPSS)[8]. A good ap proximation to the eigenvalues of M(W) is [8]
-'k(W)
o
~
..!.(21TW)2k+ 1G(k, p) k = 0, I, ... ,p - I 1T ( 19)
where
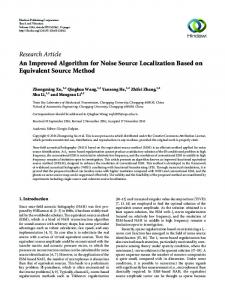
Figure 1: Two possible subarray configurations. where sin (21TW(m - n - 2d/-' tan 00 )) [M (W)]mn= 1T(m-n-2d/-'tan(00)) . "
(26) In the above equations, d is the magnitude of dis placement vector between the two subarrays.
4
The proposed estimation technique is summarized as follows:
It can be seen that
-'0 -'I
~
~
2Wp,
(21)
1
36(P-l)p(p+I)1T 2 (2W)3.
(22)
In the same manner, it can be shown that for the array configuration shown ill Fig.l (a), the cross covariance matrix, is R(a) xy
=
ej21rd/ A 8in(9 0 ) DM'(W)D H 2W
(23)
I. The central angle is estimated using the TLS ESPRIT algorithm [2]. TLS-ESPRIT is im plemented in four steps:
(a) Let
sin(21TW(m-n-2d/-')) [M (W)]mn = 1T(m _ n _ 2d/-') . (24) I
The superscript (a) represents the correlation ma trix associated with Fig.1 (a). For the array con figuration shown in Fig.l(b), it is easy to show that
=
ej21rd/ABin(90)
2W
DM"(W)D H
(25)
z=[;],
(27)
and define R zz as
R zz
where
R(b) xy
Estimation Algorithm
~ E{zzH} = [~:; ~::],
(28) and let eo be the eigenvector of R .. cor responding to the largest eigenvalue of RH . (b) Then eo is written as eo = [ eox ] eOY
I
(29)
where eox and eOY are the upper and the lower half of e, respectively.
5
(c) Define Exy as A
Exy=[eox eoY].
(30)
Compute the eigendecomposition of E~yExy,
E~yEx}' = EAE H .
(31)
For a single distributed source, E is a 2 x 2 matrix and can be written as (32) (d) For Fig.l(a), (Jo is estimated as
. _1{Aar g(-E 12 /E n )} (J-0= Sin 21rd
(33)
Simulation
In this section, the computer simulations are pre sented. The simulated array consists of 32 om nidirectional sensors, 16 sensors in each subarray. The two subarrays are displaced from each other as shown in Fig. l(a) with d = A/15. the source power is distributed uniformly and incoherently over the angular interval [(Jo - ~, (Jo +~] , where (Jo = 30 deg. Parameter ~ is chosen to be 1,2,3 and 4 degrees in different trials. Fig. 2 and Fig. 3 show the bias and the variance of the central angle estimation, respectively, for different values of ~. Fig. 4 and Fig. 5 show the bias and the variance of the extension width estimate, ~, respectively, for different val ues of ~.
and for Fig.l (b), (Jo is estimated as
(J-
o
= cos
-1
{A arg( -E 12 / E22)} 2rrd
(34)
2. According to Equation (13) it is clear that
[Rrx]mm
= 1 + IT~.
(35)
Hence the noise power estimate, o-~ is o-~
= min{diag(Rrx )} -
1.
(36)
The noise free covariance matrix (37) can be estimated from
3. The parameter W is estimated using (22). Let I ( be the second eigenvalue of (R xx ) N F. From (22) and (37), we have l(
Al
= 2W
1
2
2
= 36(P-I)p(p+ 1)411' W. (39)
Hence
(p - 1)p(p + 1) .
(40)
Note that the first eigenvalue of (R xx ) N F can not be used for the estimation of W. In fact, from (21) and (37) it is clear that the largest eigenvalue of (Rxx)NF is approximately inde pendent from W, that is 10
~ p
4. Having Wand (Jo, one can estimate ~
= 2 W/ cos (Jo.
(41 ) ~
References [1] R. O. Schmidt, "Multiple emitter location and signal parameter estimation," IEEE Trans. Antenn. Propagat., vol. AP-34, pp. 276-280, Mar. 1986. [2] R. Roy and T. Kailath, "ESPRIT-Estimation of Signal Parameters via Rotational In variance Techniques," IEEE Trans. Acoust., Speech, Signal Processing, vol. 37, no.7, pp. 984-995, July 1989. [3] It Roy, A. Paulraj and T. Kailath, "Direction of arrival estimation by subspace rotation methods-ESPRIT," ill Proc. IEEE Int. Can!. Acoust., Speech, Signal Processing, Tokyo, 1986, pp. 47.2.1-47.2.4. [4] T. P. Jantii, "The influence of extended sources on the theoretical performance of the MUSIC and ESPRIT methods: Nar row balld sources," in Proc. IEEE Int. Conf. Acoust., Speech, Signal Processing, San Fran cisco, Mar 1992, pp. II-429-II432. [5] M. Wax, "On unique localization of constrained-signal sources," I EEE Trans. Signal Processing, vol. 40, pp.1542-I547, June 1992. [6] S. Valaee, B. Champagne and P. Ka bal, "Parametric localization of distributed sources," IEEE Trans. Signal Processing, vol. 43, no. 9, pp.2144-2153, Sep. 1995.
using (42)
[7] S. Shabazpanahi, S. Valaee and M. M. Nayebi, "Spatial parameters estimation
30.2
lU
L\=3
Q) I\t-
o
ffiQ.)
2
30.1
4
30
~3
t1=4
=3
Q.)
0
29.9
"-
t1=2
02
29.8 L -_ _- - '
a
5
-----'-
10
SNR
-----'-
15
c
lU
._
20
Q)
L\= I
21
Figure 2: The mean of the estimate of the ct'ntral angle for different values of the extension width 6..
O L - - - L . . - - - - L -_ _L..--_---l
eo
a
5
1.5.--------,-----,-------,-------,
"-
SNR
15
20
Figure 4: The mean of the estimate of the exten sion wiJ th 6..
lU
Q) I-
10
1
o
Q.)
u
c
~
0.5 L\=1 L\=3
o~___L a 5 _
____=::=::::===c~d 10 15 20
SNR
Figure 3: The variance of the estimate of the cen tral angle for different values of the extension width 6..
eo
~
1
Q.)
o
\t-
O
of distributed source," submitted to Ira nian Conf. Electrical Engineering (ICEE97), Tehran, Iran. (8] D. Slepian, "Prolate spheroidal wave func tions, fourier analysis, and uncertainty- V: the discrete case," The Bell System Technical Journal, pp. 1371-1430 May-June 1978. (9] S. Haykin Ed. A rray Signal Proassing. En glewood Cliffs, NJ:Prentice-Hall, 1985.
t1=4
5
10
SNR
15
20
figure 5: The variance of the estimate of the ex tension width 6..