Abstract. This paper describes a fault detection mechanism that uses the error codes returned by the stream sockets to lo- cate process failures. Since these ...
Fault Detection Using Hints from the Socket Layer Nuno Neves
W. Kent Fuchs
Coordinated Science Laboratory University of Illinois at Urbana-Champaign Urbana, IL 61801
School of Electrical and Computer Engineering Purdue University West Lafayette, IN 47907-1285
Abstract This paper describes a fault detection mechanism that uses the error codes returned by the stream sockets to locate process failures. Since these errors are generated automatically when there is communication with a failed process, the mechanism does not incur in any failure-free overheads. However, for some types of faults, detection can only be attained if the surviving processes use certain communication operations. To assess the coverage and latency of the proposed mechanism, faults were injected during the execution of parallel applications. Our results show that in most cases, faults could be found using only the errors from the socket layer. Depending on the type of fault that was injected, detection occurred in an interval ranging from a few milliseconds to less than 9 minutes.
1
Introduction
Systems targeted to support the execution of longrunning parallel applications should provide fault detection and recovery, since the probability of failure increases with the execution time and number of used nodes. However, since applications of this type do not have highavailability or safety requirements, they are only willing to accept small decreases in performance caused by the faulttolerance mechanisms. This paper describes a way to detect failures in distributed systems, whose main advantage is having minimal overheads during failure-free operation. Conceptually, the fault detection mechanism is very simple. It looks at the values returned by the stream socket functions as a process exchanges messages. If one of these values belongs to the set of errors associated with process failures, the mechanism can assume that the remote process was terminated. Fault detection based solely on these Nuno Neves was supported in part by the Grant BD-3314-94, sponsored by the program PRAXIS XXI, Portugal. This research was supported in part by the Office of Naval Research under contract N00014-951-1049, and in part by the Defense Advanced Research Projects Agency (DARPA) under contract DABT 63-96-C-0069. Any opinions, findings and conclusions or recommendations expressed in this material are those of the authors and do not necessarily reflect the views of DARPA.
errors is not accurate since some errors might indicate a process failure, when in reality there was a network problem [1]. Nevertheless, the errors imply that at least the socket has to be recovered. This paper studies two stream socket implementations based on the TCP/IP communication protocols, four types of faults that result in the termination of a process, and two parallel applications. The types of faults that were analyzed ranged from the simplest one where a process failed without disturbing the rest of the system, to permanent machine failures. It was determined for each type of fault in which cases the stream sockets returned an error, and which errors were reported. It was observed that all considered faults could be detected as long as the surviving processes attempted to communicate with the failed process. However, some types of faults were only found if processes used particular communication operations. Our experimental results show that in most cases the process failures could be located using the errors reported by the stream sockets.
2
Related Work
The fault detection problem in distributed systems has been usually solved either using a process membership service, or a distributed system-level diagnosis protocol. Process membership services have been developed in the context of group-based systems, and their main objective is to provide a consistent view of which processes are currently members of a group, despite process joints, departures or failures [2–8]. Distributed system-level diagnosis protocols locate process failures, and then distribute this information in such a way that each node can independently determine the set of failure-free processes [9–14]. Membership services normally assume that processes fail by crashing, and that the communication subsystem can suffer from performance or omission failures. Failures of this type lead to detection mechanisms based on watch-dogs. On the other hand, distributed diagnosis uses a polling-based mechanism, since the assumed failure model requires explicit testing to detect failed processes [15, 16]. There are
also recent results on categorizing crash failures [17]. The main motivation for our work is to make the best use of an available fault detection mechanism, the error codes returned by the stream sockets. Process failures can be located in a timely manner if there is a correct understanding in which cases errors are reported by the stream sockets. The information about the failures can then be disseminated using one of the previously proposed membership or distributed diagnosis protocols. The results presented in this paper are applicable to a large number of applications, since the stream sockets are one of the most common communication interfaces utilized to program distributed applications.
3
Types of Faults
Four distinct types of faults were examined, each resulting in the termination of a process, but with different behaviors observed at the socket interface. The four types of faults that were considered were: Kill : The fault terminates the process, but does not affect the rest of the system. Examples of this type of fault are the following: the process is aborted because it executed an illegal instruction; the owner of the machine kills the process; or one of the assertions of the program is violated, and the process exits. Crash : The machine where the process is running crashes permanently or stays down for a long period of time. Examples of this type of fault include a permanent
-- Reset -- Timed Out -- Send Queue empty -- Send Queue not empty -- Receive Queue empty -- Receive Queue not empty -- Read -- Write -- Read Blocks in the OS -- Write Blocks in the OS
Error values: 0 -- Read returns 0 bytes BP -- Broken Pipe CT -- Connection Timed Out CRP -- Connection Reset by Peer IA -- Invalid Argument SBP -- Signal Broken Pipe
Figure 1: Terminology used in the state diagrams.
Background
Stream sockets based on the TCP/IP communication protocols offer a full-duplex connection between processes [18]. Processes establish a connection by opening a socket. Messages are exchanged by writing to or reading from the socket. Stream sockets deliver messages reliably and in order, but they do not preserve message boundaries. TCP uses checksums, sequence numbers, and acknowledgments to guarantee that messages are not lost or damaged [19, 20]. Conceptually, each byte of a message is assigned a sequence number. When TCP wants to transmit a message, it adds the sequence number of the first byte and the size of the message. Then, it saves a copy of the message in a send queue and starts a timer. The message is removed from the queue as soon as the acknowledgment arrives. If for some reason the acknowledgment is lost or delayed, TCP re-transmits the message when the timer expires. The receiver side saves the messages on a receive queue until the process reads them and uses the sequence numbers to detect duplicate messages due to retransmissions.
4
Inputs: RST TOUT SQ=0 SQ!=0 RQ=0 RQ!=0 R W R_Block W_Block
failure in one of the machine's components, or a situation in which an unattended machine crashes and no one is available to restart it . Reboot : The machine where the process is executing shuts down, and then boots. A machine might be rebooted because a new software version requires rebooting in order to be installed, or because the machine is not performing as expected. Crash & boot : The process is running on a machine that crashes, and then boots. Possible causes of such faults include power failures, incorrect usage by users, or operating system bugs.
5
Fault Detector
This section describes in which circumstances the stream sockets generate an error after a process failure. Two stream socket implementations were studied, both built on top of the TCP/IP communication protocols. The first implementation is based on the Berkeley sockets (SunOS 4.1.3) and the second implementation is based on the streams from the UNIX System V R4 (Solaris 2.5). From the various functions of the socket interface that can be used to send or receive information, we chose to study the read and write system calls. The other functions provide similar error codes. To simplify the presentation, it is assumed that sockets are configured for blocking I/O (e.g., a read blocks when there are no messages available). The same errors would be seen if the sockets were set for nonblocking I/O. A state diagram that explains the behavior of the sockets after the termination of a process was developed for each type of fault. The diagrams were derived by looking at the values returned by the read and write system calls, and at the messages exchanged by the surviving machines
R, ok | W, ok
RQ!=0&SQ!=0 RQ!=0&SQ!=0 W, ok
1
OK
R, ok | W, ok
RQ!=0& SQ=0
3
R, ok RQ=0
RQ=0& SQ=0
W, ok
1 RQ!=0& SQ=0 RQ=0
W, SBP RST
RST R, CRP
RQ=0 R, 0
2
W_Block, BP
5
W, SBP
F
RST
4
R, 0
RQ=0& SQ=0
RST
3
R, ok
RST1
RQ=0 W_Block, SBP
R, ok
OK
2
W, ok
W, SBP
RQ=0
F W, SBP
R, 0
4
W_Block, BP
RQ=0&SQ!=0 RQ=0&SQ!=0
W, ok
W_Block, IA
R, 0 | W, ok
RST
RST2 R, CRP
5
R, 0
W_Block, IA
R, 0 | W, ok
Figure 3: State diagram for kill fault on SunOS. Figure 2: State diagram for kill fault on Solaris. and the machine where the failure occurred. In the following subsections the term local is used to identify the failed machine, and the term remote denotes the machine that detects the fault by trying to communicate with the failed one. The terminology used in the state diagrams is presented in Figure 1.
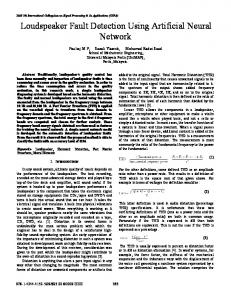
5.1 Kill Whenever a kill fault terminates the execution of a process, the operating system asks the local TCP to close all connections associated with the process. A connection allows messages to travel in two directions, therefore, both directions have to be shut down before the connection is completely closed. During the closing procedure, the local TCP sends a special FIN message to the remote TCP indicating that no more messages will be sent.1 Next, it completely closes the connection. After receiving the FIN message, the remote TCP closes the receive-half of the connection, but leaves the send-half open. When it tries to transmit a message, the local TCP responds with a RST message. The remote TCP completely closes the connection when the RST arrives. The low-level messages exchanged between the TCPs result in errors returned by the socket interface. These errors are used by the fault detection mechanism to locate process failures. Figure 2 displays the various stages that a connection can undergo after a failure, as perceived by a remote process running on a machine with the Solaris operating system. The connection goes from state OK to one of the first four states depending on the status of the send and receive queues when the FIN message arrives. If the send queue is empty (SQ=0), there is a transition to either state 1 or 2. The connection goes to state 1 provided that there are messages to be read (RQ!=0); otherwise, it goes to state 2 (RQ=0). In state 1, the process reads the queued 1 A process can also close a connection by calling the close or shutdown system calls. When this happens, the same FIN message is
sent by the local TCP. Therefore, the fault detection mechanism must be disabled on a particular connection, before that connection is closed.
messages without being informed about the failure. When the receive queue becomes empty (RQ=0), the connection goes to state 2. In this state, the failure is detected by a read call because the function returns 0 bytes. The connection remains in state 1 and/or 2 as long as no messages are transmitted to the failed process. There is a transition to state 3 or 4 if the process executes a write. The connection can also leave state OK to one of these two states if the send queue was not empty at the moment of the failure (SQ!=0). The connection stays in states 3 and/or 4 during a short period of time, corresponding to the interval limited by the send of the message and the reception of the RST. Then, the connection moves to state RST. If the process blocks in the operating system while doing a write (W Block), the function returns the error broken pipe when the RST arrives. This error can be used to detect the failure. The blocking happens if the process attempts to send a message larger than the available space in the send queue. The arrow from OK to RST corresponds to the case when the process is blocked in a write before the FIN message arrives. Any read or write call from RST state produces an error that can be used to detect the failure. The first read gives connection reset by peer, and the subsequent ones return 0 bytes. A write from the state 5 or RST generates a signal broken pipe that is thrown to the process. Unless this signal is caught, it terminates the execution of the process. Figure 3 displays the state diagram for the case when the fault is detected by a process running on a machine with SunOS (for space reasons, we will present only this diagram for the SunOS). There are two main differences between SunOS and Solaris. The first one is related to the writes that block in the operating system (W Block). In SunOS, these writes usually generate a signal broken pipe when the RST arrives. The only exceptions are in states 3 and 4, where the error invalid argument is returned (in state 4, the process sometimes received the signal broken pipe). The second difference is related to the messages stored in the receive queue. In SunOS, a process can continue to read these messages even after the reception of the RST, without generating any errors.
R, ok | W, ok
RQ!=0&SQ!=0 RQ!=0& SQ=0
OK
1
R, ok RQ=0
RQ=0& SQ=0
W, ok
RB W, ok
T O U T R, CT
5
W, SBP
F
OK
TOUT
R_Block
2
R, ok
W, SBP TOUT
R, ok | W, ok R, 0
3 RQ=0
RQ!=0&SQ!=0
W_Block, BP
R, 0
4
W, ok
1
RQ=0
RQ=0& SQ=0
W_Block, BP
W, ok
2
5 W, SBP
TOUT
RQ=0
RQ!=0& SQ=0
R, 0
T O UT R, CT
3
W, SBP RST
4
RST R, CRP
F W, SBP
6
R_Block, CT RQ=0&SQ!=0
R, 0
W, ok W_Block, BP
Figure 4: State diagram for crash fault on Solaris.
2 Even though a network partition does not terminate a process, it gives the same type of errors as a crash. This is a problem that has to be solved by any fault detection mechanism for distributed systems. Typical solutions require the processes that were assumed to have failed to terminate their execution. 3 The optional keepalive mechanism of TCP would allow the detection of the crash fault when the process blocks in a read. However, the detection latency is typically around 2 hours, which makes this mechanism not very useful.
W_Block, BP
Figure 5: State diagram for reboot fault on Solaris.
5.2 Crash When a crash failure occurs, all the processes that were running on the machine terminate their execution. With this type of failure no warnings are transmitted to the remote TCPs. However, they can be detected if a remote TCP tries to communicate with the failed one. Since no acknowledgments are received in response to the sent messages, the remote TCP re-transmits the messages a certain number of times until it gives up, and then closes the connection. At that moment, an error is passed to the socket layer indicating a communication problem.2 After a crash, a process running on a Solaris machine observes the connection going through the stages depicted in Figure 4. As with the kill fault, the transition to one of the first four states depends on the condition of the send and receive queues. The connection goes from state 2 to state RB if the process attempts to read a message. In this state, the process blocks indefinitely in the operating system while it is waiting to receive a message from the failed process. The RB state corresponds to a case where the failure is not detected using only the errors from the sockets.3 The connection goes to states 3 and 4 if there is a message to be transmitted. This can happen because the send queue was not empty when the failure occurred, or because the process tried to send a message. The connection stays in either one of these states until there is a time out and TCP closes the connection. If the process reads a message while the connection is in state 4, it blocks in the operating system as in state 2. However, the read returns the error connection timed out after the time out takes place. The write system call issues the error broken pipe if the process blocks in the operating system while sending a message in
R, 0 | W, ok
RQ=0&SQ!=0
R, ok | W, ok
RQ!=0&SQ!=0
W_Block, BP W, ok
1
RQ!=0& SQ=0
RB
RQ=0
RQ=0& SQ=0
W, SBP
RQ=0
R, ok
OK
3 RST | T OUT
T OU T / R, CT RST | T OUT R S T R, CRP
5
W, SBP
F
R_Block
2
RQ=0&SQ!=0
W, ok
R, 0
4 R_Block, CT | R_Block, CRP
W, ok W_Block, BP
Figure 6: State diagram for crash & boot fault on Solaris. states OK through 4. Once the connection reaches the TOUT state, the next read or write returns an error.
5.3 Reboot The reboot of a machine can be divided into three phases. During the first phase, while the machine is shut down, the operating system syncs all disks and tells TCP to close all connections. TCP transmits a FIN message through each connection, and then awaits an acknowledgment (for a few milliseconds). The second phase corresponds to the initial period of the booting procedure. During this period, no messages are sent, even to respond to remote requests. In the last phase, messages start to be transmitted and received as usual; however, all the knowledge about previous connections is lost. The TCP layer answers with a RST message to all incoming messages received at the end of the first phase (when the connections are closed), or after the third phase has started. Figure 5 displays the various stages that a connection can experience after a reboot fault. Following the reception of the FIN message, the connection goes to one of the first four states; the specific state depends on the condition of the send and receive queues, as was explained for the kill fault. There is a transition from state 3 or 4 to state RST, if TCP receives a RST in response to a sent message. Once in state RST, the fault is detected by the next read or write. The connection can also go from state 3 or 4 to the state TOUT if no messages were transmitted in the
Table 1: Summary of the conditions and errors for the stream sockets on Solaris. Kill Crash Reboot Crash & boot
Condition FIN arrived & Receive queue empty message send & RST arrived message send & Time out FIN arrived & Receive queue empty message send & (RST arrived or Time out) message send & (RST arrived or Time out)
first phase of the reboot that resulted in a RST, and if the second phase of the reboot takes longer than the time out period. This situation usually does not occur; however, it was added for completeness. A read or write after the connection has reached the TOUT state produces an error.
5.4 Crash & boot With a crash & boot fault the machine crashes, terminating all processes, and then boots. As with crash faults no FIN messages are transmitted. Therefore, detection is only possible if the remote TCPs try to send messages to the failed TCP. During the booting of a machine, there is an initial period where incoming messages are not acknowledged; then, in a second phase, communication is restarted. Messages belonging to previous connections that are received in the second phase are answered with a RST. The reception of the RST closes the connection of the remote TCP. The state diagram for the crash & boot fault is represented in Figure 6. This fault can be seen as a special crash fault, for which detection can be accomplished earlier if a RST is received before the time out occurs. The rest of the diagram should be interpreted like the one for the crash fault.
5.5 Summary The previous four subsections explain, for each type of fault, in which circumstances the stream sockets generate errors. Failures are located using basically two methods: in the first method, the TCP from the machine affected with the fault sends a FIN message informing the other TCPs about the process termination; in the second method, one of the surviving TCPs attempts to send a message to the failed TCP, and then either receives a RST as response or receives no answer until the connection times out. When TCP determines that there was a failure, it informs the socket layer, which subsequently returns an error to the application. Table 1 presents a summary of the conditions for fault detection and the errors reported by the stream sockets on a Solaris machine. On a SunOS machine the error invalid argument also has to be considered.
6
Function read read/write read/write read read/write read/write
Error 0 CRP / BP, SBP CT / BP, SBP 0 CRP, CT / BP, SBP CRP, CT / BP, SBP
Experimental Results
6.1 Applications and Environment To assess the coverage and latency of the fault detection mechanism, faults were injected during the execution of a particle simulator and a raytracer. These applications were chosen because they represent two of the most common parallel programming models. These applications also have different communication frequencies, and are sufficiently large to be considered complete parallel applications. The particle simulator, ising, simulates in two dimensions the spin changes of Spin-glass particles at different temperatures [21]. Ising is a geometric decomposition application where each process solves a subregion of the total particle surface. In each step, a process first calculates the new spin values of its particles, and then exchanges the boundary particles with two other processes. The second application is a parallel implementation of the raytracer POVRAY 2.2 [22]. Povray is programmed using a master-slave model. The slaves receive from the master a certain number of pixels of the image, then compute the color of each pixel, and return the results to the master. The master distributes the pixels and saves the results on disk. The experiments were performed on two machines running SunOS 4.1.3, a SPARCstation ELC and a SPARCstation IPC, and on a third machine running Solaris 2.5, an UltraSPARC 1. Faults were injected on the process executing on the SPARCstation ELC, which left two processes, one on the SunOS machine and another on the Solaris machine, to detect the faults. The master process of the povray application always ran on the SPARCstation ELC, which means that fault detection was done by the slaves. The network and machines were lightly loaded when the experiments were done.
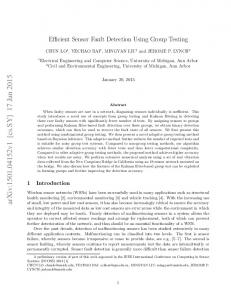
6.2 Coverage and Latency The fault detection latencies collected in the experiments are shown in Figures 7 and 8. The values displayed correspond to the latencies observed by the first process that discovered the fault. In most cases, faults were detected by the Solaris machine since it is faster than the
KILL
200
REBOOT
6.0
180 5.5
140
Fault Detection [s]
Fault Detection [ms]
160 120 100 80 60 40
5.0 4.5 4.0
20 3.5
0 0
10
20
30
40
0
50
10
CRASH & BOOT
130
30
40
50
CRASH
520
125
510
120
Fault Detection [s]
Fault Detection [s]
20
Experiment
Experiment
115 110 105 100
500 490 480 470 460
95 90
450 0
10
20
30
40
50
0
10
20
30
40
50
Experiment
Experiment
Figure 7: Fault injection on the ising application. SunOS machine. From the total number of faults that were injected, only three of them were undetected, all in the povray application. The detection latencies ranged from a few milliseconds for the kill faults to 511 seconds for the crash faults. As was explained in Section 5.1, kill faults can be located rapidly because surviving machines are informed about the failure. Typically, they are detected as soon as the surviving processes had to exchange data with the failed one. On the ising application, the Solaris process sent its particles 15 ms after the beginning of the step, and then it waited on a receive. The SunOS process, which is slower, exchanged particles every 150 to 330 ms (computation time is smaller when the spins start to converge). On the povray application, slaves communicated with the master every 850 ms to 4.1 s in Solaris, and 11.5 s to 35 s in SunOS (certain parts of the image require more computation than others). Faults were detected with random latencies because they were injected at random times. However, the maximum latency was limited by the largest period without communication. The observed minimum and maximum latencies for ising were 2 and 195 ms, and for povray were 9 and 2443 ms. In both applications, the error reported most frequently was read returned 0 bytes. Other returned errors were connection reset by peer with 6 cases
for ising, and 2 cases for povray; and signal broken pipe with 2 cases for povray. In the initial part of the reboot procedure, the operating system syncs the file systems and then closes all TCP connections. Reboot faults were discovered with a latency of 3.7 to 3.8 s, in most cases, for both applications. However, in a few other cases, fault detection took longer since the connections were closed later because of loaded file servers. The machine where faults were injected had several remote file systems that were mounted locally. Therefore, during the sync operation, it had to exchange many messages with a number of servers, so that all information that was cached in memory (e.g., modified superblocks) could be written to the remote disks. The error used to detect all faults was read returned 0. Crash & boot failures can only be detected if the surviving processes attempt to send messages to the failed machine. However, the detection can not be done immediately after the crash because, during the initial part of the booting procedure, the crashed machine does not respond to the arriving messages. Messages have to be re-transmitted several times before the RST is returned. Consequently, faults are detected at discrete points of time, only at the end of the re-transmissions. Re-transmissions were usually done after the following intervals (in seconds): Solaris = 0.18,
KILL
2500
REBOOT
5.5 5.3 5.1 Fault Detection [s]
Fault Detection [ms]
2000 1500 1000
4.9 4.7 4.5 4.3 4.1 3.9
500
3.7 3.5
0 0
10
20
30
40
0
50
10
CRASH & BOOT
99
20
30
40
50
Experiment
Experiment
CRASH
494 493
97 Fault Detection [s]
Fault Detection [s]
492 95 93 91 89
491 490 489 488 487
87
486
85
485 0
10
20
30
40
50
0
10
20
30
40
50
Experiment
Experiment
Figure 8: Fault injection on the povray application. 0.38, 0.75, 1.5, 3, 6, 12, 24, 48, 56.25, 56.25, ...; SunOS = 0.5, 2, 4, 8, 16, 32, 64, 64, ... The detection latencies for ising can be divided into 3 clusters, one below 95 s, another around 96.5 s, and the last one at 127.5 s. The faults corresponding to the second cluster were located by the Solaris process (0.18 + 0.38 + ... + 48 = 95.81), and the faults belonging to the third cluster were found by the SunOS process (0.5 + 2 + ... + 64 = 126.5). The faults from the first cluster were also detected by the SunOS process. The SunOS machine sometimes used a different set of retransmission intervals that resulted in an earlier detection (1.25 + 3 + 6 + 12 + 24 + 48 = 94.25). On povray, the majority of faults were located by the Solaris process roughly 96.5 s after fault injection. A few other faults were found before 95 s by the SunOS process. As was mentioned previously, the SunOS process had computation intervals as large as 35 s. Therefore, it could send a message to the failed process several seconds after the crash, resulting in re-transmissions in the period between the time when the crashed machine started to respond to incoming messages and the 96.5 s. The error reported for all faults was connection reset by peer. Crash faults are detected when the surviving machines quit re-transmitting messages. The usual time out intervals for Solaris and SunOS machines are 490 s and 511 s,
respectively. On the ising application, three faults were found by the SunOS process at roughly 511 s, and the rest were discovered by the Solaris process. Most of the faults located by the Solaris process had a latency of 490.5 s; however, a few others were detected with latency somewhat smaller or larger. By looking at the re-transmission times of the Solaris machine, we derived the following formula for the re-transmission intervals: I n+1 = min(In 2 56:25). The usual value observed for I0 was 0.18, which gives 490 s for the time out. However, sometimes Solaris used a distinct I0 , or one of the first Ik was larger than expected because of a delay. These small differences in the intervals explain the detection latencies that are smaller or larger than 490 s (e.g., I0 = 0.20 results in a time out of 501 s). On the povray application, all faults were detected by the Solaris process at approximately 490.5 s. The error reported for all faults was connection reset by peer.
7
Conclusions and Future Work
This paper examines the effectiveness of a fault detection mechanism based on the errors from the stream sockets. First, it was explained in which circumstances the error codes can be used to locate process failures. It was shown that all faults under study could be detected, as long as the surviving processes tried to communicate with the failed
one. Second, it was shown that process failures during the execution of parallel applications could be effectively detected using the errors from the stream sockets. The paper studies two implementations of the stream sockets with the TCP/IP protocols, SunOS 4.1.3 and Solaris 2.5. In the future we would like to test the fault detection mechanism with other implementations (e.g., nonUNIX platforms). We expect results similar to SunOS for all implementations based on the Berkeley sources (e.g. AIX). For the other implementations, we expect most conclusions from Section 5.5 to be applicable, since the implementations are based in the same specification.
References [1] K. P. Birman and B. B. Glade, “Consistent failure reporting in reliable communications systems”, Tech. Rep. CS TR 93-1349, Dept. of Computer Science, Cornell University, May 1993. [2] F. Jahanian, R. Rajkumar, and S. Fakhouri, “Processor group membership protocols: Specification, design and implementation”, in Proc. of the 13th Symposium on Reliable Distributed Systems, October 1993, pp. 2– 11. [3] L. Rodrigues, P. Verissimo, and J. Rufino, “A low-level processor group membership protocol for LANs”, in Proc. of the 13th International Conference on Distributed Computing Systems, May 1993, pp. 541–550. [4] A. M. Ricciardi and K. P. Birman, “Using groups to implement failure detection in asynchronous environments”, in Proc. of the 10th Annual ACM Symposium on Principles of Distributed Systems, August 1991, pp. 341–351. [5] K. H. Kim, H. Kopetz, K. Mori, E. H. Shokri, and G. Gruensteidl, “An efficient decentralized approach to process-group membership maintenance in real-time LAN systems: The PRHB/ED scheme”, in Proc. of the 11th Symposium on Reliable Distributed Systems, October 1992, pp. 74–83. [6] Y. Amir, D. Dolev, S. Kramer, and D. Malki, “Transis: A communication sub-system for high availability”, in Proc. of the 22nd International Symposium on FaultTolerant Computing, July 1992, pp. 76–84. [7] A. Mishra, L. L. Peterson, and R. D. Schlichting, “Consul: A communication substrate for fault-tolerant distributed programs”, Distributed Systems Engineering Journal, vol. 1, no. 2, pp. 87–103, 1993. [8] F. Cristian, “Reaching agreement on processor group membership in synchronous distributed systems”, Distributed Computing, vol. 4, pp. 175–187, 1991. [9] S. H. Hosseini, J. G. Kuhl, and S. M. Reddy, “A diagnosis algorithm for distributed computing systems
with dynamic failure and repair”, IEEE Transactions on Computers, vol. C-33, no. 3, pp. 223–233, 1984. [10] R. Bianchini, K. Goodwin, and D. S. Nydick, “Practical application and implementation of distributed system-level diagnosis theory”, in Proc. of the 20th International Symposium on Fault-Tolerant Computing, June 1990, pp. 332–339. [11] R. Bianchini and R. Buskens, “An adaptive distributed system-level diagnosis algorithm and its implementation”, in Proc. of the 21st International Symposium on Fault-Tolerant Computing, June 1991, pp. 222–229. [12] R. Bianchini, M. Stahl, and R. Buskens, “The Adapt2 on-line diagnosis algorithm for general topology networks”, in Proc. of GLOBECOM, December 1992, pp. 610–614. [13] S. Rangarajan, A. T. Dahbura, and E. A. Ziegler, “A distributed system-level diagnosis algorithm for arbitrary network topologies”, IEEE Transactions on Computers, vol. 44, no. 2, pp. 312–334, 1995. [14] E. P. Duarte and T. Nanya, “Hierarchical adaptive distributed system-level diagnosis applied for SNMPbased network fault management”, in Proc. of the 15th Symposium on Reliable Distributed Systems, October 1996, pp. 98–107. [15] M. A. Hiltunen, “Membership and system diagnosis”, in Proc. of the 14th Symposium on Reliable Distributed Systems, September 1995, pp. 208–217. [16] F. P. Preparata, G. Metze, and R. T. Chien, “On the connection assignment problem on diagnosable systems”, IEEE Transactions on Electronic Computing, vol. EC-16, no. 12, pp. 848–854, 1967. [17] P. Koopman, J. Sung, C. Dingman, D. Siewiorek, and T. Marz, “Comparing operating systems using robustness benchmarks”, in Proc. of the 16th Symposium on Reliable Distributed Systems, October 1997. [18] W. R. Stevens, Unix Network Programming, Prentice Hall Software Series, 1990. [19] J. Poster (ed.), “Transmission control protocol”, RFC 793, September 1981. [20] W. R. Stevens, TCP/IP Illustrated, Volume 1: The Protocols, Addison-Wesley, 1994. [21] J. G. Silva, J. Carreira, H. Madeira, D. Costa, and F. Moreira, “Experimental assessment of parallel systems”, in Proc. of the 26th International Symposium on Fault-Tolerant Computing, June 1996, pp. 415–424. [22] POV-Ray Team, Persistency of vision ray tracer (POV-Ray): User's Documentation, 1993, http://povray.org.