suspension and the inductance vary with the displacement of the voice coil generating a nonlinear system represented by a nonlinear differential equation.
2009 5th International Colloquium on Signal Processing & Its Applications (CSPA)
Loudspeaker Fault Detection Using Artificial Neural Network Paulraj M P,
Sazali Yaacob,
Mohamad Radzi Saad
School of Mechatronic Engineering, Universiti Malaysia Perlis (UniMAP), Perlis, Malaysia. added to the original signal. Total Harmonic Distortion (THD) is the form of nonlinearity that causes unwanted signals to be added to the input signal that are harmonically related to it. The spectrum of the output shows added frequency components at 2X, 3X, 4X, 5X, and so on to the original signal. Total harmonic distortion is then defined as the ratio of summation of the level of each harmonic then divided by the fundamental level [3]. Lesser THD allows the components in a loudspeaker, amplifier, microphone or other equipment to make a violin sound like a violin when played back, and not a cello or simply a distorted noise. In most cases, the transfer function of a system is linear and time-invariant. When a signal passes through a non-linear device, additional content is added at the harmonics of the original frequencies. THD is a measurement of the extent of that distortion. The measurement is most commonly the ratio of the fundamental frequency to the power of the fundamental.
Abstract- Traditionally, loudspeaker’s quality control has been done manually and inspection of loudspeaker faults is time consuming and causes error in the quality evaluation. In order to reduce the time consumption and errors in the quality evaluation, in this research work, a simple loudspeaker diagnosing system is developed based on the harmonic distortion. The faulty and normal loudspeakers are tested using the sound emanated from the loudspeaker in the frequency range between 20 Hz and 20,000 Hz. A Fast Fourier Transform (FFT) is applied on the recorded signal to transform from time domain to frequency domain and the frequency spectrum is obtained. From the frequency spectrum, the total energy in the first 6 frequency bands are computed and chosen for further analysis. These frequency band energy signals obtained are then used as features for training the neural network. A simple neural network model is developed for the automatic detection of loudspeaker faults. From the result it is observed that the proposed method is able to classify the faults with an accuracy level of 82%. Keywords- Loudspeaker, Harmonic Transform, Neural Network
Distortion,
Fast
Fourier
(1)
I. INTRODUCTION In any sound system, ultimate quality of music depends on the performance of the loudspeakers. The best recording, encoded on the most advanced storage device and played by a top-of-the-line deck and amplifier, will sound awful if the system is hooked up to poor loudspeakers performance. A loudspeaker is the component that takes the electronic signal stored on storage equipments like CDs, tapes and DVD’s and turns it back into actual sound that we can hear. It takes the electrical signal and translates it back into physical vibrations to create sound waves. When everything is working as it should be, speaker produces nearly the same vibrations that the microphone originally recorded and encoded on a tape, CD, DVD, etc. [1]. Distortion in its several forms is undoubtedly the most serious problem with which the engineer has to deal in the design of a satisfactory highfidelity sound-reproducing system. An early appreciation of the importance of minimizing distortion in such a system was obtained in development work on high-fidelity radio receivers. During the development of this receiver, consideration was given to the part which the loudspeaker might contribute to the over-all distortion in a sound-reproducing system [2]. Distortion is anything that alters a pure input signal in any way other than changing its magnitude. The most common forms of distortion are unwanted components or artifacts that
978-1-4244-4152-5/09/$25.00 ©2009 IEEE
For the other definitions, some defined THD as an amplitude ratio rather than a power ratio. This results in a definition of THD which is the square root of that given above. For example in terms of voltages the definition would be: (2) This latter definition is used in audio distortion (percentage THD) specifications. It is unfortunate that these two conflicting definitions of THD (one as a power ratio and the other as an amplitude ratio) are both in common usage. Fortunately if the THD is expressed in dB then both definitions are equivalent. This is not the case if the THD is expressed as a percentage. (3) The THD is usually expressed in percent as distortion factor or in dB as distortion attenuation [4]. In woofer systems, for example, the force factor, the stiffness of the mechanical suspension and the inductance vary with the displacement of the voice coil generating a nonlinear system represented by a nonlinear differential equation. The solution comprises the
363
2009 5th International Colloquium on Signal Processing & Its Applications (CSPA)
linear and higher-order system functions which describe the nonlinear transfer behavior of loudspeaker [5]. The identified model of the loudspeaker allows numerical simulation of the transfer behavior of the loudspeaker. Whereas the linear simulation is restricted to the prediction of the linear frequency response at small amplitudes the nonlinear simulation allows to optimize the loudspeaker in respect to maximal output power, distortion, weight, volume and cost [6]. Modeling, in the sense of mapping the resulting enormous amount of measured data can be realized very efficiently using Neural Network [7]. The purpose to use Neural Network is for justification and decision making because of an advantage of its fast computation time and convergence rate is good. In industry, the distortion detection is a difficult problem where manufacturer need to filter out any fault before selling the product to the customer. In manufacturing line, all produced loudspeakers should go through all inspection process where faulty loudspeaker will put aside for defect analysis for real causes of that defect. These inspections are objective but do not provide a complete description of the fault present in the loudspeaker. In this work, based on harmonic distortion, three main fault issues in loudspeaker manufacturing such as Distortion, Resonant Frequency (f0) inconsistence and Sound Pressure Level (SPL) inconsistent are analyzed. A simple neural network model is developed to identify the three types of faults.
Loudspeaker
Sony Recorder
Wooden baffle
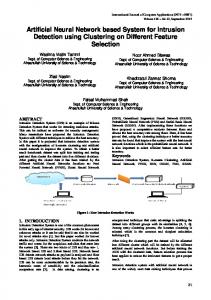
Fig. 2. Details experimental set-up TABLE 1 TEST SPECIMEN TYPE AND QUANTITIES
Normal loudspeakers Faulty loudspeakers with voice coil misalignment and damper (spider) stiffness problem ( “A” defect) Faulty loudspeakers with voice coil misalignment and cone paper (diaphragm) surround stiffness problem ( “B” defect) Faulty loudspeakers with damper stiffness problem and cone paper stiffness problem ( “C” defect) Faulty loudspeakers with voice coil misalignment, damper stiffness problem and cone paper stiffness problem ( “D” defect)
II. EXPERIMENTAL SET-UP AND METHODOLOGY Loudspeaker testing is conducted in a soundproof anechoic room. Loudspeaker is fixed on a wooden baffle and then fixed to a wooden box. White noise signal of two volts (equivalent to one watt) is generated using a noise generator. This white noise signal is then applied to the loudspeaker’s terminal. The noise emanated from the loudspeaker is measured using a Sony recorder which is kept at a distance of one meter from the center of the loudspeaker as shown in Figure 1 and Figure 2 display a more detail setup of the facilities for data measurement. In this experiment, 22 pieces of normal loudspeaker and 58 pieces of faulty loudspeaker are considered. The list of number of normal loudspeakers and the number of faulty loudspeakers with its fault condition are tabulated in Table I.
22 pieces 15 pieces 14 pieces 14 pieces 15 pieces
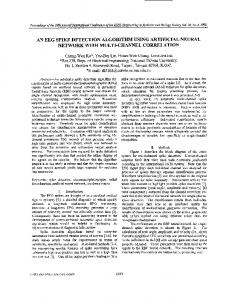
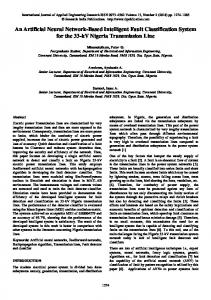
Fig. 3. Introduction of loudspeaker’s part
Figure 3 shows the schematic representation of a loudspeaker and the probable locations where a fault can occur. Feature extraction: The noise emanated from a loudspeaker is recorded for a period of 15 seconds. The recorded analog signal is then converted into a digital signal with a sampling frequency of 16000 Hz. After digitizing the signal, the signals at the middle
Wooden box Fig. 1. Experimental set-up
978-1-4244-4152-5/09/$25.00 ©2009 IEEE
364
2009 5th International Colloquium on Signal Processing & Its Applications (CSPA)
nine seconds are extracted and used for the analysis. For the extracted digital signal, Fast Fourier Transform (FFT) is applied. From the absolute value of the transformed signals, the energy levels at the six difference critical band frequencies are extracted. The six critical band frequencies chosen for the analysis are 20-100 Hz (Frequency Band 1), 100-1000 Hz (Frequency Band 2), 1000-2000 Hz (Frequency Band 3), 2000-3000 Hz, 3000-4000 Hz (Frequency Band 4) and 40005000 Hz (Frequency Band 5). The frequency response variation of the output signal together with its average FFT at various frequency bands for the loudspeakers with different faults are shown in Figure 4-8 and Table 2-6. From the figures it can be observed that for different kind of faults there are certain signature display on the respective FFT.
TABLE 3 AVERAGE FFT OF LOUDSPEAKERS WITH VOICE COIL MISALIGN AND CONE PAPER STIFFNESS PROBLEM VOICE COIL MISALIGN&CONE PAPER STIFFNESS PROBLEM
Distortion
6.0000 4.0000 2.0000 0.0000 "B" DEFECT
1
2
3
4
5
6
0.0018
5.6676
2.9299
1.5859
3.1105
0.9846
Frequency Band "B" DEFECT
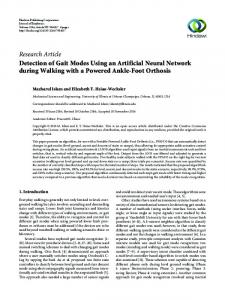
Fig. 6. Frequency response of loudspeakers with Damper stiffness and Cone paper stiffness problem TABLE 4 AVERAGE FFT OF LOUDSPEAKERS WITH DAMPER STIFFNESS AND CONE PAPER STIFFNESS PROBLEM
Fig. 4. Frequency response of loudspeakers with Voice coil misalign and Damper stiffness problem TABLE 2 AVERAGE FFT OF LOUDSPEAKERS WITH VOICE COIL MISALIGN AND DAMPER STIFFNESS PROBLEM
DAMPER STIFFNESS & CONE PAPER STIFFNESS PROBLEM
Distortion
6.0000
VOICE COIL MISALIGN & DAMPER STIFFNESS PROBLEM
Distortion
6.0000
4.0000 2.0000 0.0000
4.0000 "C" DEFECT 2.0000 0.0000 "A" DEFECT
1
2
3
4
5
6
0.0015
5.6245
3.6915
1.8198
3.1990
0.9662
Frequency Band 1
2
3
4
5
6
0.0015
5.2981
2.7648
1.5178
2.9115
0.9491
"C" DEFECT
Frequency Band "A" DEFECT
Fig. 7. Frequency response of loudspeakers with Voice coil misalign, Damper stiffness and Cone paper stiffness problem Fig. 5. Frequency response of loudspeakers with Voice coil misalign and Cone paper stiffness problem
978-1-4244-4152-5/09/$25.00 ©2009 IEEE
365
2009 5th International Colloquium on Signal Processing & Its Applications (CSPA)
TABLE 5 AVERAGE FFT OF LOUDSPEAKERS WITH VOICE COIL MISALIGN, DAMPER STIFFNESS AND CONE PAPER STIFFNESS PROBLEM
with the nature of faults are observed. The six critical band energies and the associated faults are used as a training vector pair and used to model the neural network.
VOICE COIL MISALIGN,DAMPER STIFFNESS & CONE PAPER STIFFNESS PROBLEM
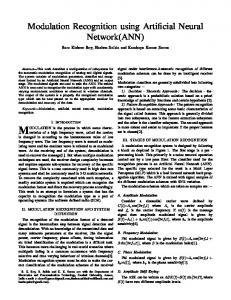
Neural Network Architecture Artificial Neural Network (ANN) provides alternative form of computing that attempts to mimic the functionality of the brain [8]. In this work, MATLAB 7.6.0 dynamic network that is the Layer-Recurrent Network (LRN) is chosen to identify the loudspeaker faults. In the LRN, there is a feedback loop, with a single delay, around each layer of the network except for the last layer. The “newlrn” command generalizes the Elman network to have an arbitrary number of layers and to have arbitrary transfer functions in each layer. The toolbox trains the LRN using exact versions of the gradient-based algorithms. A typical two layer LRN is depicted in Figure 9.
Distortion
10.0000 5.0000 0.0000 "D" DEFECT
1
2
3
4
5
6
0.0023
6.1472
3.9891
2.2301
3.6628
1.2589
Frequency Band "D" DEFECT
Fig. 8. Frequency response of normal loudspeakers TABLE 6 AVERAGE FFT OF NORMAL LOUDSPEAKERS
Fig. 9. Layer-Recurrent Network (LRN)
NORMAL SPEAKER
Distortion
6.0000
The neural network architecture has two layers, consisting of one input layer 2 hidden layers and one output layer. Neural network model has six input neurons representing six critical band energy levels and five output neurons. The hidden neurons and output neurons have a bias value of 1.0 and are activated by Hyperbolic tangent sigmoid transfer function. 48 samples are randomly chosen from the database which are used for training, 16 samples are used for testing while 16 samples are used for validation. The initial weights are randomized between -0.5 and 0.5. The performance goal is fixed as 0.075 and the testing tolerance is fixed as 0.1. The training results are shown in Table 8 and Table 9.
4.0000 2.0000 0.0000 GOOD SPEAKER
1
2
3
4
5
6
0.0014
5.2398
2.8747
1.4853
2.9013
0.9610
Frequency Band GOOD SPEAKER
TABLE 7 AVERAGE FFT OF VARIOUS TYPE OF LOUDSPEAKER FAULTS DISTORTION LEVEL FOR VARIOUS TYPE OF SPEAKER FAULTS
Distortion
8.0000 6.0000
III. RESULT AND DISCUSSION
4.0000
From Table 8, it is observed that the maximum classification rate is 89% and the minimum classification rate is 78%. The mean classification rate lies between 80.8% and 83.6%. From Table 9, it can be observed that the minimum number of epoch for training is 14 and maximum number of epoch for training is 175. The mean epoch for training the neural network lies between 25 and 69.
2.0000 0.0000
1
2
3
4
5
6
GOOD
0.0014
5.2398
2.8747
1.4853
2.9013
0.9610
"A" DEFECT
0.0015
5.2981
2.7648
1.5178
2.9115
0.9491
"B" DEFECT
0.0018
5.6676
2.9299
1.5859
3.1105
0.9846
"C" DEFECT
0.0015
5.6245
3.6915
1.8198
3.1990
0.9662
"D" DEFECT
0.0023
6.1472
3.9891
2.2301
3.6628
1.2589
Frequency Band GOOD
"A" DEFECT
"B" DEFECT
"C" DEFECT
"D" DEFECT
The experiment is performed on the above 80 different loudspeakers, each time the six critical band energies along
978-1-4244-4152-5/09/$25.00 ©2009 IEEE
366
2009 5th International Colloquium on Signal Processing & Its Applications (CSPA)
TABLE 8 NEURAL NETWORK TRAINING RESULTS-CLASSIFICATION RATE (CR)
REFERENCES [1]
No. of input neurons: 6 No. of output neuron: 5 No. of hidden layers : 2 No. of Hidden Neurons (1st layer) : 15 No. of Hidden Neurons (2nd layer) : 20 Activation Function : Hyperbolic tangent sigmoid transfer No. of training epochs: 300 Performance goal: 0.075 Testing tolerance: 0.1 No. of samples used for training: 48 (60%) No. of samples used for testing: 16 (20%) No. of samples used for validation: 16 (20%) Trial Min. CR Max. CR Mean. CR 1 81 89 82.9 2 80 86 83.6 3 78 85 80.8 4 80 88 82.4 5 81 88 83.2
[2] [3] [4] [5]
[6] [7] [8]
TABLE 9
NEURAL NETWORK TRAINING RESULTS – NUMBER OF EPOCH No. of input neurons: 6 No. of output neuron: 5 No. of hidden layers : 2 No. of Hidden Neurons (1st layer) : 15 No. of Hidden Neurons (2nd layer) : 20 Activation Function: Hyperbolic tangent sigmoid transfer No. of training epochs: 300 Performance goal: 0.075 Testing tolerance: 0.1 No. of samples used for training: 48 (60%) No. of samples used for testing: 16 (20%) No. of samples used for validation: 16 (20%) Trial No. 1 2 3 4 5
Min. Epoch 17 14 23 19 14 IV.
Max. Epoch 150 60 73 175 72
Mean Epoch 58 25 43 69 30
CONCLUSION
This paper discuss the loudspeaker fault detection techniques based on the features extraction obtained from the critical band energies. A simple neural network model is developed for identifying the faults present in the loudspeaker. The simulation results show that the proposed features and the neural network concept can be used as tool to identify the loudspeaker faults. Due to the limitation of testing data, the neural network is not able to give an efficiency of more than 90%. More data will be collected and new networks and training algorithms together with different feature extractions are going to be considered to improve on the classification rate on determining the faults of the loudspeaker.
978-1-4244-4152-5/09/$25.00 ©2009 IEEE
367
Patricia Melin, Oscar Castillo, “An intelligent hybrid approach for industrial quality control combining Neural Networks, Fuzzy logic and fractal theory”, Information Sciences, pp. 1543-1557. 2006. G. L. Beers, AH. Belar, “Frequency–Modulation Distortion in Loudspeakers”, Proceeding of the I.R.E, pp. 132-138, 1943. Dennis Bohn “Audio Specifications”, Rane Corporation 2000 . Wikipedia “Total Harmonic Distortion” Ken Yamamoto, Kajiro Watanabe, and Kazuyuki Kobayashi, “Development of New Loudspeaker Systems with Functions of Automatic Sound Adjustment”, SICE Annual Conference, pp. 33653368, 2003. Vladimir E. Filevski, August, “A Novel Design of Two-Way Multimedia Loudspeaker”, IEEE Transaction on Consumer Electronics, Vol. 50, No. 3, pp. 787-791. 2004. Eva Wilk, Jan Wilk, “Optimized Neural Networks for Modeling of loudspeaker directivity diagrams”, IEEE International Conference on Acoustics, Speech and Signal processing, pp. 12851288. 2001. S.N. Sivanandam, M. Paulraj. “An Introduction to Neural Networks”, Vikhas Publications Company Ltd. India, 2003”