Feature Selection and Fault Classification of Reciprocating Compressors using a Genetic Algorithm and a Probabilistic Neural Network M. Ahmed, F. Gu, A. Ball Diagnostic Engineering Research Group, University of Huddersfield, HD1 3DH, UK E-mail:
[email protected] Abstract. Reciprocating compressors are widely used in industry for various purposes and faults occurring in them can degrade their performance, consume additional energy and even cause severe damage to the machine. Vibration monitoring techniques are often used for early fault detection and diagnosis, but it is difficult to prescribe a given set of effective diagnostic features because of the wide variety of operating conditions and the complexity of the vibration signals which originate from the many different vibrating and impact sources. This paper studies the use of genetic algorithms (GAs) and neural networks (NNs) to select effective diagnostic features for the fault diagnosis of a reciprocating compressor. A large number of common features are calculated from the time and frequency domains and envelope analysis. Applying GAs and NNs to these features found that envelope analysis has the most potential for differentiating three common faults: valve leakage, inter-cooler leakage and a loose drive belt. Simultaneously, the spread parameter of the probabilistic NN was also optimised. The selected subsets of features were examined based on vibration source characteristics. The approach developed and the trained NN are confirmed as possessing general characteristics for fault detection and diagnosis.
Keywords: Condition Monitoring, Reciprocating Compressor, Artificial Neural Networks, Genetic algorithms and features extraction.
1. Introduction Reciprocating compressors are widely used in the petroleum and petrochemical industry because they can provide a high pressure, applicable for various kinds of gases and inter-stage cooling. Due to the complex structure and the often poor operating conditions of these compressors, failures often occur which can have severe consequences. To find a technique which can accurately monitor and diagnosis the condition of the compressor is becoming increasingly important to avoid system and machine failure, and so improve general reliability and uptime. Although the vibration signal of a reciprocating compressor in a single service cycle contains nonlinear characteristics (e.g. due to the impacts resulting from the movement of the suction and discharge valves) features extracted from the time, frequency and envelope domains of the sensor signals can be
used to reliably assess the health of the system. However, not all the features that can be extracted are useful in the trouble-shooting process, experience has shown that some are simply inappropriate. Usually not even the chosen features are used in the most effective way with some considered separately, and the interactions between and among features not fully considered or even ignored [1]. In cases when the features employed are synergetic, the accuracy of diagnosis might be undermined. In this paper Artificial neural networks (ANNs) and GAs have been applied to real systems with emphasis on considering the features extracted from the vibration signal in combination. ANNs have potential application in the automated detection and diagnosis of machine condition. The use of the probabilistic neural network (PNN) has increased recently because it provides sound statistical confidence levels for its decisions. The goal of the present paper is to demonstrate that a PNN can be trained using test data to determine the features for the classifiers. These features have been calculated from the data obtained from the time and frequency domains and envelope analysis and were used for classifying the health of a reciprocating compressor. However, there remains the need to build an accurate and fast classification process using the optimal features which best characterize the system conditions and thus allow optimization of the parameters of the ANNs with a minimum number of features. GAs have been used for automatic feature selection in machine condition monitoring (CM) [2]. Moreover, GAs can be used to simultaneously find optimal structure of a spread value of PNN, in terms of concurrently determining the number of nodes in the hidden layers and connection matrices for evolving the ANN [3]. Research into ANNs has successfully classified and diagnosed machine faults by many researchers. Samanta and Al-Balushi [2] applied neural networks to the diagnosis of rolling element bearing faults using time-domain features from vibration signals. They also used GAs to optimize the features vector for gear fault detection using experimental vibration data from a gearbox [4]. Orlowska-Kowalska [5] used a NN for induction motor fault diagnosis. Tiwari and Yadav [6] applied ANN in the CM of a defective reciprocating air compressor using simulated data. Yang et al [7] presented classifiers including the self-organizing feature map (SOFM), learning vector quantization (LVQ), and support vector machine (SVM) for fault features of a small reciprocating compressor. Yang et al., attempted to examine the performance of different multi-class SVM strategies on the diagnosis of faults in rotating machinery and compared the results with those obtained by ANNs [1]. Jack et al examined the use of a genetic algorithm (GA) to select the most significant input features from a large set of possible features in machine condition monitoring and shown that using a GA, a small subset of six allows more than 99% recognition accuracy, compared with an accuracy of 87.2% using an ANN without feature selection [8]. Worden et al. investigated GA in determining the parameters of Multi-Layer Perceptron (MLP) and selecting features for damage localisation in an aircraft wing [9], showing effectivness of GA in performance improvement. Yang Genetic Programming (GP) used to combine optimally for engine valve fault detection [10]. Results obtained are better compared with Principal Component Analysis (PCA). However, in these researches, more computational efficient NNs such as Probabilistic Neural Network (PNN) have not been explored and a combination of ANN and GA has been received little attention for CM. Therefore, this paper forces on the examination of using genetic algorithms (GAs) and PNN jointly to select effective diagnostic features and optimise PNN parameters for more accurate fault diagnosis of a reciprocating compressor in a more efficient way. 2. Vibration Datasets and Potential Features 2.1 Dataset Vibration datasets were collected from a two-stage, single-acting Broom Wade TS9 reciprocating compressor, which has two cylinders, designed to deliver compressed air between 0.55MPa and
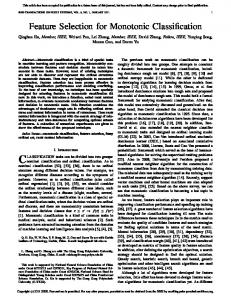
0.8MPa to a horizontal air receiver tank with a maximum working pressure of about 1.38MPa. As shown in Figure 1, the driving motor was a three phase, squirrel cage, air cooled, type KX-C184, 2.5kW induction motor. It was mounted on the top of the receiver and transfers its power to the compressor through a pulley belt system. The transmission ratio is 3.2, which results in a crank shaft speed of 440 rpm when the motor runs at its rated speed of 1420 rpm. The air in the first cylinder is compressed and passed to the higher pressure cylinder via an air cooled intercooler. For characterising vibrations of different faults, three common faults were separately seeded into the compressor: a leaky valve in the high pressure cylinder, a leaky intercooler and a loose drive belt, which are denoted as fault 1, fault 2 and fault 3respectively. These faults produce little noticeable influence on the performance of generating pressures but do need to use more electrical energy than that of a healthy compressor. Vibrations of the two-stage compressor were measured using two accelerometers mounted respectively on the low stage and high stage cylinder heads near the inlet and outlet valves. In addition, the pressures, temperatures and speed were also measured simultaneously for comparisons. The data were collected for a length of 30642 samples at different discharge pressures ranged from 0.2 to 1.2MPa in a step of 0.1MPa. As the sampling rate is 62.5kHz, the each segment of data includes more than three working cycles of the compressor. In total, 4x11=44 data records were collected for baseline, the valve leakage, intercooler leakage and the loosing belt respective to different discharge pressure.
Figure 1. Compressor test system.
2.2 Detection Features Many possible features can be extracted from vibration signals for fault detection and diagnosis. This study explores the features derived from the time and frequency, which are the most commonly used in CM. 2.2.1 Waveform Features The features extracted from raw vibration signals are the statistical measures including root mean square (RMS), peak factor, lower bound (LB), upper bound (UB), entropy, variance, skewness, kurtosis. Supposing that the signal is , these features are calculated by:
(1) where is a element of x; number of sample points.
is the mean value which is calculate by
and N is the
(2) (3) (4) (5) Where
is the probability density of signal x. (6)
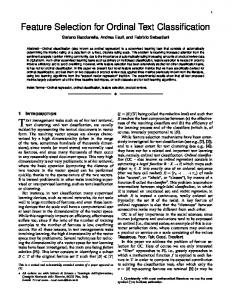
Where: (7) (8) (9) 2.2.2 Spectral Features The Fast Fourier Transform (FFT) was used to transform the vibration signal into the frequency domain from which the spectral features were obtained. Rather than using the spectrum from the raw data, an envelope spectrum is based for feature selection. As shown in Figure 2 envelope spectra for different cases exhibit clearly a number of discrete components mainly from compressor working frequency 7.6Hz and its harmonics, up to 80 orders, in contrast, the spectrum from raw data show continuous spectral features which is more difficult to select a small number of feature components. Nevertheless, it can be seen in the envelope spectra that the amplitudes vary slightly but significantly between the different cases of faults. However, it is still not so easy to find a simple set of features to separate the fault cases completely. Thus the amplitudes of these components were all taken as candidate features and different harmonics were used for each trial run. Thus, the resultant feature dataset is a (n × s) matrix (n is the number of harmonics and s number of samples).
110psi 0.25 H_12_08 F1mm_12_08 F_Belt_12_08 Fintercooler_12_08
Amplitude(mv)
0.2
0.15
0.1
0.05
0
0
50
100
150 Frequency(Hz)
200
250
300
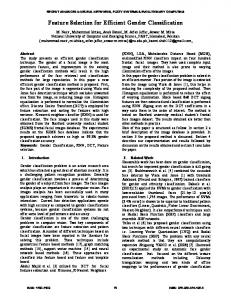
Figure 2. Envelope spectra of compressor vibration for healthy case and three seeded faults. 3. Probabilistic Neural Network The PNN is a type of supervised neural network. It was introduced by Specht in 1989 and mainly used for classification based on of Bayes optimal decision rule [11]. (10) where and are the probability density functions for data classes and ; and are the prior probabilities; and are misclassification data classes. It means that a vector is classified into class i if the product of all the three terms is greater for data class i than for any other data class j not equal to i. In most applications, the prior probabilities and costs of misclassifications are treated as being equal and the density functions are concerned. In implementing with neural network architecture, a PNN consists of an input layer, a pattern layer, a summation layer and a competitive output layer. This architecture is illustrated in Figure 3. In recent years, PNN has been widely used in different fields such as pattern recognition and signal processing and has been recognized as a useful technique for high dimensional classification problems. In addition it also is used in CM for differentiating different faults and degrees of fault severity [12]. The PNN is considered much faster than other algorithms such as a Multi-Layer Perceptron (MLP) neural network used in [13] during the training process, which is simply to select a kernel function and its smooth parameter in solving a linear equation set. There is no need for weight adaptation and more suitable for GA based process which needs a great number of network training and evaluation. 3.1 Pattern Layer For each training cycle there is one pattern node. For classification the pattern node produces a product of the input pattern vector x with a weight vector , and performs a non-linear operation on before outputting its activation level to the summation node. The non-linear operation used , where both and are normalized.
3.2 Summation Layer The summation layer receives the outputs from the pattern layer related to a given class. It sums the inputs from the pattern layer that matched that class from which the training pattern was selected. (11) 3.3 Output Layer The output nodes have two input neurons. These units produce binary outputs, associated with two different categories using the classification principle: (
(
(12)
The outputs have only a single weight , given by the loss parameters, the prior probabilities and the number of training patterns in each category. Accordingly, the weight is the ratio of priori probabilities, divided by the ratio of samples, and multiplied by the ratio of losses. There were developed using non-parametric techniques for estimating multivariate or univariate probability density functions from random samples. The th pattern neuron in the th group computes its output using a Gaussian Kernel of the form: (13) Where is the centre of the kernel, and is a spread parameter which determines the size of the kernel. The summation layer of the network computes the approximation of the conditional class probability function through a combination of the previously computed densities as follows: (14) Where
is the number of pattern neurons of class k, and are positive coefficients satisfying, pattern vector belongs to the class that corresponds to the summation unit with maximum output.
Figure 3. Architecture of a PNN classifier.
4. Genetic Algorithm for Classification A Genetic Algorithm (GA) is a search technique used in computing to find a solution in optimization problems [14]. It applies the principles of evolution found in nature to the problem of finding an optimal solution. In a "genetic algorithm”, the problem is usually encoded in a series of bit strings that are manipulated by the algorithm. Based on the process of GA optimisation, a feature selection scheme for fault classification can be conducted based on a process shown in Figure 4 which is further outlined in 5 key GA operation steps. Start
Encoding of feature into binary bits Initial population of size 100 Mutation Population evaluation using PNN
If fitness or Generation> max.
Crossover Selection of better feature set Generation+1
End
Figure 4 Feature selection scheme for fault classification
4.1 The Creation of an Initial Population The initial generation was generated with randomly selected features, each of which has a numerical value. The maximum number is determined by the size of the feature space available. When computation starts, the number is put into binary form more easily allow the generation of a new population of the parameters and performing GA operations.
4.2 Fitness Evaluation At this step in the development of the NN model, and calculation of the classification error in the objective function, the binary form is translated back to decimal numbers.The objective function is defined as:
Err
N max
(t i 1
i
t i )2
(15)
where t i is the predicted class by PNN and t i is the labelled class. N max is the size of the dataset. The program terminates when Err equals to or less than the set minimal level or when it becomes equal to the maximum generation number ( Ngen ) set in the computational code developed for the study. 4.3
Selection Operation
This is the operation whereby the process is guided towards ever-better solutions by the GA. Different algorithms can be used to select the best individual values from the estimated population, such as: Roulette wheel selection, Tournament selection, Remainder selection and Uniform selection. Tournament selection has been used in this experiment as it is efficient and easy to implement. 4.4
Crossover Operation
This stage produces the next generation by using a simulated mating process. This is performed by two parents creating offspring which consist of genetic material from both parents. This operation combines features of existing solutions in an attempt to create a better solution. For example, elements of existing solutions can be combined in a crossover operation as shown: Parent 1 0
0
0
1
Child 0
1
0
0
0 0
0
1
0
1
0
1
0
0
1
0
1
1
1
0
0
1
1
Parent 2 The probability of the crossover was assumed to be 0.80 in this experiment. 4.5 Mutation Operation Once the children are generated during crossover, the mutation operator is applied to each child. Each gene has a user-specified mutation probability of being mutated. In this experiment the initial probability of mutation was 0.01, this was sometimes increased and/or decreased randomly to fit. Again the location of mutation was randomly determined every time. 1
0
0
0
1
0
0
1
0
1
1
1
1
1
0
0
0
1
5. Implementation The proposed feature selection scheme is evaluated based on vibration dataset from the reciprocating compressor test rig in Section 2. A MATLAB program is developed to implement PNN and GA. The features from signal waveform, spectrum and envelope analysis for classification are investigated through the use of PNN, GA and their combination as following. The features were extracted from datasets for baseline condition to form a healthy feature vector and for the compressor operating with a specific fault to create a faulty features vector. The target vector was created the same size as the data vector. In the fitness function, both the data vector and target vector were divided into two subsets of equal size by taking every other vector values, of which one was for training the PNN and the other for testing the trained network. The spread parameter σ of the PNN was identified by trial and error method when GA is not used for feature selection. However, it has been optimised by GA automatically when GA feature selection is involved. GA has been used to select the optimal features that related to a particular classifier and simultaneously find the optimal spread value of PNN. GA chromosome for this feature selection is a binary chromosome, the length of which is based on the number of features available for selection and the range of spread parameter of PNN, typically the chromosome ranges from 10 to 20. Multipoint crossover is implemented with the locations of the crossover points determined randomly. The population is made to crossover after they were paired according to their fitness. After that the chromosomes are sorted in the order of decreasing fitness values. The fitness function is the minimum of error in classifying the four classes represented by values 1 for healthy, 2 for fault 1, 3 for fault 2 and 4 for fault 3. Mutation is a multipoint bit-flip mutation based on a pre-specified probability of 0.1. The location of mutation is randomly set in every mutation. Obviously in this approach, after a new generation of offspring was obtained, the fitness function of all parents and offspring was evaluated and the ones with the highest fitness were carried forward to the next generation. 6. Results and Discussions For comparison, four sets of PNNs have been studied to evaluate the effectiveness of different types of features and GA feature selection. The first one is the time domain feature based PNN; the second one is the frequency feature based PNN; the third one is the time domain feature based PNN with GA feature selection; and the fourth is the frequency feature based PNN with GA feature selection. 6.1 Performance of PNNs without Feature Selection Tables 1 and 2 show classification results based on time domain and frequency domain features respectively, which are obtained using PNNs directly without GA features selection. For each case of PNNs, the widths were kept constant at 0.01 and the total number of features was 9. There are 36 ways of selecting two features from the nine, and here Variance and Kurtosis gave the highest correct classification rate of 80.55%. Of the 84 ways of selecting three features from nine, the best results (93.05% correct classification) were obtained from RMS, Variance, and Kurtosis. Surprisingly the classification rate decreases when additional features were added until with all nine features included the classification rate was 83.33%. In Table 2 the input features are the harmonic peaks in the frequency spectrum. Obviously the more peaks that are included in the classification, the higher the success rate. However, the classification rate is only 95.5 even if the feature number is as high as 65. As shown in Figure 2, the signal to noise
ratio for amplitude of high order harmonics is very low and results in inconsistent feature selection results in different selection. Table 1. Performance of PNN classifier with different feature combinations from the time domain Total of combination 36 84 126 126 84
Number of input features 2 3 4 5 6
36
7
9
8
1
9
Features name
Correct rate
Variance, Kurtosis RMS, Variance, Kurtosis RMS, Peak factor, Variance, Kurtosis RMS, UB, Entropy, Variance, Kurtosis RMS, Peak factor, UB, Entropy, Variance, Kurtosis RMS, Peak factor, LB, UB, Entropy, Variance, Kurtosis RMS, Peak factor, LB, UB, Entropy, Variance, Kurtosis, Range RMS, Peak factor, LB, UB, Entropy, Variance, Skewness, Kurtosis, Range
80.55% 93.05% 91.66% 91.66% 91.66% 88.89% 88.89% 83.33%
Table 2. Performance of PNN classifier using features in the frequency domain. Number of input features in Correct rate the frequency domain 10 81.81% 20 87.88% 30 93.94% 48 95.45% 65 95.50% 6.2 Performance of GA-PNNs based on Features in the Time Domain Table 3 shows the classification results for PNN with feature selection using GA. In this case two, three, four and seven features were used with GA selection of the particular features used to obtain the best classification rate. Thus when it was determined that the number of features used should be two (n=2) the GA selected RMS and Variance as giving the best results. However, even when using up to seven features the best result using the GA remained the 69.44% obtained with RMS and Variance. Here the mutation rate was 0.001. Table 3. Performance of PNN classifier with GA time domain feature selection (mutation rate 0.001) Number of Population Selected Feature name Correct classification generations size features rate (%) 8 100 2 RMS, Variance 69.44 40 100 3 Kurtosis ,UB, LB 62.50 9 100 4 RMS, LB, Entropy, Kurtosis 63.89 9 100 7 Peak Factor, LB, UB, Entropy, 65.28 Skewness, Range'
6.3 Performance of GA-PNNs with Features from the Frequency Domain In this section, classification results are presented for PNN with features selection using GA. For this case the width parameters in PNN were also optimised by using GA. The term harmonic order refers to the peaks in the frequency spectrum of Figure 2, which is the harmonics of compressor working frequency. As shown in Table 4, the classification rate is the highest achieved, with 100% success being possible. Interestingly, it appears that very high orders of harmonics can play an important impact in successful classification of a fault, e.g. the two 100% classifications use harmonics of 60 and 69 (440Hz and 506Hz respectively). Again, it shows that it is not the absolute amplitude of the peak but the difference in amplitudes between the healthy and faulty conditions that is important. Moreover, it means that very high order of harmonics have to be used for fault classification although they have much lower in amplitudes. As shown in the third row the two peaks at 132Hz and 198Hz give a 98.48% successful classification rate even though the peaks at these frequencies are by no means amongst the largest. Table 4. Performance of GA-PNN classifier using features in the frequency domain. Number of features
Number of generation
Population size
65
30
30
Mutation value 0.001
70
30
30
0.001
35 10 70
30 50 50
30 40 50
0.001 0.001 0.001
70 65
50 30
100 30
0.002 0.002
Harmonic order selected 5,8,12,16,17,30,31,46, 47 1,3,4,10,12,15,28,29,3 3,34,39,52,56,63,65,67 18,27 1,2,3,6,9 1,4,9,23,25,33,41,42, 50,68 1,69 4,48,60
σ
Correct rate
0.006
98.48%
0.004
98.48%
0.006 0.005 0.008
98.48% 96.97% 98.48%
0.005 0.005
100.00% 100.00%
7. Conclusion Features from the time domain and frequency domain were extracted from vibration signal for separating different healthy conditions of the reciprocating compressor. The PNN using the combination of RMS, Variance and Kurtosis from the time domain gives a classification rate of 93.05%. With frequency domain analysis a successful classification rate of 95.50% has been achieved, which is slightly higher but it requires 65 harmonic peaks in the spectrum, which indicates that the frequency feature is more useful for classification. With GA-PNN approach, the success rate of using the time domain feature is very low, only 69.45% correct classification. However, in the frequency domain the success rate is uniformly high. Especially, two cases reach 100% successful classification and with a few of features. It thus can be stated that the application of GA with features from the frequency domain is an effective method for determining the best features. Moreover, it is concluded that features from the envelope spectrum is the optimal features for classifying the healthy and faulty conditions of reciprocating compressors. References [1].
Yang, B.-S., Han, T., Hwang, W-W. , Fault diagnosis of rotating machinery based on multiclass support vector machines. J. Mech. Sci. and Tech, 2005. 19(3) p. 846-859.
[2]. [3]. [4]. [5]. [6]. [7]. [8]. [9]. [10]. [11]. [12]. [13]. [14].
Samanta, B., K.R. Al-Balushi, and S.A. Al-Araimi, Artificial neural networks and genetic algorithm for bearing fault detection. Soft Computing - A Fusion of Foundations, Methodologies and Applications, 2006. 10(3): p. 264-271. Saxena, A. and A. Saad, Evolving an artificial neural network classifier for condition monitoring of rotating mechanical systems. Applied Soft Computing, 2007. 7(1): p. 441-454. Samanta, B., K.R. Al-Balushi, and S.A. Al-Araimi, Bearing fault detection using artificial neural networks and genetic algorithm. EURASIP J. Appl. Signal Process., 2004: p. 366-377. Kowalski, C.T. and T. Orlowska-Kowalska, Neural networks application for induction motor faults diagnosis. Math. Comput. Simul., 2003. 63(3-5): p. 435-448. Yadav, A.T.a.P., Application of ANN in condition monitoring of a deefective reciprocating air compressor. J. Instrum. Soc. India, 2005. 38(I): p. 7. Yang, B.-S., et al., Condition classification of small reciprocating compressor for refrigerators using artificial neural networks and support vector machines. Mechanical Systems and Signal Processing, 2005. 19(2): p. 371-390. L.B. Jack, A.K.N., A.C. McCormick, Genetic algorithms for feature extraction in machine condition monitoring with vibration signals. IEE Proceedings Vision and Image Signal Processing, 2000. 147: p. 205-212. Worden K, M., G., Hilson G., Pierce S.G, Genetic optimisation of a neural damage locator Original. Journal of Sound and Vibration, January 2008. 309(3-5, 22 ): p. 213-226. W, Y., Establishment of the mathematical model for diagnosing the engine valve faults by genetic programming. Journal of Sound and Vibration, May 2006. 293(1-2, 30): p. 213-226. Specht DF, S.P., On fully automatic feature measurement for banded chromosome classification. Cytometry, 1989. 10. Specht, D.F., Probabilistic neural networks. Neural Networks, 1990. 3(1): p. 109-118. Liao, H.a., A comparative study of feature selection methods for probabilistic neural networks in cancer classification. Proc. 15th IEEE Internat. Conf. on Tools with Artificial Intelligence, 2003. ICTAI. Tang, K.S.M., K.F.; Kwong, S.; He, Q, Genetic algorithms and their applications. Signal Processing Magazine, 1996. 13(6): p. 15.