International Journal of the Physical Sciences Vol. 7(3), pp. 462 - 470, 16 January, 2012 Available online at http://www.academicjournals.org/IJPS DOI: 10.5897/IJPS11.1638 ISSN 1992 - 1950 © 2012 Academic Journals
Full Length Research Paper
Fingerprint images segmentation based on fuzzy Cmean theory and statistical features Ala Balti1*, Mounir Sayadi2 and Farhat Fnaiech1,2,3 1
SICISI unit, ESSTT, University of Tunis, 5 Av. Taha Hussein, 1008,Tunis, Tunisia. LTI University Picardie Jules Verne, 9 Rue du Moulin Neuf, 80000 Amiens Cedex, France. 3 ETS, Department of Electrical Engineering, Chaire de recherche en conversion de l’énergie et électronique, de puissance, 1100 Rue Notre Dame Ouest, H3C 1K3 Montreal, Canada. 2
Accepted 23 December, 2011
Fingerprint segmentation is a crucial and important step of image processing in automatic fingerprint identification. Because, it is very important for alright fingerprint features extraction, such as, singular points, bifurcation and ridge ending minutia’s. The aim of the segmentation of fingerprint is to extract the interest area (foreground) and to exclude the background regions, in order to reduce the time of subsequent processing and to avoid detecting false features. This paper presents a new approach of fingerprints segmentation. This approach is based on variance image and combined fuzzy C-mean algorithm with the statistical features. Fingerprint segmentation results from the proposed method are validated and the accuracy of segmentation sensitivity for the test data available is evaluated. We have tested this technique on more than 1000 images fingerprint taken from “CASIA Fingerprint Image Database Version 5.0” (CASIA-FingerprintV5). Then a comparative study with the existing techniques is presented. The experimental results demonstrate the superiority, the effectiveness and the robustness of the proposed method. Key words: Fuzzy C-means, biometrics, fingerprint image, segmentation, statistical features. INTRODUCTION The captured fingerprint image is composed of two parts: foreground: area of interest and background: not interesting area (Balti et al., 2011; Güvenç et al., 2010). In this framework, fingerprint segmentation serves as the first stage of fingerprint recognition, and it aims to extract precisely fingerprint foreground from background (eliminating undesired background) and to remove uninterested regions. It is also used to detect noise and to reduce size of data (Thai, 2003). After correct segmentation, the enhancement, extraction of feature and minutia’s detection will be performed on the foreground fingerprint (Thai, 2003; Balti et al., 2010; Khalil et al., 2010). Most published results of fingerprint image segmentation are based on gray level image segmentation methods and they extract some features
*Corresponding author. E-mail: Balti Ala
[email protected].
(Bazen and Gerez, 2001; Hong et al., 1998; En et al., 2007; Chen et al., 2004), such as, the gray variance and frequency of the elements, clustering, neural networks and fuzzy methods. Several methods (Maltoni et al., 2003; Akram et al., 2008; Akram et al., 2008; Razzak et al., 2010; Siddiqui et al., 2011) are proposed mean and variance based method, they divide the fingerprint image into non-overlapping blocks, then compute the mean and the standard deviation value, after that, they select a threshold value. If the standard deviation value is greater than the threshold value, the block is considered as foreground; otherwise, it belongs to background. This method is commonly used, but it fails when the background is much distorted (Maltoni et al., 2003), also, the choice of the threshold value is critical and difficult. In another study, Akram et al. (2008) presented a modified gradient based method to extract region of interest. Zhu et al. (2006) propose the fingerprint segmentation method in two steps, in the first step, the non-ridge regions and
Balti et al.
Physical Fingerprint
Image Acquisition
Variance Fingerprint Image
Combined Fuzzy C-Mean algorithm with the statistical features
Load interest segmented area from original fingerprint image
Segmented Fingerprint Figure 1. Framework of the segmentation algorithm.
unrecoverable low quality ridge regions are removed as background, then the foreground produced by the first step is further analyzed for possible remover of the remaining ridge region. However, Yang et al. (2010) presented the sensor interoperability of fingerprint segmentation algorithm; they propose a K-means based segmentation method called SKI. SKI clusters foreground and background blocks of a fingerprint image, where a fingerprint block is represented by a 3-dimensional feature vector consisting of block wise mean, coherence and variance. With the same objective, Cao and Dai (2009) perform the segmentation in the online process of capturing image. The background is extracted from the sequential images which are captured online by the fingerprint sensor and it is removed by using frames difference. Chen et al. (2004) presented the segmentation fingerprint method based on three block features: the block clusters degree, the block mean information and the block variance. After that, an optimal linear classifier has been trained for the classification per block and the criteria of minimal number of misclassified samples are used. Many recent work can be extended to others techniques, such as, Zhu et al. (2006) trained the back propagation neural network with 11-dimension feature vector to classify foreground and background, Hu et al. (2010) propose a robust fingerprint segmentation technique using adaptive threshold after Log-Gabor filtering and orientation reliability, Malathi et al. (2010) propose a
463
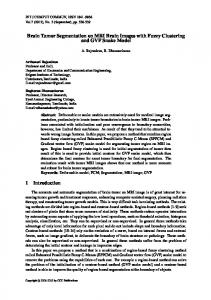
segmentation technique based on the Wiener filtering as a preprocessing step to eliminate noisy background. The shortcoming of these methods is its moderate segmentation performance. In this paper, we use the variance image and combined fuzzy C-mean (FCM) clustering algorithm with the statistical features for fingerprint image segmentation. It is an unsupervised clustering technique which has been widely used in image segmentation. It performs a fuzzy partition of a given data set (Sayadi et al., 2007; Oueslati et al., 2010). The advantages of FCM clustering algorithm are its straightforward implementation, its fairly robust behavior, its applicability to multichannel data and the ability of uncertainty data modeling (Sayadi et al., 2007; Oueslati et al., 2010); also, it has the ability to preserve more information from the original image. We could compare our method with mean and variance based method algorithm (Maltoni et al., 2003; Akram et al., 2008), K-means algorithm (Sayadi et al., 2007; Cao and Dai, 2009; Oueslati et al., 2010) and FCM algorithm (Sayadi et al., 2007; Oueslati et al., 2010). Steps of our fingerprint segmentation algorithm are as shown in Figure 1. First, divide the input fingerprint image I (i, j) into non-overlapping blocks with size w × w pixels (w = 9 in our algorithm). Then, compute the mean value M (I) and variance fingerprint image value Var (I) for each block. The combined FCM clustering with the statistical features is used for our segmentation algorithm; finally, we load interest segmentation area from original fingerprint image. This paper is organized as follows. First, we revisit the traditional methods, followed by the introduction of the proposed method for fingerprint images segmentation based on variance image and combined FCM algorithm with the statistical features, then, we present our detailed experimental results and finally, the conclusion.
OVERVIEW OF SEGMENTATION
IMAGE
AND
FINGERPRINT
Here, we revisit the traditional methods of image and fingerprint segmentation, such as the following. Mean and Variance algorithm Mean and variance theory is used in determination of regions where the intensity differences within the fingerprint image is high. On the fingerprint images, the ridge and valleys exhibit higher intensity differences (Görgünoglu and Çavusoglu, 2008; Hong et al. (1998). K-means algorithm The K-means algorithm is a method of dividing data into
464
Int. J. Phys. Sci.
clusters, or classes. K-means returns a data partition in objects within each cluster (Khan and Ahmad, 2004).
segmented fingerprint image. The main steps of fingerprint images segmentation method based on variance image and combined FCM algorithm with the statistical features are as follow:
Fuzzy C-means algorithm
Step 1: Divide the input image I (i, j) into non-overlapping blocks with size (w × w). The sweeping fingerprint image is to drag a window of dimension (w × w) initially selected from left to right and from top to bottom, the movement is window by window.
The fuzzy C-means is an unsupervised clustering algorithm which can be applied successfully to several problems involving feature analysis, clustering and classifier design in fields, such as image analysis, medical diagnosis, target recognition and image segmentation (Sayadi et al., 2007; Rignot et al., 1992).
Step 2: Compute the mean value M (I) for each block defined by Equation 5.
M (I )
w 2
1 w2
PROPOSED METHOD This method proposes to use the variance image and combined FCM clustering algorithm (Sayadi et al., 2007; Oueslati et al., 2010; Alkan, 2011), with the statistical features for fingerprint image segmentation. The FCM algorithm is the most widely used clustering method which is a ”fuzzy relative” to the simple C-means technique (Haralick et al., 1973) and it is used to cluster the obtained feature vectors into several classes corresponding to the different regions of the fingerprint image. The combined FCM clustering algorithm with the statistical features presented by Sayadi et al. (2007), replace the vector X used in the image segmentation method based on the pixel value and the FCM algorithm by a matrix F containing the same number of lines. This method proposes, also, to extract a feature vector from a sliding window. The use extracted features are: the mean, the variance, the third and the forth order moments of the sliding window (Sayadi et al., 2007). For a fingerprint image y of size (N × M), and a sliding window of size (w × w), the 4 features extracted from the window centered at pixel (n, r) are given by the following equations (Sayadi et al., 2007; Oueslati et al., 2010):
Me
V
1 MN
1 MN
Sk
Ku
w 2
( y(n i, r j) - Me) i
1 MN
1 MN
2
VAR( I )
1 w2
w 2
w 2
(I
w w i j 2 2
(i , j )
- M ( I ))2
(6)
After that, the input fingerprint image for the combined FCM algorithm with the statistical features presented (Sayadi et al., 2007; Oueslati et al., 2010) is the variance fingerprint image value Var (I) computed in steps 1, 2 and 3. The proposed technique to cluster the obtained feature vectors into several classes corresponding to the different regions of the fingerprint image can be summarized by the following steps: Step 4: Initialization (Iteration t=0). Randomly initialize the matrix V (0) of size(c × 4) containing the centers of the classes.
( y(n i, r j ) - Me)4
1
(3)
The matrix F, containing 4 columns. These columns contain 4 statistical features extracted from the sliding window centered around every pixel. These features are the mean Me, the variance V the third order moment Sk and the forth order moment K u of the window.
Fk (4)
w w i j 2 2
2 F - V m-1 i k F -V j j 1 k
uik using:
(2)
w w i j 2 2 w 2
Step 3: Use the mean value computed in step 2 to compute the variance fingerprint image value Var(I) defined by Equation 6:
uik
w 2
( y(n i, r j ) - Me)3 w 2
(5)
(i , j )
Step 6: Calculate the membership matrix U (t) of element
w w j 2 2
w 2
w w i j 2 2
(1)
w w i j 2 2 w 2
I
Step 5: Construction of the matrix F of size (d × 4) containing the statistical features extracted from the fingerprint image. From the iteration t = 1 to the end of the algorithm:
w 2
y ( n i, r j )
w 2
w 2
c
Vi
and
are vectors of size (1 × 4).
Step 7: Calculate the matrix V(t) composed of 4 columns d
Notes that w must have an odd value to obtain a centered window around each pixel. So, the combined FCM clustering algorithm with the statistical features presented by Sayadi et al. (2007) and Shiva et al. (2011) is used to cluster the obtained feature matrix F into c different classes. Every class corresponds to one region in the
vi
u k 1 d
m
ik
u k 1
(7)
ik
Fk m
vi
using:
(8)
Balti et al.
465
threshold, set manually.
than 20,000 images with various degrees of quality, captured using URU4000 fingerprint sensor. All fingerprint images are 8 bit gray-level BMP files and the image resolution is 328 × 356. We have chosen 12 fingerprint images for the test of the proposed method, as shown in Figure 2, they represent the original image (I). Also, let us compare the performance of our proposed algorithm to those in other published methods, such as, mean and variance based method algorithm (Maltoni et al., 2003; Akram et al., 2008), K-means algorithm (Sayadi et al., 2007; Cao and Dai, 2009; Alkan, 2011) and fuzzy C-means algorithm (Sayadi et al., 2007; Alkan, 2011). Figure 3 shows the steps of our fingerprint segmentation algorithm. However, the image shown in Figure 3a represents the original fingerprint image I (328 × 356) with gray level spread on the range [0, 255] taking from CASIA-Fingerprint V5 as shown in Figure 2. Figure 3b represents variance fingerprint image Var (I), (w = 9 in our algorithm), Figure 3c represents the segmentation results on fuzzy C-means and statistical features algorithm (segmentation mask), Figure 3d represents the foreground of fingerprints image (Interest area) and Figure 3d represents manual segmented fingerprint. Figure 4 shows a comparison of the results between some traditional methods and the proposed method. However, the image shown in Figure 4a represents the original fingerprint image I. The final image using the mean and variance algorithm, variance image and Kmeans algorithm, variance image and fuzzy C-means algorithm, variance image and combined fuzzy C-mean algorithm with the statistical features are as shown in Figure 4b, c, d and e, respectively. Comparing Figure 4b, c, d and e, one can find that the foreground of the fingerprint is much better segmented in figure than those in Figure b, c and d, also the first, the second and the third fingerprints contain some holes and noise in the segmented foreground and some pixels were incorrectly segmented from the background region, these do not exist in the reference segmented fingerprint. Regarding the accuracy, Tables 1 and 2 list the sensitivity segmentation rate (SS) and false accept segmentation rate (FAS) of the four methods for the data set used in the experiment. The sensitivity segmentation rate (SS) (Sayadi et al., 2007; Chaabane et al., 2010), the false accept segmentation rate (FAS) and false reject segmentation rate (FRS) (%) are defined by equation 9, 10 and 11, respectively as follows:
EXPERIMENTAL RESULTS
SS (%) 100
Figure 2. Image fingerprint set used in the experiment. Twelve were selected for a comparison study. The patterns are numbered from 1 through 12, starting at the upper left-hand corner.
Step 8: Convergence test; if
V t -V t-1 >
, then increment the
iteration t, and return to the Step 6, otherwise, stop the algorithm. ζ is a chosen positive threshold. ζ is a chosen positive
Here, several results of the simulations on the segmentation of fingerprint image, which illustrate the previously presented ideas, are given. In order to evaluate the performance of the proposed fingerprint image segmentation method, the CASIA Fingerprint Image Database Version 5.0 (CASIA-FingerprintV5) is used for testing. These databases contain more
CS
(9)
M N
FAS (%) 100
FA
(10)
M N
FRS (%) 100
FR M N
100 SS (%)
(11)
466
Int. J. Phys. Sci.
Figure 3. Segmentation results on fingerprint image. (a) Original image (328 × 356) with gray level spread on the range [0, 255] taking from CASIA-Fingerprint V5 shown in Figure 2, (b) variance fingerprint image, (c) segmentation results on fuzzy C-means and statistical features algorithm (segmentation mask), (d) interest area of fingerprints image, and (e) manual segmented fingerprint.
With SS, FAS, FRS, CS, FA, FR and N × M correspond, respectively, to sensitivity segmentation rate (%), false accept segmentation rate (%), false reject segmentation rate (%), number of correctly Segmented pixels, number of false accept segmented pixels, number of false reject segmented pixels and dimension of the fingerprint image. The acquisition of the correctly segmented pixels, number of false accept segmented pixels and number of false reject segmented pixels is not a manual process; hence, small program based on a reference fingerprint image and desired segmented fingerprint is run, which compares the obtained segmented pixels and the desired segmented pixels as shown in Figure 3d, e and Figure 4e and f. The correctly segmented pixels (CS), the false accept segmented pixels (FA) and the false reject segmented pixels (FR), given by Equations 12, 13 and 14, respectively, denote the probability of the number of correct segmented pixels knowing the number of desired segmented pixels (DS), the probability of the number of false accept segmented pixels, knowing the number of desired segmented pixels (DS) and the probability of the number of false reject segmented pixels, knowing the number of desired segmented pixels (DS). CS=P (Num Correctly Segmented pixels | Num Desired Segmented pixels) (12) FA=P (Num pixels)
False Accept Segmented pixels
| Num
Desired Segmented
(13)
FR=P (Num False Reject Segmented pixels | Num Desired Segmented pixels) (14)
Figure 4. Comparison of the proposed segmentation method with other existing methods on a fingerprint image. (a) Original image, (b) segmentation based on mean and variance algorithm, (c) segmentation based on variance image and K-means algorithm, (d) segmentation based on variance image and fuzzy C-means algorithm, (e) segmentation based on variance image and combined fuzzy C-mean algorithm with the statistical features (proposed method), and (f) manual segmented fingerprint.
The values of the segmentation sensitivity are illustrated in Table 2 for each segmented fingerprint. The fuzzy Cmean algorithm is compared with the K-means algorithm to demonstrate the accuracy improvement of the segmentation results. The experiments show clearly that the new method can reliably segment the fingerprint image. The segmentation sensitivity values reported in Tables 1 and 2 are plotted in Figures 5 and 6, respectively. Figures 5 and 6 show respectively four segmentation sensitivity plots and four false accept segmentation plots using traditional methods, such as mean and variance based method algorithm, variance image and K-means algorithm, variance image and fuzzy C-means algorithm when compared with the proposed method plot. As seen on Figures 5, the proposed method plot is located on the bottom of the other methods plots. So our method extracts exactly the foreground from the fingerprint image, it find the interest regions and reject noise regions. Referring to segmentation sensitivity plots given for Image 9, as shown in Figure 2 and Table 2, one observes that 14.08, 22.22, 10.36 and 12.93% of pixels were incorrectly segmented in Figure 4b, c, d and e, respectively. They are rates of false accept segmentation.
Balti et al.
467
Table 1. Rate sensitivity segmentation from mean and variance based method algorithm, variance image and K-means algorithm, variance image and fuzzy C-means algorithm and variance image and combined fuzzy C-mean algorithm with the statistical features for the data set shown in Figure 2.
Image Image 1 Image 2 Image 3 Image 4 Image 5 Image 6 Image 7 Image 8 Image 9 Image 10 Image 11 Image 12
Mean and variance based method algorithm 95.58 96.46 97.51 91.66 91.61 86.80 79.30 92.99 93.62 92.06 86.22 97.11
Sensitivity segmentation rate (%) Variance image Variance image and Variance image and combined Fuzzy Cand K-means fuzzy C-means Mean algorithm with the statistical features algorithm algorithm (proposed method) 98.03 69.21 91.03 97.03 96.01 89.11 97.93 96.66 91.17 96.11 93.80 87.16 96.61 93.59 72.99 93.85 78.18 76.70 93.59 58.35 58.37 96.39 77.95 79.03 95.36 92.05 83.70 96.73 87.50 83.80 94.12 82.09 83.21 97.35 95.64 85.22
Table 2. Rate false accept segmentation from mean and variance based method algorithm, variance image and K-means algorithm, variance image and fuzzy C-means algorithm and variance image and combined fuzzy C-mean algorithm with the statistical features for the data set shown in Figure 2.
Image Image 1 Image 2 Image 3 Image 4 Image 5 Image 6 Image 7 Image 8 Image 9 Image 10 Image 11 Image 12
Mean and variance based method algorithm 3.17 3.55 8.24 16.00 7.56 10.65 5.60 9.57 14.08 7.45 10.32 16.03
False accept segmentation rate (%) Variance image Variance image and Variance image and combined fuzzy Cand K-means fuzzy C-means mean algorithm with the statistical algorithm algorithm features (proposed method) 5.08 1.49 0.28 4.34 2.92 2.81 10.04 6.36 6.55 22.63 18.70 8.23 10.63 8.17 8.09 17.72 7.72 10.29 8.51 4.19 7.67 14.24 4.83 5.00 22.22 10.36 12.93 10.55 6.20 7.63 15.20 9.30 10.36 19.91 8.19 10.31
Comparing Figure 4b, c and d with e, the resulting foreground fingerprint by the proposed method is much clearer than the one given by the others methods, such as mean and variance based method algorithm, variance image and K-means algorithm, variance image and fuzzy proposed method and three other methods for comparison are given in Figure 8 that the proposed Cmeans algorithm. The final results of the fingerprint segmentation with the method as shown in Figure 8e based on variance image and combined fuzzy C-mean algorithm with the statistical
features provides an excellent texture segmentation results than those in Figure 8b, c and d. Conclusion In this paper, we have proposed a new method for fingerprint segmentation. It is based on variance image and combined fuzzy C-mean algorithm with the statistical features. The proposed method is compared with mean and
468
Int. J. Phys. Sci.
Figure 5. Rate sensitivity segmentation plots using mean and variance based method algorithm, variance image and K-means algorithm, variance image and fuzzy C-means algorithm and variance image and combined fuzzy C-mean algorithm with the statistical features for the data set shown in Figure 2.
Figure 6. Rate false accept segmentation plots using mean and variance based method algorithm, variance image and K-means algorithm, variance image and fuzzy C-means algorithm and variance image and combined fuzzy C-mean algorithm with the statistical features for the data set shown in Figure 2.
Balti et al.
Mean and Variance based method algorithm
Variance image and K-Means algorithm Variance image and Fuzzy C-Means algorithm Variance image and combined Fuzzy C-Mean algorithm with the statistical features (proposed method) Figure 7. Colors indicator plots of sensitivity segmentation rate and false accept segmentation rate.
Figure 8. Comparison of the proposed segmentation method with other existing methods on a complex fingerprint image. (a) Original image (328 × 356) with gray level spread on the range [0, 255] taking from CASIA-Fingerprint V5, (b) segmentation fingerprint based on mean and variance algorithm, (c) segmentation fingerprint based on variance image and K-means algorithm, (d) segmentation based on variance image and fuzzy C-means algorithm, and (e) segmentation fingerprint based on variance image and combined fuzzy C-mean algorithm with the statistical features.
469
470
Int. J. Phys. Sci.
variance algorithm, K-means algorithm and fuzzy Cmeans algorithm to demonstrate the accuracy improvement of the segmentation results. The performance of the segmentation process was numerically assessed using the accuracy of our verification system, for a given dataset, segmentation sensitivity rate and the false accept segmentation rate are computed to compare our method. Since the evaluation of our algorithms in comparison with other verification systems is very encouraging. The results obtained show that the proposed method can correctly detect the interesting area of fingerprints and it has proved the efficiency of the new method for segmentation fingerprints. REFERENCES Akram M, Tariq A, Nasir S, Khanam A (2008). Core Point Detection using Improved Segmentation and Orientation. AICCSA IEEE Int. Conf. Comput. Syst. Appl., pp. 637-644. Akram M, Nasir S, Tariq A, Zafar I, Khan W (2008). Improved fingerprint image segmentation using new modified gradient based technique. CCECE Canadian Conference on Elect. Comput. Eng., 001967001972. Alkan A (2011). Analysis of knee osteoarthritis by using fuzzy c-means clustering and SVM classification. SRE Scientific Res. Essays, 6(20): 4213-4219. Balti A, Sayadi M, Fnaiech F (2011). Segmentation and enhancement of fingerprint images using K-means, fuzzy C-mean algorithm and statistical features. CCCA the 1st IEEE international Conference on Communications, Computing and Control Applications. Balti A, Sayadi M, Fnaiech F (2010). A new statistical method of fingerprints. JTEA The 6th International Conference on Electrical Systems and Automatic Control, Hammamet, Tunisia. Bazen AM, Gerez SH (2001). Segmentation of fingerprint images. ProRISC Workshop on Circuits, Systems and Signal Processing. pp. 276-280. Cao JZ, Dai QY (2009). A Novel Online Fingerprint Segmentation Method Based on Frame-Difference. IASP Int. Conf. Image Anal. Signal Proces., pp. 57-60. Chaabane S, Sayadi M, Fnaiech F, Brassart E (2010). Colour Image Segmentation Using Homogeneity Method and Data Fusion Techniques. EURASIP J. Advan. Signal Proc. Article, ID 367297: p. 11 Chen X, Tian J, Cheng JG, Yang X (2004). Segmentation of Fingerprint Images Using Linear Classifier. EURASIP J. Appl. Signal. Appl. Proc., pp. 480-494. En Z, Jianping Y, Chunfeng H, Guomin Z (2007). Systematic methods of fingerprint ridge orientation estimation and image segmentation. Tongji Daxue Xuebao J. Tongji Univer., 35(5): 669-674. Görgünoglu S, Çavusoglu A (2008). A fast and simple algorithm for fingerprint segmentation, in Teknoloji, Cilt., 11(2): 87-92. Güvenç U, Demirci R, Karagül T (2010). Light refraction based medical image segmentation. SRE Scientific Res. Essays, 5(10): 1127-1132. Haralick RM, Shanmugam K, Dinstein I (1973). Textural features for image classification. IEEE Trans. Syst. Man. Cyber., 3: 610-621. Hong L, Wang YF, Jain AK (1998). Fingerprint image enhancement: algorithm and performance evaluation. IEEE Transactions on Pattern Analysis and Machine Intelligence, 20 (8): 777–789. Hu C, Yin J, Zhu E, Chen H, Li Y (2010). A Composite Fingerprint Segmentation Based on Log-Gabor Filter and Orientation Reliability. IEEE 17th International Conference on Image Processing.
Khalil MS, Dzulkifli M, Khan MK, Alghathbar K (2010). Singular points detection using fingerprint orientation field reliability. (IJPS) Int. J. Phys. l Sci., 5(4): 352-357. Khan SS, Ahmad A (2004). Cluster center initialization algorithm for Kmeans clustering, in Pattern recognition, 25: 1293-1302. Malathi S, Maheswari SU, Meena C (2010). Rolled Fingerprint Segmentation. Global J. Comput. Sci., Technol., 9: 5. Maltoni D, Maio D, Jain AK, Prabhakar S (2003). Handbook of Fingerprint Recognition. Springer-Verlag. Oueslati S, Cherif A, Solaiman B (2010). A new scheme of image watermarking based on fuzzy clustering theory. (JEEER) J. Elect. Elect. Eng. Res., 2(5): 114-121. Razzak MI, Yusof R, Khalid M (2010). Multimodal face and finger veins biometric authentication. (SRE) Scientific Research and Essays, 5(17): 2529-2534. Rignot E, Chellappa R, Dubois P (1992). Unsupervised segmentation of polarimetric SAR data using the covariance matrix, in Geosciences and Remote Sensing 30, IEEE Trans., pp. 697-705. Sayadi M, Tlig L, Fnaiech F (2007). A new Texture Segmentation Method Based on the Fuzzy C-Mean Algorithm and Statistical Features. J. Appl. Math. Sci., 1(60): 2999-3007. Shiva M, Aryafar A, Zaremotlagh S (2011). Fuzzy c- means cluster analysis, a robust multivariate technique in stream sediment geochemical exploration, a case study in Eastern part of Iran, Birjand. (JGMR) J. Geol. Min. Res., 3(1): 1-6. Siddiqui AB, Rashid M, Jaffar MA, Hussain A, Mirza AM (2011). Feature classification for multi-focus image fusion. (IJPS) Int. J. Phys. Sci., 6(20): 4838-4847. Thai R (2003). Fingerprint Image Enhancement and Minutiae Extraction. Technical report, The University of Western Australia. Yang G, Zhou G, Yin Y, Yang X (2010). K-Means Based Fingerprint Segmentation with Sensor Interoperability. EURASIP J. Advan. Signal Proc. Article. ID 729378 p.12. Zaidan AA, Karim HA, Ahmad NN, Alam GMA, Zaidan BB (2010). A new hybrid module for skin detector using fuzzy inference system structure and explicit rules. (IJPS) Int. J. Phys. Sci.., 5(13): 20842097. Zhu E, Yin J, Hu C, Zhang G (2006). A systematic method for fingerprint ridge orientation estimation and image segmentation. Pattern Recognition, 39: 1452-1472. Zhu E, Zhang J, Yin J, Zhang G, Hu C (2006). Removing the remaining ridges in fingerprint segmentation. J. Zhejiang Univer. Sci., 7: 976983.