AbstractâFisher distance based Genetic Algorithm: GA clustering method which takes into account overlapped space among probability density functions of ...
(IJARAI) International Journal of Advanced Research in Artificial Intelligence, Vol. 2, No.11, 2013
Fisher Distance Based GA Clustering Taking Into Account Overlapped Space Among Probability Density Functions of Clusters in Feature Space Kohei Arai 1 Graduate School of Science and Engineering Saga University Saga City, Japan
Abstract—Fisher distance based Genetic Algorithm: GA clustering method which takes into account overlapped space among probability density functions of clusters in feature space is proposed. Through experiments with simulation data of 2D and 3D feature space generated by random number generator, it is found that clustering performance depends on overlapped space among probability density function of clusters. Also it is found relation between cluster performance and the GA parameters, crossover and mutation probability as well as the number of features and the number of clusters. Keywords—GA clustering; Fisher distance; crossover; mutation; overlapped space among probability density functions of clusters
I.
INTRODUCTION
Genetic Algorithm: GA clustering is widely used for image clustering. It allows relatively good clustering performance with marginal computer resources. In particular, Fisher distance based GA clustering is well known [1]. It uses Fisher distance as fitness function of GA. It, however, is not clear the characteristics of Fisher distance based GA clustering. For instance, relation between clustering performance and overlapped space among probability density function of clusters. Also, relation between cluster performance and the GA parameters, crossover and mutation probability as well as the number of features and the number of clusters are unclear [2].
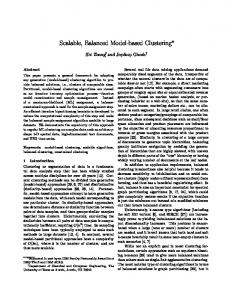
(1) where , , , denotes mean and variance of two features. The most appropriate linear discrimination function for multi-dimensional feature space is expressed as equation (2). (2) Discrimination function is illustrated in Fig.1. The line with arrow (linear discrimination border) in the Fig.1 in the orthogonal coordinate is discrimination function between two classes (two clusters). The slant coordinate of probability density functions for two classes implies cross section of the one dimensional probability functions for two classes.
The paper describes the aforementioned characteristics through simulation studies with random number generator derived simulation data with the different parameters. Also, the results from GA based clustering are compared to the Simulated Annealing based clustering [3]. The following section describes fundamental theoretical background of the Fisher distance based GA clustering method followed by some experimental results with simulation data. Then finally, conclusion and remarks are described together with some discussions. II.
PROPOSED MODEL
A. Fisher distance based GA clustering Fisher distance between two probability density functions of two features is defined as equation (1)
Fig. 1. Illustrative view of discrimination function in two dimensional feature space for two clusters
32 | P a g e www.ijarai.thesai.org
(IJARAI) International Journal of Advanced Research in Artificial Intelligence, Vol. 2, No.11, 2013
Therefore, fitness function as a function of H is expressed as equation (3) for two clusters case.
(3) If the following fitness function is set for GA, it allows finding of the most appropriate clustering results in the sense of minimizing Fisher distance.
(4) where
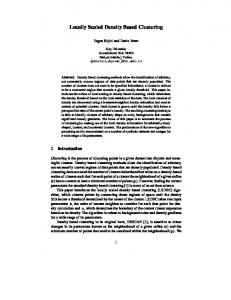
(overlapped space volume between two different probability density functions of two different cluster) as well as fo and fp denotes the functions which represent required computer resources and clustering performance, respectively. Through calculation of and , and are optimized. Thus optimum parameters of GA clustering (crossover and mutation probabilities) can be determined. III. Experiments A. Data Used Using Merssene Twister of random number generator, Gaussian distributed image datasets are generated for simulation studies. Fig.3 shows just one example of generated simulation data set for three cluster and two features (band 0 and 1) with 16 by 16 pixels of imagery data. The data is assumed the variables which range from zero to one (normalized data). Quantization level is 256.
(5) These are called between cluster variance and within cluster variance, respectively. Fisher distance based GA clustering is finding f(H) as to minimizing Fitness of equation (4). B. Problem definition on GA clustering Most of problems would occur when the probability density functions are overlapped in the feature space as shown in Fig.2. In this case, three clusters' probability density functions are overlapped.
(a) band 0
(b) band 1
Fig. 3. An example of generated simulation data set for three cluster and two features (band 0 and 1) with 16 by 16 pixels of imagery data.
Two datasets are generated for simulation studies, two cluster cases and three cluster cases. In the two cluster cases, mean vector is set as follows,
Fig. 2. Problem situations in GA clustering due to overlapping of probability density functions of clusters in feature space
If the following criterion equation is optimized, then c (crossover probability), m (mutation probability) would be optimized accordingly.
(1)Case 1: M1=(0.25,0.25)t, M2=(0.75,0.75)t (2)Case 2: M1=(0.3,0.3)t, M2=(0.75,0.75)t (3)Case 3: M1=(0.35,0.35)t, M2=(0.75,0.75)t (4)Case 4: M1=(0.4,0.4)t, M2=(0.75,0.75)t (5)Case 5: M1=(0.45,0.45)t, M2=(0.75,0.75)t (6)Case 6: M1=(0.5,0.5)t, M2=(0.75,0.75)t (7)Case 7: M1=(0.55,0.55)t, M2=(0.75,0.75)t (8)Case 8: M1=(0.6,0.6)t, M2=(0.75,0.75)t
(6)
Meanwhile, variance and covariance matrices for these 8 cases are set as same as follows,
(7)
Cx=|0.01 0.0 | |0.0 0.01|
where
(the overlapped space volume in the feature space ) and (8)
(7)
Simulation dataset of two class cases for the cases of 1 and 8 are distributed as shown in Fig.4 (a) and (b), respectively. Obviously, case 1 is easy to classify (best clustering performance) while case 8 is difficult to classify (worst
33 | P a g e www.ijarai.thesai.org
(IJARAI) International Journal of Advanced Research in Artificial Intelligence, Vol. 2, No.11, 2013
clustering performance) due to their overlapping situations of data distributions between two clusters. On the other hand, mean vectors are set for the following 8 cases of three cluster case, (1)Case 1: M1=(0.26,0.25)t, M2=(0.74,0.25)t, M3=(0.5,0.73)t (2)Case 2: M1=(0.28,0.28)t, M2=(0.72,0.26)t, M3=(0.5,0.69)t (3)Case 3: M1=(0.29,0.26)t, M2=(0.71,0.26)t, M3=(0.5,0.68)t (4)Case 4: M1=(0.29,0.26)t, M2=(0.711,0.26)t, M3=(0.5,0.68)t (5)Case 5: M1=(0.29,0.27)t, M2=(0.711,0.27)t, M3=(0.5,0.68)t (6)Case 6: M1=(0.29,0.27)t, M2=(0.709,0.27)t, M3=(0.5,0.68)t (7)Case 7: M1=(0.292,0.28)t, M2=(0.7,0.28)t, M3=(0.5,0.66)t (8)Case 8: M1=(0.295,0.287)t, M2=(0.69,0.28)t, t M3=(0.5,0.66)
(2)Case 2: C1=|0.008 0.0 | C2=|0.008 0.0 | C3=|0.008 0.0 | |0.0 0.008| |0.0 0.008| |0.0 0.008| (3)Case 3: C1=|0.01 0.0 | C2=|0.009 0.0 | C3=|0.009 0.0 | |0.0 0.01| |0.0 0.009| |0.0 0.009| (4)Case 4: C1=|0.01 0.0 | C2=|0.011 0.0 | C3=|0.011 0.0 | |0.0 0.011| |0.0 0.012| |0.0 0.01| (5)Case 5: C1=|0.012 0.0 | C2=|0.013 0.0 | C3=|0.011 0.0 | |0.0 0.012| |0.0 0.013| |0.0 0.01| (6)Case 6: C1=|0.013 0.0 | C2=|0.015 0.0 | C3=|0.011 0.0 | |0.0 0.013| |0.0 0.016| |0.0 0.01| (7)Case 7: C1=|0.013 0.0 | C2=|0.015 0.0 | C3=|0.012 0.0 | |0.0 0.013| |0.0 0.016| |0.0 0.0125| (8)Case 8: C1=|0.013 0.0 | C2=|0.015 0.0 | C3=|0.013 0.0 | |0.0 0.013| |0.0 0.016| |0.0 0.014| Simulation dataset of three class cases for the cases of 1 and 8 are distributed as shown in Fig.5 (a) and (b), respectively. Obviously, case 1 is easy to classify (best clustering performance) while case 8 is difficult to classify (worst clustering performance) due to their overlapping situations of data distributions among three clusters. B. Cluster performance evaluations Clustering performance is evaluated with the aforementioned simulation dataset together with the number of iteration for convergence. Convergence condition is set at 5% of residual error.
(a)Case1 (the most far case)
Fig.6 (a) and (b) shows the number of processing unit time as functions of crossover and mutation probabilities and Percent Correct Clustering: PCC as functions of crossover and mutation probabilities for the most far two data distributions of two cluster cases while Fig.7 (a) and (b) shows those for the closest two data distribution of two cluster cases.
(b)Case 2 (the closest case) Fig. 4. Data distribution of the simulation dataset in the feature plane for two class cases
Meanwhile, variance covariance matrices are set as follows for the 8cases of three cluster case, (1)Case 1: C1=|0.008 0.0 | C2=|0.008 0.0 | C3=|0.008 0.0 | |0.0 0.008| |0.0 0.008| |0.0 0.008|
(a)Case1 (the most far case)
34 | P a g e www.ijarai.thesai.org
(IJARAI) International Journal of Advanced Research in Artificial Intelligence, Vol. 2, No.11, 2013
(a)Number of processing unit time
(b)Case 2 (the closest case) Fig. 5. Data distribution of the simulation dataset in the feature plane for two class cases
(b) PCC Fig. 7. PCC and the number of processing unit time for the closest data distribution of two cluster case of the simulation dataset. (a)Number of processing unit time
(b) PCC Fig. 6. PCC and the number of processing unit time for the far data distribution of two cluster case of the simulation dataset.
As shown in Fig.6 and Fig.7, the most appropriate crossover and mutation probabilities depend on the overlapped space in the feature space which is expressed in equation (7). The relation between overlapped space volume and crossover and mutation probabilities is shown in Fig.8.
Fig. 8. Relation between overlapped space volume and crossover and mutation probabilities for two cluster datasets
Fig.9 (a) and (b) shows the number of processing unit time as functions of crossover and mutation probabilities and PCC as functions of crossover and mutation probabilities for the most far three data distributions of three cluster cases while
35 | P a g e www.ijarai.thesai.org
(IJARAI) International Journal of Advanced Research in Artificial Intelligence, Vol. 2, No.11, 2013
Fig.10 (a) and (b) shows those for the closest three data distribution of three cluster cases.
(b) PCC Fig. 10. PCC and the number of processing unit time for the closest data distribution of two cluster case of the simulation dataset.
(a)Number of processing unit time
(b) PCC Fig. 9. PCC and the number of processing unit time for the far data distribution of three cluster case of the simulation dataset.
As shown in Fig.9 and Fig.10, the most appropriate crossover and mutation probabilities depend on the overlapped space in the feature space which is expressed in equation (7). The relation between overlapped space volume and crossover and mutation probabilities is shown in Fig.11.
Fig. 11. Relation between overlapped space volume and crossover and mutation probabilities for three cluster datasets
Table 1 shows comparisons among GA clustering performance for three cluster case with the different parameters of crossover and mutation probabilities. It also shows a comparison between GA clustering and Simulated Annealing method. TABLE I. COMPARISONS AMONG GA CLUSTERING PERFORMANCE FOR THREE CLUSTER CASE WITH THE DIFFERENT PARAMETERS OF CROSSOVER AND MUTATION PROBABILITIES AS WELL AS SIMULATED ANNEALING METHOD CROSSOVER
MUTATION
CLUSTER PERFORMANCE
NUMBER OF ITERATION
0.1
0.05
0.85
88359
0.2(OPTIMUM)
0.08(OPTIMUM)
0.95
164670
0.8
0.4
0.97
707698
SIMULATED ANNEALING
0.98
8783578
(a)Number of processing unit time
36 | P a g e www.ijarai.thesai.org
(IJARAI) International Journal of Advanced Research in Artificial Intelligence, Vol. 2, No.11, 2013
Crossover and mutation probabilities are optimized empirically. As the results, 0.2 and 0.08 of crossover and mutation probabilities are optimum parameters ofr GA cluatering for this three cluster cases. Simulated Annealing SA allows global optimum. Therefore cluster performance for SA based clustering should be 100 % accurate. Due to tha fact that allowable residual error is set at 5% as convergence condition, cluster performance of the SA based clustering is 98% . On the other ahnd, the number of iterations for SA based clustering is 8783578 while that for GA based clustering is 164670 at the optimum GA parameters. Therefore, computation resources of SA based clustering requires 53 times longer than that of GA based clustering. The difference of clustering performance between SA based clustering and GA based clustering is just 3%. Therefore, GA based clustering allows much faster clustering than SA based clustering with acceptable clustering performance.
On the other ahnd, the number of iterations for SA based clustering is 8783578 while that for GA based clustering is 164670 at the optimum GA parameters. Therefore, computation resources of SA based clustering requires 53 times longer than that of GA based clustering. The difference of clustering performance between SA based clustering and GA based clustering is just 3%. Therefore, GA based clustering allows much faster clustering than SA based clustering with acceptable clustering performance. ACKNOWLEDGMENT The author would like to thank Mr. Mitsuki Nakamura for his efforts through experiments and simulations. [1] [2]
III.
CONCLUSION
Fisher distance based Genetic Algorithm: GA clustering method which takes into account overlapped space among probability density functions of clusters in feature space is proposed. Through experiments with simulation data of 2D and 3D feature space generated by random number generator, it is found that clustering performance depends on overlapped space among probability density function of clusters. Also it is found relation between cluster performance and the GA parameters, crossover and mutation probability as well as the number of features and the number of clusters. From the experimental results with three cluster case, it is found that 0.2 and 0.08 of crossover and mutation probabilities are optimum parameters ofr GA cluatering. Although Simulated Annealing SA based clustering should be 100 % accurate, cluster performance of the SA based clustering is 98%.due to tha fact that allowable residual error is set at 5% as convergence condition, .
[3]
REFERENCES Arai, K., Lecture note for image processing, Gakujutsu-Tosho-Shuppan publicing Co. Ltd., 1999. Arai, K., Remote Sensing Satellite image processing methods with Java programing language, Morikita Shuppan publicing Co. Ltd., 2001. Arai, K., Fundamental theory for pattern recognition, Gakujutsu Tosho Shuppan, Publicing Co. Ltd., 1999. AUTHORS PROFILE
Kohei Arai, He received BS, MS and PhD degrees in 1972, 1974 and 1982, respectively. He was with The Institute for Industrial Science and Technology of the University of Tokyo from April 1974 to December 1978 also was with National Space Development Agency of Japan from January, 1979 to March, 1990. During from 1985 to 1987, he was with Canada Centre for Remote Sensing as a Post Doctoral Fellow of National Science and Engineering Research Council of Canada. He moved to Saga University as a Professor in Department of Information Science on April 1990. He was a councilor for the Aeronautics and Space related to the Technology Committee of the Ministry of Science and Technology during from 1998 to 2000. He was a councilor of Saga University for 2002 and 2003. He also was an executive councilor for the Remote Sensing Society of Japan for 2003 to 2005. He is an Adjunct Professor of University of Arizona, USA since 1998. He also is Vice Chairman of the Commission “A” of ICSU/COSPAR since 2008. He wrote 30 books and published 322 journal papers
37 | P a g e www.ijarai.thesai.org