Awadhesh Kumar et al. / International Journal of Engineering Science and Technology (IJEST)
FMEA: Methodology, Design and Implementation in a Foundry AWADHESH KUMAR Associate professor, Department of Mechanical Engineering Malaviya National Institute of technology, Jaipur (India)
[email protected]
M.P. POONIA Professor, Department of Mechanical Engineering Malaviya National Institute of technology, Jaipur (India)
[email protected]
UPENDER PANDEL Professor, Department of Metallurgical and Materials Engineering Malaviya National Institute of technology, Jaipur (India)
[email protected]
A.S. JETHOO Associate professor, Department of Civil Engineering Malaviya National Institute of technology, Jaipur (India) Telephone: +919414548036, Fax: +911412529029
[email protected]
Abstract— Failure Mode And Effect Analysis (FMEA) is a technique to identify and prioritize potential failures of a process. This paper reports the description of FMEA methodology & its implementation in a foundry. It is used as a tool to assure products quality & as a mean to improve operational performance of the process. The work was developed in an Indian foundry, in co-operation with part of the internal staff chosen as FMEA team members & was focused on the study of core making process. The problems identified in the various steps of core making process contributing for high rejection are studied & analyzed in terms of RPN to prioritize the attention for each of the problem. The monetary loss due to core rejection is considered as measure of risk. Keywords— Core, FMEA, Failure Mode, Risk priority number
1. Introduction Process FMEA is used to solve problems due to manufacturing processes. It starts with a process flow chart that shows each of the manufacturing steps of a product. The potential failure modes and potential causes for each of the process steps are identified, followed by the effects of failures on the product and product end users. The risks of these effects are then assessed accordingly.[1] 2. Material and methods The three major steps of the FMEA are as outlined in table 1 below.
ISSN : 0975-5462
Vol. 3 No. 6 June 2011
5288
Awadhesh Kumar et al. / International Journal of Engineering Science and Technology (IJEST) Table 1: Three major steps of FMEA task.
FMEA Task Identify Failures Prioritize Failures
Reduce Risk
Results Describe failures : Causes---Failure Modes ------Effects Assess Risk Priority Numbers (RPN) RPN = failure occurrence x effects severity x detection difficulty Reduce risk through : reliability, test plans, manufacturing changes, inspection, etc.
2.1 Terminology in FMEA • • •
Failure Mode:- Physical description of a failure. It is the manner in which the process fails to perform its intended function. Failure Effect:- It is an impact of failure on process, equipment. It is an adverse consequence that the customer / user might experience. Failure Cause:- It refers to the cause of failure.
2.2 FMEA VARIABLES: • Severity of effect (S):- Severity measures the seriousness of the effects of a failure mode. Severity categories are estimated using a 1 to 10 scale. •
Probability of occurrence(O):- Occurrence is related to the probability of the failure mode and cause.
•
Detection (D):- The assessment of the ability of the “design controls” to identify a potential cause. Detection scores are generated on the basis of likelihood of detection by the relevant company design review, testing programs, or quality control measures.
•
Risk Priority Number (RPN):- The Risk Priority Number is the product of the Severity (S), Occurrence (O), and Detection (D) ranking. The RPN is a measure of design risk and will compute between “1” and “1000.” 3. About Foundry
Ghatge – Patil industries Ltd. foundry division produces ductile iron castings such as brake drums , transmission cases , cylinder heads, flywheel housing etc. of grades FG220 , FG260 , and FG300 , and nodular (S. G.) iron castings such as wheel hubs, rear axel housing , differential cases , brake systems , brake discs etc. of grades SG 450/10, SG 500/7. Company produces more than 3000 tons of castings per month and caters the requirement of leading original equipment manufacturers of commercial vehicles, tractors, diesel engines etc. 3.1 PLANT: - It is equipped with a fully automatic high pressure molding line, capable of producing 87 boxes per hour, cold box shooters ranging from 8 kg. to 110 kg. with sand mixers of capacity 225 kg. Etc. 3.2 Metrological Facilities: - ARL spectrometer, Neophot 21 microscope, Universal Testing Machine hardness testing machines (Brinell and Rockwell), scratch hardness tester, etc. 3.3 Core Manufacturing Process:- In core making , cold box core making process involves mixing of fine dry sand with a binder. The curing of core is obtained simply by blowing a gaseous catalyst through the blown mass of sand in the core box. The various steps taken out in cold box core making process are• Core sand drying: - sand is dried in sand dryer to remove the moisture as presence of moisture reduces the strength and hardness of core. • Sand Mixing by Batch Type Mixer: - Sand is mixed with binder in the mixer. The temperature of sand while mixing should be 40°c for good dispersion of binder.
ISSN : 0975-5462
Vol. 3 No. 6 June 2011
5289
Awadhesh Kumar et al. / International Journal of Engineering Science and Technology (IJEST)
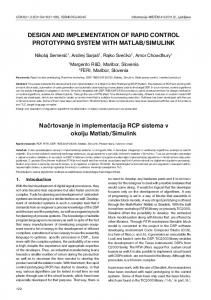
• Core Making:- Cores are made by core making machines by shooting sand mix into core box. The core is then cured by blowing gaseous triethyl amine. • Core Dressing :- Cores are dressed to remove fins and to get good surface finish. • Core Coating :- Cores are coated with paint to get good surface finish. Then the cores ae dried in the oven. • Core Drying: - Cores are dried by passing them through oven to remove moisture and to harden the binder. Applying FMEA to a process means following a series of successive steps: analysis of the process in every single part, list of identified potential failures, evaluation of their frequency, severity and detection technique, global evaluation of problem, and identification of the corrective actions that could eliminate or reduce the chance of potential failures. This task is achieved on team basis because FMEA is a team function. In the analyzed case the FMEA team included some members of the internal staff knowledgeable and experienced in the process. They were the Production Manager, the Quality Assurance Manager, the Maintenance Operators, and A.V.P. as FMEA expert to co-ordinate the team activities based on the implementation of FMEA theory and the data collected during the work. The most important aspect of FMEA is the evaluation of risk level of potential failures identified for every subprocess. The global value of the damages caused on the function by every failure is indicated with the risk priority number (RPN).This number (from 1 to 1000) is an index obtained from the multiplication of three risk parameters, which are: Severity of the problem in terms of its effect on the customer or manufacturing / Assembly. Relative probability that the failure will occur (occurrence). Probability that the failure mode will be detected and / or corrected by the applicable controls installed on the process. As a guide to the evaluation of these parameters, the FMEA team defines numerical scales, created on the basis of reference manual [6] and adapted at the particular risk situation of the process. In this way every problem can be evaluated with a precise risk value. The scale drafting is one of the FMEA steps that allow more freedom of choice to the team. There is no standard for the choice of scale ranking, but generally, FMEA team prefers ranking of 1 to 10,because it provides ease of interpretation, and at the same time, accuracy and precision ( Stamatis, 1997). 4. Operative application of the Methodology 4.1 Data Collection:-Before design and implementation of FMEA to core making process it is required to have careful knowledge of the process, therefore the same is studied by using process flow chart. The first phase of the work was to collect the core rejection data, information about cores, production lines and core making machines through visits to the production plant. Percent average Core rejection of three months is gathered from QC reports and the most common problems due to which cores are rejected are noted before the start of the study. Table 2 below lists the problem areas, along with the percentage of rejection of the cores and represented in the figure 1. Table 2:- Cores Rejection Details
ISSN : 0975-5462
Sr.No 1 2 3 4 5 6 7
Problem Description Low Scratch Hardness Cores Damaged / Cracked R / B In Sand Mix Cores Not Cured Core Fin Low Strength Of Cores Spongy Cores
8
Unfilled Cores
1%
9
Poor Surface Finish
1%
Vol. 3 No. 6 June 2011
% Rejection 29% 22% 15% 14% 8% 5% 4%
5290
Awadhesh Kumar et al. / International Journal of Engineering Science and Technology (IJEST)
The data collected for three months clearly indicates the percentage contribution of rejection by each problem. The most common problems contributing major core rejection are 1) low scratch hardness of cores 2) damaged / cracked cores 3) Resin Balls In Sand Mixed 4) Uncured cores 5) core fin and 6) low strength of cores. Figure 1- Cai\uses for Rejection of Cores
35 30
29 24
%Rejection
25 20
15
15
13 8
10
5
5
4
1
1
8
9
0 1
2
3
4
5
6
7
Reasons for Rejection 4.2 Analysis of the data:- Once the core rejection data is gathered the areas where concentration is required are finalized so that the rejection of cores will come down. Accordingly efforts have been put to reduce the rejection. The team started analysis of the data to identify causes of occurrence of each problem and effects of these problems on quality characteristics of the cores. Problem solving techniques such as Why & Why Analysis, Brainstorming and Cause & Effect Diagram have been used to find the probable causes and their effects for rejection of the cores. Once FMEA team obtained all the information available about the problems of core rejection or potential failures of the core making process, it moved the operative phase of risk evaluation through definition of the FMEA form. The form used in this work is based on the reference manual [6]. The form reported the detected rejection typologies and some additional information associated with them: potential causes, failure effects, and description of line controls that detect the failures, evaluation of three risk parameters and calculation of RPN of each cause of the problem. The evaluation of the three risk parameters is done on the numerical scale defined by the FMEA team created on the basis of reference manual developed by AIAG. The numerical scales are shown in the table 4 & 5. They are based on the needs of the high pressure molding line of the company or final product. The cause having higher RPN is given priority. Table 4: FMEA Occurrence Evaluation Criteria.
Probability of failure
Likely failure rates
occurrence
Very high: Persistent failures
≥100 per thousand cores
10
50 per thousand cores 20 per thousand cores
9 8
10 per thousand cores 5 per thousand cores
7 6
2 per thousand cores 1 per thousand cores
5 4
0.5 per thousand cores
3
0.1 per thousand cores ≤ 0.01 per thousand pieces
2 1
High: Frequent Failures Moderate: occasional Failures Low: Relatively Few Failures Low: Relatively Few Failures Remote: unlikely
Failure
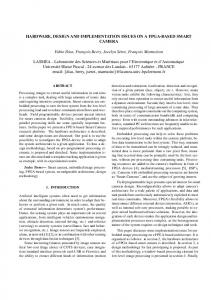
.3 Pareto Diagram: - The collected data has further studied and analyzed using Pareto analysis technique as shown in table 6 and Pareto diagram 2.
ISSN : 0975-5462
Vol. 3 No. 6 June 2011
5291
Awadhesh Kumar et al. / International Journal of Engineering Science and Technology (IJEST) Figure 2 – Pareto diagram for problem areas of rejection in Cores 120
35 30 25 20
29 100
24
80 15
15
60
13
40
8
10
5
5
4 1
1
20 0
Lo w c o sc r r e at c sd h am h a a rd R B ged nes s i /cr s a n m ck co ixe ed re d c sn o o t n d. cu Lo re w d st r c en or e gt fin h sp o f on co re g u yc p o nfi ore l or le s su d c rfa or ce es fin i sh
0
Reasons For Rejection The diagram helps to focus on the problems that represent at least 80% of the rejection. The four most significant problem areas are low scratch hardness, damaged / cracked cores, R / B in sand mix, and cores not cured, they are responsible for 81% of the rejection. Table 5: Process FMEA Severity and Detection Evaluation Criteria.
Effect Hazardous without warning
Criteria: Severity of effect Very high severity ranking when a potential failure mode affects the safe core operation and / or involves noncompliance with government regulation. Failure occurs without warning. Very high severity ranking when a potential failure mode affects the safe core operation and / or involves noncompliance with government regulation. Failure occurs with warning. Core is inoperable with loss of primary function. Customer is dissatisfied.
Detection Absolute uncertainty
High
Core operable, but with loss of performance. Customer is dissatisfied.
Very low
Moderate
Core operable, but comfort / convenience item(s) inoperable at reduced level of performance. Customer experiences discomfort. Core operable, but with loss of performance of comfort items. Customer has some dissatisfaction.
Low
Very low
Certain core characteristics do not confirm. Defect noticed by most of the customers.
Moderately high
Minor
Certain core characteristics do not confirm. Defect noticed by average customer.
High
Very minor
Certain core characteristics do not confirm. Defect noticed by discriminating customers.
Very high
Very none
No effect
Almost certain
Hazardous with warning
Very high
Low
minor
ISSN : 0975-5462
Very remote
Remote
Moderate
Vol. 3 No. 6 June 2011
Detection Criteria Design control will not and or can not detect a potential cause or mechanism and subsequent failure mode or there is no design control. Very remote chance the design control will detect a potential cause or mechanism and subsequent failure mode.
Rank 10
Remote chance the design control will detect a cause or mechanism and subsequent failure mode. Very low chance the design control will detect a cause or mechanism and subsequent failure mode Low chance the design control will detect a cause or mechanism and subsequent failure mode Moderate chance the design control will detect a cause or mechanism and subsequent failure mode Moderately high chance the design control will detect a cause or mechanism and subsequent failure mode. High chance the design control will detect a cause or mechanism and subsequent failure mode Very high chance the design control will detect a cause or mechanism and subsequent failure mode Design control will almost certainly detect a potential cause or mechanism and subsequent failure mode
8
9
7
6
5
4
3
2
1
5292
Awadhesh Kumar et al. / International Journal of Engineering Science and Technology (IJEST) Table 6 – Cumulative Percent of Rejection of Cores
Sr. No. .
Rejection Details
Percent Rejection
1 2 3 4 5 6 7 8 9
Low Scratch Hardness Damaged/Cracked Cores Resin Balls In Mixed sand Uncured Cores Core Fin Low Strength Of Core Spongy Cores Unfilled Cores Poor Surface Finish
29% 24% 15% 13% 8% 5% 4% 1% 1%
Cumulativ e Percent of Rejection 29% 53% 68% 81% 89% 94% 98% 99% 100%
For the core of weight 10kg and the rate Rs 8 /kg, total number of cores rejected by the above four most significant problems before FMEA implementation are shown in table 7. Table 7:- Cores rejection and subsequent monetary loss per year due to four most significant problems
Sr. no. 1 2 3 4
Problem description Low scratch hardness Damaged / cracked cores R/B in sand mix Uncured cores Total
Rejection / year 9,132 6,924 4,840 4,548 25,444
Monetary loss / year 7,30,560 5,53,920 3,87,200 3,63,840 20,35,520
The % rejection is = 81% Together they are costing the company Rs 20.35 lakhs annually. This implies that eliminating / reducing them would result in a savings of the same amount. The issue of low scratch hardness of cores must be addressed first. Eliminating this problem will result in a savings of Rs 7.30 lakhs annually, more than for any other problem listed. Pareto diagram help crystallize thinking on priorities – that is eliminating which problem will give the most benefit i.e. cost saving. Total core rejection and subsequent monetary loss per year due to all the nine problems identified is as shown in table 8. Table 8:- core rejection and subsequent monetary loss Average production per year = 538,092.
Sr.no.
Problem description
Avg. Rejection / year
1
Low scratch hardness
9,132
7,30,560
2
Damaged / cracked cores
6,924
5,53,920
3
R/B in sand mix
4,840
3,87,200
4
Uncured cores
4,548
3,63,840
5
Core Fin
2524
2,01,920
6
Low strength of cores
1488
1,19,040
7
Spongy cores
1256
1,00,480
8
Unfilled cores
328
26,240
9
Poor surface finish
308
24,640
Total
31,356
Monetary loss / year
25,07,840
Percent rejection of cores = 5.82% approximately = 6%. The monetary loss is the cost of failure / rejection of the cores and it is taken as a measure of risk. This cost becomes greater if the origin and detection stages of the core failure become further apart in time.
ISSN : 0975-5462
Vol. 3 No. 6 June 2011
5293
Awadhesh Kumar et al. / International Journal of Engineering Science and Technology (IJEST) 5. FMEA Implementation
From the analysis of the core rejection data it is understood that all the problems are related with quality of the cores which affect on quality of final product i.e. castings. The problems are due to loopholes in • Manufacturing Process. • Work Instructions to operators. • Untrained workers. And • Maintenance. The team concentrated the above areas for recommending corrective actions. The implementation of the corrective actions helps to eliminate/reduce occurrence & detection of the causes/problems. The recommended actions for each of the problems or their causes are given in the table 9. After implementation of recommendations the results are reviewed in terms of RPN & are compared with old RPN as shown in table 10. The results obtained implementing the FMEA to the cold box core making process, i.e. the corrective actions recommended by FMEA team, have been realized into a series of preventive maintenance actions and into a list of operative instructions, which have to be done by operative personnel during standard work operations. The control & analysis of the problems affecting the final core quality revealed that the most common problems were technical due to the operational process that could be detected, taped, & corrected only with a control that follows step by step the production process. The resulting RPN after FMEA implementation is observed reduced than original RPN & it thus shows the reduction in rejection of cores. The resulting RPN is reduced due to implementation of corrective actions that help to reduce / eliminate occurrence & detection of the causes / problems. The occurrence ranking is based on the likely rejection of cores per thousand pieces of cores (Table 4). Occurrence ranking is reduced as the likely rejection of cores per thousand pieces of cores is reduced due to implementation of recommendations.
The core rejection & subsequent monetary loss after implementation of recommendations is given in table 11. Table 11:- Core rejection & subsequent monetary loss
Sr. no.
Problem description
1 2
Low scratch hardness Damaged / cracked cores R/B in sand mix Uncured cores Core Fin Low strength of cores Spongy cores Unfilled cores Poor surface finish
3 4 5 6 7 8 9
Monetary loss / year
Avg. Rejection / year 6584 4500
5,26,720 3,60,000
2916 2424 1332 1072 1072 156 132 20,188
2,33,280 1,93,920 1,06,560 85,760 85,760 12,480 10,560 16,150,40
Total
10) Percent rejection of cores after implementation of recommendations = 100 x 20,188 / 5, 38,092 = 3.75 % 100 x 3.75 / 5.82 = 64% 11) Percent reduction in rejection after Implementation of recommendations. = 5.82 – 3.75 = 2.07 % = 2.07 x 100 / 5.82 = 36 % Cores rejection and monetary loss due to four most significant problems after implementation of recommendations is as shown in table 12.
ISSN : 0975-5462
Vol. 3 No. 6 June 2011
5294
Awadhesh Kumar et al. / International Journal of Engineering Science and Technology (IJEST) Table 12:- Core rejection & subsequent monetary loss
Sr. no. 1 2 3 4
Problem description Low scratch hardness Damaged / cracked cores R/B in sand mix Uncured cores Total
Rejection / year 6584 4500
Monetary loss / year 5,26,720 3,60,000
2916 2424 16,424
2,33,280 1,93,920 13,13,920
Percent contribution of rejection by four most significant problems after implementation of recommendations = 100 x 16,424 / 31,356 = 52.37% Percent reduction in rejection due to four most significant problems after Implementation of recommendations = 81.1 – 52.37 = 28.73 % 6: Results and discussion The design and subsequent implementation of FMEA in this foundry has permitted to detect which were the most probable and serious problems or causes in the core making process responsible for core rejection. The criteria used to evaluate these problems or causes are the amount of damage caused to the production in terms of core rejection or lost production volume and subsequent monitory loss. Table 10 reports the list of failure modes individuated by FMEA team for every process step and their original and final associated RPN values reduced, due to the execution of the recommended actions. The reading of the table reveals that the “low scratch hardness” of the cores due to less addition of resin / activator in the mixing step is the greatest RPN failure mode individuated in the production process by FMEA team. The reasons are high values of severity and occurrence, due to the fact that the addition of resin / activator is manual and mixed sand is supplied to eight core making machines for core production. The cores made by the sand mix with less resin added have low scratch hardness, the core is inoperable i.e. loss of primary function. 100% of the core is to be scrapped. The rejection can be reduced through the execution of the recommended action such as providing auto dosing system for addition of sand, resin and activator. As this one, all the problems with a great RPN are considered by FMEA team. The total rejection of cores made by cold box core making process and subsequent monetary loss before implementation of FMEA was 5.82 %. The management of the foundry wants to reduce the rejection below 5 % by implementing FMEA tool. After implementation of FMEA to the core making process the rejection of cores and subsequent loss was reduced to 36% of the total rejection. Table 9: Recommendations by FMEA team
Sr. No. 1
Problem Description Less scratch hardness
Cause(s)
Recommended Actions
Less addition of resin
i) Provide auto dosing system using PLC unit for addition of sand, resin and activator. ii) Calibrate Auto Dosing System once in every shift, as per guidelines provided. iii) Train operator for auto dosing system. iv) Ensure preventive maintenance of pumps at every weekend. v) Prepare work instruction sheet for mixing operator. i) Consume the sand mix within one hour. If machine is stopped for more than one hour transfer the sand mix to other machine. ii) Prepare work instruction sheet for core making machine operator & display it on each machine. i) Provide clamps for clamping the plate before strapping the core. i) Clean the core box by compressed air after every core is withdrawn from core box to prevent sand trapping and jamming of loose piece. ii) Update work instruction sheet prepared for core making
Expire Bench Life of sand mix.
2
Damaged cracked cores
/
Sliding plate movement Loose piece jam
ISSN : 0975-5462
Vol. 3 No. 6 June 2011
5295
Awadhesh Kumar et al. / International Journal of Engineering Science and Technology (IJEST)
Parallelity of core box plate
3
Resin balls mixed sand
4
Uncured cores
in
Scrapper gap increased
i) core box vents chocked
ii) low air gassing pressure
iii) sealing cord of gassing head damaged
5
Core fin
Improper trimming
6
Sand temp.above 40°c
i) Blower is not operating
ii) Inlet valve opening of the cooling system is not proper 7
Spongy cores
i) Less pressure
sand
shooting
ii) Sealing cord of sand shooting head is damaged 8.
Unfilled cores
i) Sand shooting nozzle is blocked. ii) Less sand in hopper
9.
Poor finish
i) Viscosity of paint
surface
ii) Unclean cores
ISSN : 0975-5462
operator. i) Ensure parallelity of core box with core box plate when core box is mounted on the plate. ii) Prepare work instruction sheet for core box maintenance group which is loading & unloading the core box from core making machine. i) Ensure 1.5 mm gap between scrapper & bottom of mixer by template at the start of every shift. ii) Provide a slot on the scrapper to lower the scrapper by loosening the bolts to maintain the gap. iii) Update the work instruction sheet & display it at mixer in mixing section for mixing operator. iv) Ensure the gap & condition of scrapper at every weekend by maintenance dept. i) Clean the core box vents by compressed air at the start of every shift. ii) clean / replace the vents after the core box is unloaded from machine by core box maintenance group. i) Prepare machine operating parameter chart & display it on the core making machine. ii) Ensure the air pressure on the gauge with the pressure specified in the machine operating parameter chart. iii) Ensure the interlocking of the air pressure switch with the core making machine. iv) Remove the sand particles trapped which hampers interlocking of pressure switch with machine. i) Replace the cord after every four months. ii) Ensure the cord for damage at every weekend by maintenance dept. iii) Update work instruction sheet for maintenance group. i) Train the workers about proper use of tools & demonstrate the procedure of trimming the cores to eliminate / reduce core fins. i) Provide temp. Indicator at the inlet & outlet of the storage hopper to ensure temp. of sand. ii) Ensure sand temp. by temp. Indicator before adding it to the mixer in every shift. iii) Ensure the blower operation on pressure gauge (800-1200 mmwc) at the start of every shift. iv) Update the instruction sheet for mixing operator.
i) Ensure the inlet valve opening of the cooling system on pressure gauge ( 0.5 – 1.5 kg / sq. cm ) in every shift. ii) Update the work instruction sheet. i) Ensure the sand shooting pressure on gauge with the pressure specified in the operating parameters chart at the start of every shift. ii) Confirm the interlocking of pressure switches with machine at every weekend by maintenance dept. iii) Clean the pressure switches to remove sand particles trapped which hampers the interlocking of pressure switch with machine. i) Provide 1.0 mm gap between sealing cord and core box face to protect the cord from damage. ii) Check for cord damage at every weekend. i) Clean the nozzle and machine hopper at the end of every shift or if the machine is stopped for more than 15 minutes. i) ensure the capacity of machine hopper & accordingly ask the mixing operator to supply sand mix i) Check viscosity of paint every two hours by B4 cup. Maintain the viscosity 14-17 sec. i) Clean the cores by compressed air before applying paint.
Vol. 3 No. 6 June 2011
5296
Awadhesh Kumar et al. / International Journal of Engineering Science and Technology (IJEST) Table 10- percent reduction in rejection of cores after implementation of recommendations and old & new RPN
Sr. No. 1
Problem Description
2
Damaged / cracked cores
Less scratch hardness
3 4
Blow holes in casting Uncured cores
5 6
Core fin Low strength of cores
7
Spongy cores
8
Unfilled cores
9
Poor surface finish
Cause
Old RPN
S
O
D 3 3 3
New RPN 168 120 108
% Reduction in core rejection 25% 37% 37%
i) Less addition of resin. ii) Expired bench life. i) Sliding plate movement.
192 144 126
8 8 6
7 5 6
ii) Loose piece jam. iii) Core box plate parallelity. i) R / B in sand mix. i) Core box vents chocked. ii) Sealing cord problem. iii) Low air gassing pressure. i) Improper trimming. i) Blower not operating. ii) Cooling system inlet valve opening not proper. i) Less sand shooting pressure. ii) Sealing cord problem. i) Sand shooting nozzle head blocked. ii) Less sand in hopper. i) Paint viscosity not proper. ii) Unclean cores.
90 90 168 108 90 72 72 90 72 84 105 63 63 54 54
6 6 6 6 6 6 4 6 6 7 7 7 7 6 6
4 4 6 5 4 3 5 4 3 3 4 2 2 2 2
3 3 3 3 3 3 3 3 3 3 3 3 3 3 3
72 72 108 90 72 54 60 72 54 63 84 42 42 36 36
34% 15% 39% 55% 34% 22% 47% 12% 51% 25% 10% 82% 46% 78% 23%
7. Conclusion This paper demonstrated the systematic use of empirical data in performing process FMEA. The methodology operated allowed to study and analyze every single step of core making process and to achieve an exhaustive knowledge and improvement of product and process and substantial cost savings can be realized. The improvements obtained by the implementation of the recommended actions thus reduce the individual RPN and the global risk level of the process. Thus reduces costly liability of the core making process that was not performing as promised. FMEA aids to improve and plan preventive and schedule maintenance of the process equipments. Thus improves operational performance of the core making process. Our proposed methodology traces analysis in terms of cost, a widely accepted measure of risk. 8. References [1] [2] [3] [4] [5] [6]
K. Xu, L.C. Tang, S.L. Ho, M.L. Zhu, “Fuzzyassessment of FMEA for engine systems.” Reliability Engineering and system safety, Volume 75, issue 2002, pp 17-29. Kosuke Ishii, & Seung J. Rhee, “Using cost based FMEA to enhance reliability and servieability.”Advanced Engineering Informatics, volume 17, issue 2003, pp. 179-188. Angela Centazzo, Antonio Scipioni, Francesca Arena, Giovanni Saccarola, “FMEA Methodology Design, implementation and integration with HACCP system in a food company.” Food Control, volume 13, issue 2002, pp 495-501. Stamatis D.H., “Failure mode and effect analysis “FMEA from theory to execution”, Productivity press India, 1997, P. 25. Kosuke Ishii, Steven Kmenta , “Scenario-based FMEA: A LIFE CYCLE COST PERSPECTIVE”,2000 ASME Design Engineering Technical Conferences, September 10 – 14, 2000, Baltimore, Maryland. Chrysler/Ford/General Motors Task Force “FMEA Reference Manual” Automobile Industry Action Group, 3 rd Edition,
Acknowledgements The author would like to thank the Ghatge- Patil Industries Ltd. Foundry division for providing the opportunity for this project, and especially to Mr. R.P. Kulkarni, Mr...Shenoy, Mr.B.G.Deshpande, Mr. S.A. Patil for valuable time spent on this project and other core making section staff members who provided us with useful technical information. Dr. Awadhesh Kumar is with the Malaviya National Institute of Tecchnology Jaipur India (phone: +919414457027; fax: +911412529064 e-mail:
[email protected]).
ISSN : 0975-5462
Vol. 3 No. 6 June 2011
5297