Three Methods to Automate the Space Allocation Process in UK Universities E.K. Burke1, P. Cowling1, J.D. Landa Silva1*, Barry McCollum2 1
Automated Scheduling, Optimisation and Planning Research Group School of Computer Science and IT, University of Nottingham, {ekb,pic,jds}@cs.nott.ac.uk http://www.asap.cs.nott.ac.uk/ASAP/ 2 School of Computer Science The Queen’s University of Belfast, UK
[email protected]
Abstract. The space allocation problem within UK universities is highly constrained, has multiple objectives, varies greatly among different institutions, requires frequent modifications and has a direct impact on the functionality of the university. As in every optimisation problem, the application of different advanced search methodologies such as local search, metaheuristics and evolutionary algorithms provide a promising way forward. In this paper we discuss three well-known methods applied to solve the space allocation problem: hill-climbing, simulated annealing and a genetic algorithm. Results and a comprehensive comparison between all three techniques are presented using real test data. Although these algorithms have been extensively studied in different problems, our major objective is to investigate the application of these techniques to the variants of the space allocation problem, comparing advantages and disadvantages to achieve a better understanding of the problem and propose future hybridisation of these and additional methods. Keywords: space allocation, neighbourhood search, metaheuristics.
1 Introduction The space allocation problem in academic institutions is described as the allocation of resources to areas of space such as rooms, satisfying as many requirements and constraints as possible. Resources are staff, students, meeting rooms, lecture rooms, special rooms, etc. Requirements are certain conditions to be fulfilled such as the amount of space needed for each resource. Constraints (see section 2.3) are rules that cannot be violated (hard constraints) or ones that can be broken but penalised (soft constraints). The aims of our research are to carry out a complete and detailed investigation of the space allocation problem, to produce a model of this problem and to propose a set of well studied techniques to find solutions for the different forms of the space allocation problem not only in academic institutions, but also in commercial and industrial areas. Developing hybrid metaheuristic techniques and focusing on initialisation, decomposition and multicriteria decision-making, we expect to provide ___________ *
JDLS acknowledges support from Universidad Autónoma de Chihuahua and PROMEP in México.
fast and high quality solutions to large space allocation problems in universities and other environments. In its simplest form, space allocation can be regarded as a bin packing or knapsack problem [2]. These two optimisation problems are frequently used to describe a wide range of industrial and commercial problems. Finding a new set of metaheuristics to solve the space allocation problem may well benefit these related applications. The space allocation problem is also related to scheduling, which is defined by Wren [19] as “the arrangement of objects into a pattern in time or space in such a way that some goals are achieved, or nearly achieved, and that constraints on the way the objects may be arranged are satisfied, or nearly satisfied”. Research work within the Automated Scheduling, Optimisation and Planning group has demonstrated that the use of hybrid metaheuristic approaches in real applications of scheduling-related problems, offers a significant opportunity of success [4], [5], [6], [9], [10]. Some approaches have been proposed for solving space allocation and space planning problems related to teaching facilities [1], [3], [13], [18]. In [7], the results of a survey on the space allocation problem within UK universities were published. A detailed description of the variety, complexity, characteristics of the problem and available solutions in each institution was obtained. Later, in [8] it was stated that the implementation of metaheuristic methodologies is a promising way to tackle the space allocation problem in universities and that the more highly constrained a real situation is, the less likely it is that we can ensure an acceptable level of space utilisation. In this paper, we summarise the problem domain and define what a good solution is in terms of our evaluation function. Then we discuss the performance of three wellknown techniques applied to the space allocation problem: hill-climbing, simulated annealing and genetic algorithms and present a detailed comparison between these three approaches. Finally, some conclusions are established and future research directions are suggested.
2 Problem Description 2.1 Problem Domain The problem of allocating resources into rooms in UK universities can be summarised as follows: the process of assigning rooms or areas of space for specific resources, ensuring the efficient utilisation of the space and satisfying as many requirements and constraints as possible. Types of rooms considered here are non-residential, i.e. focusing on academic-related space. Resources are considered to be staff, students, laboratories, storage areas, common rooms, lecture theatres, etc. Requirements and constraints vary from one university to another, so for each problem instance different requirements and constraints exist. However, most of those requirements and constraints are considered here as a result of our previous work [7]. Solving real instances of the space allocation problem is a multicriteria decision-making process because to determine the quality of an allocation it is necessary to consider different objectives such as: achieve an efficient space utilisation, maximise the satisfaction of constraints, minimise costs and guarantee people’s satisfaction.
2.2 Phases and Modes of the Process The process of allocating rooms in UK universities can be performed in three stages: 1. The centralised office allocates space to faculties and assigns common areas 2. Faculties assign areas to schools and departments 3. Departments allocate specific rooms to resources During these three phases, the problem can be solved in different ways at each stage: • Fitting all resources into a limited amount of space • Minimising the amount of space required to allocate a set of resources • Reorganising because of the addition or removal of space and/or resources • Reorganising/optimising the current allocation due to the possible variation of requirements and/or constraints 2.3 Types of Constraint Constraints considered so far in the domain of this problem, can be any of the following classes: • Sharing restrictions, e.g. head of department does not share a room • Proximity/adjacency requirements, e.g. secretary must be adjacent to the head of school • Grouping requirements, e.g. people in a research group must be in the same room • Requirements and limits for wastage and overuse of space, e.g. research students require 6m2, but it is acceptable to assign 15% more (6.9m2) or less (5.1m2) space • Requirements for staff sharing between different departments, e.g. a lecturer working for two different departments should share a room • Resource specific location, e.g. network technician must be adjacent to the networking laboratory or in a specific room These constraints are divided into two groups. The first and basic group consists of: space overuse, space wastage, unallocated resources, sharing and grouping restrictions. The second group consists of constraints that are required to be satisfied in each specific case, e.g. technical services coordinator in the School of Computer Science and IT at the University of Nottingham must be in a non shared room in the 2nd floor, adjacent to other members of the technical services group, and all of them should be close to the networking laboratory. Any constraint can be either hard or soft according to the real problem. For example, in some universities it is strongly required that no member of staff shares an office, while in others this requirement is only desirable. Additional constraints can be added as required. 2.4 Fitness Evaluation of an Allocation The allocation of all resources may be a hard constraint (a feasible solution must have all resources allocated) or a soft constraint (some resources may be unallocated but a penalty is applied). A feasible solution must satisfy all the hard constraints in the
specific space allocation problem. The quality of a feasible allocation is measured using the aggregating function (1). This function is a sum of the penalty due to unallocated resources, the penalty due to inefficient space utilisation and the penalty due to unsatisfied soft constraints. If any of these is a hard constraint or requirement in the problem instance, the corresponding penalty in a feasible solution must be equal to zero. The lower the total penalty value, the higher the quality of the allocation. total penalty =
N
M
N
∑ UP ( ri ) + ∑ [WP ( si ) + OP ( si )] + ∑ SCP ( ri ) . i =1 i =1 i =1
(1)
UP is the penalty applied to the resource ri if it has not been allocated, WP is the penalty applied to the room si if there is space wastage, OP is the penalty applied to the room si if there is space overuse, SCP is the penalty applied if there is a soft constraint violation for the resource ri, N is the total number of resources to be allocated in the problem and M is the total number of rooms to be used in the allocation process. We calculate the penalties for violated soft constraints using weights and exponents according to each specific scenario (for our experiments these values are included in the test data sets available in [11]). The penalty for each violated soft constraint is equal to (violation level x weight )exponent, where the violation level is a measure of the soft constraint violation. Suppose we have a space allocation problem in which the allocation of all resources is a soft constraint and a feasible solution has the following constraint violation levels: 6 resources are not allocated, three rooms have space wasted (4.6 m2, 0.6 m2 and 2.7 m2 respectively), one room has space overuse equal to 2.4 m2, 2 sharing restrictions and 5 adjacency constraints are not satisfied. Assume the following values for weights and exponents: Contraint wastage overuse unallocated sharing adjacent to
Weight 2 2 5000 2000 500
Exponent 1 2 1 1 1
For the example described above the total penalty is calculated using (1) as follows: total penalty = (6x5000)1 + ((7.9x2)1 + (2.4x2)2) + ((2x2000)1 + (5x500)1) = 36538.84 The weight is a measure of the impact in the penalty value of the unsatisfied constraints, while the exponent penalises the degree to which the soft constraints are violated.
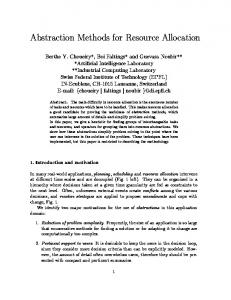
3 Three Methods to Automate Space Allocation 3.1 Neighbourhood Exploration The methods we have implemented to approach the space allocation problem are: hillclimbing, simulated annealing and a genetic algorithm. The three algorithms attempt to find the global optimum in the solution space, but while the first one is well known as a search heuristic that may become stuck in poor local optima, simulated annealing and genetic algorithms attempt to avoid this by performing a wider exploration of the solution space [14], [15], [16], [17]. An allocation is represented using the structure shown in Fig. 1 below. A solution is coded using a string that contains one element for each resource in the problem. Each resource is associated with the room to which the resource has been allocated. If unallocated resources are permitted in a feasible solution, those resources have a bin room associated. If the same room is associated to more than one resource then those resources are sharing the specified room. Lab B
Mr Lee
Store
Director
1B01
1B04
1B08
1B17
Catering Ms Shang 1B10
1B07
Lab A
Mr Khan
bin
1B04
Fig. 1. The structure used to represent an allocation in the space allocation problem.
Three moves are used to modify an allocation and therefore explore the search space: ALLOCATE, RELOCATE and SWAP. The ALLOCATE move selects an unallocated resource and finds a room to allocate to it. The RELOCATE move changes the assigned room for one allocated resource. Finally, the SWAP move selects two rooms and interchanges the allocated resources between them. The construction of an initial solution is done by means of the ALLOCATE move. During the construction of the initial solution and also during the space exploration, the following parameters are used to modify the searching process: resource search, room search, space deviation and termination criteria. In our experiments (see section 4) these parameters were investigated to determine the appropriate neighbourhood exploration in each algorithm. • Resource search. The selection of the resource for the ALLOCATE and RELOCATE moves can be: random or the worst offender. In the first case, the resource to be allocated or relocated is randomly selected from the corresponding list (unallocated or allocated resources). Selecting the worst offender means that the move is evaluated for each resource in the corresponding list and the resource that causes the least penalty is chosen. Obviously, the second option takes more time to select the resource because it performs a wider search attempting to make a better resource selection. • Room search. To select the room for the ALLOCATE and RELOCATE moves, or a pair of rooms for the SWAP move, two options are possible: random or the best of NB rooms. In random selection, we choose at random, one resource (ALLOCATE or RELOCATE moves) or two rooms (SWAP move). In the second
case, NB random rooms (ALLOCATE or RELOCATE moves) or NB random pairs (SWAP move) of rooms are evaluated and the best room or pair of rooms is finally chosen to implement the move. If NB equals the total number of rooms M, then all rooms are tested and the best is used. Random selection permits faster construction and neighbourhood exploration, but the second strategy performs a more thorough search. • Space deviation. When selecting the room for an ALLOCATE or RELOCATE move or the pair of rooms for the SWAP move, it is possible to perform or skip an evaluation of the percentage of space that can be wasted or overused. If this space deviation is not evaluated, the selected room will be used even if it is too big or too small for the selected resource. If this space deviation is evaluated, then the percentage of space wastage or space overuse in the selected room must be within the problem requirements. • Termination criteria. To investigate the performance of the three algorithms, two termination criteria are available: a fixed number of iterations or no improvement in the allocation after a certain number of iterations. 3.2 Hill-Climbing and Simulated Annealing The standard hill-climbing strategy is based on the inspection of the neighbourhood in the solution space, so that by means of moves in the existing solution, progressive improvements can be achieved to reach the local optima. The most important part of this algorithm is the heuristic used to explore the neighbourhood using the three possible moves: ALLOCATE, RELOCATE and SWAP. This strategy is shown below: If all N resources are allocated Select a random move between RELOCATE and SWAP If not all N resources are allocated If NA ≥ MA If last move was ALLOCATE Select a random move between RELOCATE and SWAP If last move was not ALLOCATE Select ALLOCATE move NA ← 0 If NA < MA If last move was not ALLOCATE Select a random move between RELOCATE and SWAP where, N is the total number of resources, NA is the number of failed (i.e. nonimproving) move attempts and is incremented after one move attempt has failed, MA is the maximum number permitted of failed move attempts, and there is an equal probability of choosing either the RELOCATE or the SWAP move. The strategy shown above to select a move, takes into account the current state of the allocation and the viability of accomplishing a certain type of move. In this sense, the type of move that is undertaken in each iteration, depends on the number of
allocated resources and the number of prior failed attempts to find a feasible move. When all resources in the current problem are already allocated, the algorithm explores the neighbourhood using the moves RELOCATE and SWAP to improve the solution. In the case that not all resources are allocated, a certain number of attempts (MA) normally set to N/5, is given to either the ALLOCATE or the RELOCATE and SWAP moves. Our experiments have shown that it is likely to find a move when one-fifth of the number of resources is evaluated for the required move. The heuristic tries to ALLOCATE as many resources as required to produce a feasible solution, but also attempts to avoid getting stuck by examining the RELOCATE and SWAP moves. For example, suppose that in the current solution there are still 5 unallocated resources from a total of 100 in the allocation problem. Then, if after 20 failed attempts none of these resources have been successfully allocated, the algorithm examines the feasibility of modifying the solution using the RELOCATE and SWAP moves up to a maximum of 20 failed attempts. The number of failed modification attempts is set to zero when an improving move has been found. The simulated annealing algorithm is a well-known method where new solutions are accepted during the process with a probability that varies according to a temperature parameter [16], [17]. Our simulated annealing and hill-climbing algorithms use the same heuristic to select the type of move to improve the current solution. The temperature is reduced slowly starting from a random search at high temperature and carrying out pure hill-climbing at zero temperature. The goal of the temperature variation process is to combine random selection with the local search heuristic to find global optima. When the current allocation is improved by trying the moves ALLOCATE, RELOCATE or SWAP, a high temperature corresponds to random movements and other solutions are visited even if their fitness is not better than the current solution. Low temperature corresponds to little randomness and worse solutions are not visited. The temperature is set to a high value when the algorithm starts, then it is decreased after a fixed number of iterations. The parameters used in our simulated annealing algorithm are explained in section 3.4. The acceptance or rejection of the selected move in the current solution is controlled as follows: If the selected move improves the current solution Accept move and new solution Else If current temperature = 0 Reject move and new solution If current temperature > 0 Probability of acceptance = exp( − delta / current temperature ) If probability of acceptance ≥ random number Accept move and new solution Else Reject move and new solution Delta is the fitness variation due to the proposed move and a value greater than zero means an improvement in the existing solution (decrease in the total penalty value).
3.3 Genetic Algorithm The genetic algorithm that was implemented for this problem is shown below, where each chromosome is a possible allocation as shown in Fig. 1. Create Initial Population Calculate Fitness (Initial Population) Current Population = Initial Population while Termination Criteria Not Satisfied For OffspringNo = 0 to OffspringNo = PopulationSize do Parent1 = Roulette_Wheel_Selection (Current Population) Parent2 = Roulette_Wheel_Selection (Current Population) Heuristic_Crossover (Parent1,Parent2,New Population) Mutate Population (New Population) Calculate Fitness (New Population) Replace_Population (Current Population, New Population)
The construction of each individual in the initial population is carried out using the heuristic explained in section 3.2 with the moves ALLOCATE, RELOCATE and SWAP. Our genetic algorithm evaluates the fitness of each solution using the penalty function (1) presented in section 2.4. Using Roulette_Wheel_Selection, two parents are selected from the current population. In the roulette wheel operator, the probability of selecting each individual is proportional to its fitness [12]. Here, the sum of the fitness (Fsum) for all chromosomes is obtained, then a random number n between 0 and Fsum is generated. The first individual whose fitness added to the fitness of the preceding population members, is greater than or equal to n, is selected as a parent. Selected individuals A
B
C
D
E
F
G
H
GB01
1B04
1B08
1B17
Bin
1B07
Bin
1B07
GB01
1B02
1B07
1B08
1B17
1B08
Bin
1B10
A
B
C
D
E
F
G
H
A
B
C
D
E
F
G
H
GB01
1B04
1B08
1B17
1B17
1B08
Bin
1B07
GB01
1B04
1B08
1B08
1B17
1B08
Bin
1B10
A
B
C
D
E
G
H
New individuals
F
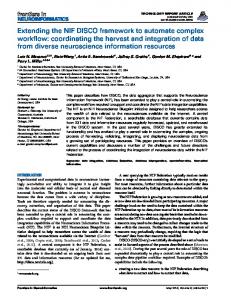
Fig. 2. In the four-point crossover operator, the section in the chromosome with the highest penalty is chosen, so the size of this section varies accordingly.
Our crossover operator works as illustrated in Fig. 2 using the chromosome string representation shown in Fig. 1. This four-point crossover strategy identifies, in each parent, the chromosome section that contains the group of resources (adjacent in the chromosome representation) whose penalty values are the greatest. After detecting these sections, the group of highest penalty in each parent is replaced with the corresponding substring in the other parent. The mutation operator consists of a random change of the assigned room for a randomly selected resource. In Replace_Population, the new population replaces the current population and elitism is applied to guarantee the selection of the fittest individual so that this solution is preserved between generations. Here, elitism consists of substituting the worst individual in the new population with the best individual in the previous generation. 3.4 Selection of Search Parameters Making modifications to the searching parameters described in section 3.1, we obtained the variants of the algorithms shown in Table 1. These twelve variants are different heuristics that were tested to find the set of parameters that produce the best solutions in each type of space allocation problem. Our goal is to investigate the effect of these parameters to design a heuristic for neighbourhood exploration in the space allocation problem. Table 1. Variants of the three algorithms. Parameters for simulated annealing are: initial temperature 2000, decrement value 100 and decrement interval 300. Parameters for the genetic algorithm are: population size 20, crossover probability 80%, mutation probability 5%. NB, the neighbourhood size, is replaced by a number according to each problem instance in the results described in Section 4. Algorithm Algorithms Variants
HC
HCRand
√
SA
Searching Options
GA
Random NB Best Room Room
Space Deviation Check
√
HCRandChk
√
√
HCRandWrst
√
√
HCNBRms
√
HCNBRmsChk
√
SARand
Worst Resource Offender
√ √ √ √
√
√
√
SARandChk
√
√
SARandWrst
√
√
SANBRms
√
SANBRmsChk
√
√ √ √ √
GANBRms
√
GARandWrst
√
√
√ √
√
After examining the performance of each of the 12 variants of algorithms presented in Table 1, the parameters for our algorithms are those that produce the best results in terms of the penalty function (1) described in section 2.4. The values shown for these parameters have been set up according to the problem size in our problem instances. For simulated annealing we found that the best decrement interval size is around twice the number of resources (150 resources in average for these test problems). Decrement value is the best when it is set to 1/10 of delta, the fitness variation after implementing a move in the current solution (delta is in the range of 800 to 1500 on these problems). The initial temperature of 2000 is the value that produced the best fitness in these problems. For the genetic algorithm we tested the range of parameters that are proposed by Goldberg [14], and we found that with a population of about 1/10 of the number of resources, 80% crossover probability and 5% mutation probability we obtain the best results. In the next section we give a description of the five data sets that were used in our experiments. We show how the conditions differ from one problem to another due not only to the fact that each university imposes its own requirements and standards, but also to the different available information to specify the problem and then construct the solution. For example while some universities provide information about space requirements for resources, adjacency and proximity between rooms and constraints to be satisfied, others simply do not use any standard data and the acceptance/rejection of the solution depends only on space utilisation and some vague sharing restrictions.
4 Results 4.1 The Experiments All variants of the three algorithms were tested with different real data obtained from three universities in the UK. As we stated before in section 2.2, space allocation can be applied in four ways. We use two of them that represent real situations in academic institutions: optimisation/reorganisation and construction of a complete allocation. Optimisation is when the existing allocation, with all the resources already allocated, must be improved using the same set of rooms and constraints. Reorganisation means that a subset of the resources (some specific rooms, like laboratories, common rooms or strategic offices) has been previously allocated and then all remaining resources are allocated to construct a solution. A complete allocation refers to the situation where all resources are unallocated, and a solution involving all resources must be found. Each algorithm variation was tested 40 times with all data sets, and then we selected the ones that produced the best results for each case. Since in this paper we attempt to determine an efficient strategy for the neighbourhood exploration, the best performance of each algorithm is compared. The computational times required in our tests are shown as a reference to compare them with the time taken to construct a manual solution (weeks or months). A manual solution is constructed by the space officers and varies from university to university [7]. The best solutions shown in tables 2 to 6 were selected according to the total penalty value obtained using a PC Pentium 300MHZ with 64MB RAM. In all tables, the last column shows the total penalty for the manually constructed allocation as implemented in each case. We present the
solutions in tables to facilitate the analysis of the algorithms’ performance not only according to total penalty but also for each different evaluation criteria (space utilisation, unallocated resources penalty and soft constraints penalty). 4.2 The University of Nottingham Data The School of Computer Science and IT recently moved to a new building, so it was necessary to obtain a new allocation. There are 90 rooms of different sizes and 117 resources distributed according to their level, indicating sharing and space requirements: 6 professors, 9 laboratories, 9 meeting rooms, 10 technical staff, 5 storage rooms, 1 teaching assistant, 3 senior lecturers, 7 secretaries, 47 researchers, 19 lecturers and 1 visiting lecturer. For these problems we have the 5 basic constraints, 8 specific groups of people, 30 specific resource locations and 8 particular proximity/adjacency requirements. Data sets used are: CSBuildingAllocatedIdeal. This is the real allocation at the Computer Science and IT Building in this university. All 117 allocated resources and 90 rooms are used. The goal is fitness improvement using all constraints specified by the problem, i.e. an optimisation problem. Results obtained for this case are shown in table 2 compared with the real allocation. Table 2. Results for optimising the current allocation, University of Nottingham data Fitness Statistics Resources Allocated Rooms Used Space Utilisation Constraints Penalty Space Wastage Penalty Space Overuse Penalty Total Penalty Time taken (h:m:s) Iterations
CSBuldingAllocatedIdeal HC30Rms HCRand SARandWrst SA30Rms GARandWrst
Real Allocation
117
117
117
117
103
117
90
90
90
90
78
90
82.45%
81.56%
81.32%
78.27%
63.69%
77.99%
714.87
1094.93
4221.15
1264.21
71284.91
1264.21
479
487.4
535.9
624.8
859.6
639.8
403.26
1314.51
2225.76
14666.52
8290.07
17400.27
1597.13
2896.84
6982.82
16555.53
80434.48
19304.28
0:29:53
0:19:46
0:23:04
0:14:30
0:45:06
-----
20000
50000
5000
5000
15
-----
CSBuildingReorganiseIdeal. This has 21 allocated resources (laboratories, meeting rooms, storage rooms), 96 resources to be allocated (researchers, secretaries, lecturers, senior lecturers, professors, technical staff, teaching assistants, visiting lecturers) and 21 used rooms. The goal is to reorganise the allocation using all requirements for the problem and focusing on staff accommodation. Table 3 shows results for this data set.
Table 3. Results for reorganising the current allocation, University of Nottingham data Fitness Statistics
CSBuldingReorganiseIdeal HCRandWrst HC30Rms SARandWrst
SA30Rms
GA117Rms Real Allocation
Resources Allocated
117
117
117
117
117
117
Rooms Used
90
90
90
90
90
90
Space Utilisation
79%
79.99%
81.65%
89.16
75.52%
77.99%
Constraints Penalty
8500
13000
13343.146
6500
62083.78
1264.21
Space Wastage Penalty
477.2
464
594.2
476.6
521.1
639.8
Space Overuse Penalty
403.26
99.51
2293.9
404.07
12133.97
17400.27
Total Penalty
9380.45
13563.51
16231.24
7380.67
74738.85
19304.28
Time taken (h:m:s)
0:26:19
0:41:36
0:06:18
0:34:54
3:15:23
-----
5000
20000
1000
20000
13
-----
Iterations
CSBuildingNewIdeal. All 117 resources are to be allocated and all rooms are available. The goal is to fit all resources into the limited amount of space, using all constraints for the problem and studying the impact of allocating all resources in one stage. The current allocation in the CSBuilding has been evaluated with the penalty function and compared with the allocations obtained with the algorithms, as shown in table 4. Table 4. Results for creating a new allocation, University of Nottingham data Fitness Statistics
CSBuldingNewIdeal HCRandWrst HC30Rms SARandWrst
SA30Rms
GA117Rms Real Allocation
Resources Allocated
113
115
116
115
117
117
Rooms Used
86
89
87
90
90
90
Space Utilisation
62.67%
62.98%
70.56
77.65%
60.27%
77.99%
Constraints Penalty
21979.086
32309.801
40526.35
29895.5
53530.54
1264.21
Space Wastage Penalty
1529.4
1354.6
1247.8
1098.4
512
639.8
Space Overuse Penalty
336.41
4617.88
7514.32
11346.32
8573.22
17400.27
43962.48
48309.28
54369.49
52340.22
62615.76
19304.28
0:03:15
0:57:47
0:08:27
0:05:30
2:34:07
-----
1000
50000
5000
10000
11
-----
Total Penalty Time taken (h:m:s) Iterations
4.3 University of Wolverhampton Data The Estates department at the University of Wolverhampton, provided us with information about the SC Building in the Telford University Campus. In this case there are 115 rooms and 115 resources, which are classified in 13 different levels but not all of them with standard defined space, sharing or special requirements. In this university, the Estates department labels each room with a specific use (for example staff working room), then depending on the actual size of the room, its shape, and the resource standard space requirement, the capacity is determined for that room. The types of resources are laboratories, staff working rooms, computer rooms, teaching rooms, store rooms, common rooms, toilets, etc. The interest here is to automate allocation of staff working rooms, teaching rooms, and some specific laboratories or computer rooms, and to improve the distribution of these resources. We have a set of 8 constraints, the 5 basic ones and 3 that specify grouping requirements. An important note is that there is no available information about proximity/adjacency between rooms. This condition gives us the opportunity to evaluate the algorithm’s performance with missing information. WolverhamptonReorganiseIdeal. There are 71 allocated resources (special purpose rooms like laboratories, computer rooms, store rooms, common rooms, toilets, etc.), 44 resources to be allocated (staff working rooms, teaching rooms, some specific laboratories or computer rooms) and 71 used rooms. The goal is to fit all resources into the available space, using specified requirements for the problem and focusing on academic related room’s accommodation. Table 5 shows results for this case and as with the previous data set, the current allocation in the SC Building at the University of Wolverhampton has been evaluated with the penalty function and compared with the allocations obtained with the three algorithms. Table 5. Results for reorganising the current allocation, University of Wolverhampton data Fitness Statistics
WolverhamptonReorganiseIdeal HC30Rms
HCRand
SARandChk
SA20Rms
Resources Allocated
GA117Rms Real Allocation
115
113
114
114
115
115
Rooms Used
96
102
103
100
114
115
Space Utilisation
65.34%
58.21%
64.52%
61.54%
65.34%
65.33%
Constraints Penalty
6171.316
11297.45
51726.85
11384.28
15915.08
16044.82
Space Wastage Penalty
1959.994
2369.063
2083.78
2419.06
2218.15
2407.37
Space Overuse Penalty
0
1815.066
6349.94
212.95
0
0
Total Penalty
8359.67
25824.67
65541.09
19268.68
18133.23
18452.20
Time taken (h:m:s)
0:14:07
0:01:16
0:01:00
0:02:10
0:56:42
-----
Iterations
10000
20000
50000
10000
12
-----
4.4 Nottingham Trent University Data This data set is the one with the least information available about requirements for each different resource level, and there is no information available about proximity/adjacency between rooms. Initially, the University did not specify standard sharing, space or grouping requirements. We have 151 resources classified in 7 levels, 74 rooms and the basic constraints. There are 32 administrative assistants, 7 administrators, 9 coordinators, 81 lecturers, 7 managers, 6 professors and 9 technicians. After defining some space requirements and evaluating the actual allocation, the goal here is to improve it using our heuristics. TrentAllocatedBasic. This is the real allocation at the Chaucer Building in Nottingham Trent University. All 151 allocated resources and 74 rooms are used. The goal is optimisation using only the basic constraints for this problem. Table 6. Results for optimising the current allocation, Trent University data Fitness Statistics
TrentAllocatedBasic HCRand HC20Rms
SARand
SA20RmsChk
GARandWrst
Real Allocation
Resources Allocated
151
151
151
151
95
151
Rooms Used
74
74
74
74
64
74
Space Utilisation
80.6%
80.6%
80.6%
80.6%
65.65%
75.36%
Constraints Penalty
0
0
0
4000
324800
58000
Space Wastage Penalty
573
573
573
573.4
3467.78
727.88
Space Overuse Penalty
0
0
0
0.015
68768.30
220738.90
Total Penalty
573
573
573
4573.41
397036.08
279466.75
Time taken (h:m:s)
0:01:59
0:00:24
0:05:43
0:12:59
1:47:12
-----
Iterations
50000
5000
10000
20000
15
-----
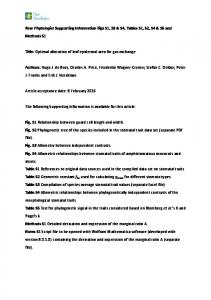
4.5 Selection of the Search Strategy For tables 2 to 6 presented in the last sections, we selected the best options for each algorithm using the information obtained from graphs like the ones in figures 3 to 7. In the graphs we indicate the best performance obtained by the selected variants of the hill-climbing algorithm included in the tables 2 to 6. We observe that hill-climbing variants produce the best results when applied to optimisation problems (Fig. 3 and Fig. 7), i.e. when there is an existing allocation and it should be improved. In these cases (CSBuildingAllocatedIdeal and TrentAllocatedBasic problems) all variants obtain substantial improvement over the real allocation. We observe from Fig. 3 and Fig. 7 that the variants HCRandChk, HCNBRmsChk and HCRand provide poor solutions in the first iterations, but find considerable improvement after 5000
iterations, while the variants HCRandWrst and HCNBRms produce high quality solutions even with just a few iterations. This means that all our hill-climbing heuristics effectively take an existing allocation provided by the user and find good local optima, obtaining a substantial improvement measured with the penalty function (1) described in section 2.4. 20000 18000 16000 14000
1597.13
12000 10000 8000
2896.84
6000 4000 2000 0 250
1000
5000
10000
20000
50000 Iterations
HCRand
HCRandChk
HC30Rms
HC30RmsChk
HCRandWrst
Real Allocation
Fig. 3. Hill-Climbing variants for the CSBuildingAllocateIdeal data set. 350000 300000 250000 200000
13563.51
150000 100000
9380.45
50000 0 250
1000
5000
10000
20000
50000
Iterations
HCRand
HCRandChk
HC30Rms
HC30RmsChk
HCRandWrst
Real Allocation
Fig. 4. Hill-Climbing variants for the CSBuildingReorganiseIdeal data set.
On the other hand, when our hill-climbing is applied to reorganisation problems (CSBuildingReorganiseIdeal and WolverhamptonReorganiseIdeal), three variants produce competitive results. This can be noted in Fig. 4 and Fig. 6, where the variants HCRandChk and HCNBRmsChk offer poor solutions compared with the existing one. HCRand again produces low quality solutions at the beginning, but after 5000 iterations, the allocation obtained is highly competitive. Here, HCNBRms and HCRandWrst are the best options since both are equal to or even improve the current solution in the first iterations. 460000 410000 360000 310000 260000 210000
43962.48
160000
48309.28
110000 60000 10000 250
1000
5000
10000
20000
50000
Iterations
HCRand
HCRandChk
HC30Rms
HC30RmsChk
HCRandWrst
Real Allocation
Fig. 5. Hill-Climbing variants for the CSBuildingNewIdeal data set.
185000 165000 145000 125000 105000
8359.67
85000 65000 45000
25824.67
25000 5000 250
1000
5000
10000
20000
50000
Iterations
HCRand
HCRandChk
HC30Rms
HC30RmsChk
HCRandWrst
Real Allocation
Fig. 6. Hill-Climbing variants for the WolverhamptonReorganiseIdeal data set.
If our hill-climbing heuristics are applied to construct a completely new solution (CSBuildingNewIdeal) then none of the variants produce a better solution than the solution generated by a human expert measured with the penalty function described in section 2.4. In Fig. 5 we observe that HCRandChk and HCNBRmsChk offer their best performance after 5000 iterations but the solutions produced have low fitness (high total penalty value). If HCRand after 5000 iterations together with HCRandWrst and HCNBRms are compared with the existing solution, then we can say that these variants produce allocations with a total penalty that is slightly greater. If we also consider that the existing solution was constructed by the experts using all their knowledge and that this allocation is the best one using the traditional and non automated method, then allocations provided here by hill-climbing achieve a reasonable quality. In all test problems, the variants of the hill-climbing algorithm that produce the best results are HCNBRms and HCRandWrst. The HCRand variant offers an interesting option while HCRandChk and HCNBRmsChk are the worst of all. Note that in these graphs, comparison has been made using only the total penalty of an allocation, but there are several aspects to consider before establishing final conclusions about our heuristic’s performance. Further analysis with information from the best variants of the three algorithms and additional fitness measures is presented in section 4.6 using tables 2 to 6. Similar analyses were achieved for simulated annealing and genetic algorithm variants, but as we stated before, only the best results are presented here in section 4. In the next section we analyse the searching strategy and the performance of our implemented algorithms for the space allocation problem. 300000 275000 250000 225000 200000 175000 150000 125000 100000 75000 50000 25000 0 250
573
1000
5000
10000
573
20000
50000
Iterations
HCRand
HCRandChk
HC20Rms
HC20RmsChk
HCRandWrst
Real Allocation
Fig. 7. Hill-Climbing variants for the TrentAllocateBasic data set.
4.6 Discussion on the Algorithms’ Performance We observe from tables 2 to 6 that the best results in terms of the allocation quality measured with the aggregating penalty function (1) are produced by the hill-climbing variants (we are comparing our variants of these algorithms on the space allocation problem but there are other successful implementations of these three algorithms [16], [17]). The simulated annealing variants produce good results when the problem is not highly constrained (TrentAllocatedBasic). The genetic algorithm implemented here did not produce improvements over the current allocation. Both hill-climbing and simulated annealing strategies, reach the goal of improving an existing allocation. When reorganising an allocation, hill-climbing and simulated annealing variants obtain the best results, as can be noted in tables 3 and 5. Our genetic algorithm has a good performance in reorganising problems (WolverhamptonReorganiseBasic) if there are only basic constraints. An important observation here is that in reorganising problems (CSBuildingReorganiseIdeal and WolverhamptonReorganiseBasic) where the allocation process is centred on the staff and certain specific and conflicting rooms were allocated previously, both hill-climbing and simulated annealing are capable of allocating all resources and improving the manual solution, i.e. these algorithms find a locally optimal solution that is better that the manual solution (here the quality of solutions is measured with the penalty function described in section 2.4). Our genetic algorithm performs better (allocates all resources) in the situation in which the initial population is originated from a partially constructed allocation. In table 4 we observe that if the problem is to construct a completely new allocation for all resources, none of our algorithms produced a better solution than the manual approach. The hill-climbing and simulated annealing strategies constructed allocations that correspond to local optima, which do not match the quality of the manual solution. For example, HCRandWrst produced solutions with 4 unallocated resources and SA30Rms obtained allocations with 2 unallocated resources. In the same case, our genetic algorithm produced a set of solutions which have a competitive quality compared with hill-climbing and simulated annealing, but neither provided a better solution than the one obtained manually. This genetic algorithm performs well for this type of problem compared to the optimisation and reorganisation cases, because the algorithm constructs all individuals from scratch and is then capable of accomplishing a wide exploration of the solution space. In all variants of our algorithms, a completely random searching strategy can be seen as one that uses only random selection of rooms and resources without any space deviation check. A steepest descent searching strategy would be one that always selects the pair resource/room that provides the highest improvement in the current solution. We observe from tables 2 to 6 and figures 3 to 7 that the three algorithms achieve the best performance when the searching strategy is partially heuristically directed (i.e. a random selection of the resource with NB rooms evaluated) and space deviation checking is not performed.
5 Conclusions The problems that space managers face most often are the reorganisation and optimisation of the current allocation. The time required for constructing an allocation varies from weeks to months [7]. Our heuristics offer a promising alternative to automate the space allocation process in a shorter time. From the approaches investigated so far, hill-climbing appears to be the best for optimisation problems, using the strategy of selecting the best among NB rooms in the neighbourhood exploration heuristic. For reorganising situations, both simulated annealing and hillclimbing strategies produce their best performance using the strategy of selecting the best among NB rooms. The reason why these strategies have a good performance in optimising and reorganising problems might be that the most conflicting resources are already allocated and that the improvement of these solutions can then be accomplished using these local search strategies. In constructing a complete allocation, our hill-climbing and simulated annealing variants construct good solutions but do not match the quality of the manually constructed allocation. Constructing a completely new allocation is not a frequently needed task, but the experts spend days, even months, on it, while our heuristics produce competitive initial solutions in minutes or hours. The implemented genetic algorithm is capable of producing acceptable results in terms of time when constructing complete allocations. It produces a set of solutions that can be improved using a local search heuristic. We observe that the neighbourhood exploration in these problems produces the best results using our algorithms when: a random selection of the resource is performed, NB rooms are evaluated and the best of them is chosen and no space deviation checking is done. One future research direction is to modify the neighbourhood search heuristic to construct a completely new solution allocating the most conflicting resources at the beginning of the process. It is also important to investigate the hybridisation of genetic algorithms and local search operators in order to produce a robust solution. The effect of the evaluation method to establish the quality of an allocation will also be considered in future research work. This paper shows that the space allocation process in UK universities can effectively be developed in a better way using the algorithms presented. We have studied how some modifications to three well known approaches can be used to tackle the different instances of the space allocation problem within universities, helping us to construct both a comprehensive model for the problem and a well studied set of techniques to solve it.
References 1. 2. 3. 4.
Benjamin C., Ehie I., Omurtag Y., Planning Facilities at the University of Missoury-Rolla, Journal of Interfaces, Vol. 22, No. 4, pp. 95-105, 1992. Baase S., Computer Algorithms Introduction to Design and Analysis, 2nd ed. Addison Wesley, 1988. Bland J.A., Space-Planning By Ant Colony Optimisation, International Journal Of Computer Applications In Technology, Vol.12, No.6, pp. 320-328, 1999. Burke E.K., Newall J.P., Weare R.F., A Memetic Algorithm for University Exam Timetabling, Selected Papers from PATAT ’95 Conference, Edinburgh, Scotland, Lecture Notes in Computer Science, Springer-Verlag, Vol. 1153, pp. 241-250, 1996.
5.
6. 7. 8. 9. 10. 11. 12. 13. 14. 15. 16. 17. 18. 19.
Burke E.K., Clark J.A., Smith A.J., Four Methods for Maintenance Scheduling, Proceedings of the 3rd International Conference on Artificial Neural Networks and Genetic Algorithms, University of East Anglia, Norwich, UK, Springer, Vol. 1, pp. 264269, 1997. Burke E.K., Smith A.J., A Memetic Algorithm for the Maintenance Scheduling Problem, Proceedings of the ICONIP'97 Conference, Dunedin, New Zealand, Springer, pp. 469474, 1997. Burke E.K., Varley D.B., Space Allocation: An Analysis of Higher Education Requirements, Selected papers from the PATAT ’97 Conference, Toronto, Canada, Lecture Notes in Computer Science, Springer-Verlag, Vol. 1408, pp. 20-33, 1998. Burke E.K., Varley D.B., Automating Space Allocation in Higher Education, Proceedings of the 2nd Asia Pacific Conference on Simulated Evolution and Learning, Camberra, Australia, pp. 66-73, 1998. Burke E.K., Smith A.J., A Memetic Algorithm to Schedule Planned Grid Maintenance, Proceedings of the International Conference on Computational Intelligence for Modelling Control and Automation, Vienna, pp. 122-127, 1999. Burke E.K., Newall J.P., A Multi-Stage Evolutionary Algorithm for the Timetable Problem, IEEE Transactions on Evolutionary Computation, Vol. 3.1, pp. 1085-1092, 1999. Burke E.K., Landa Silva J.D., The Space Allocation System – Test Data, [Online], Available: www.asap.cs.nott.ac.uk/ASAP/space/spacedata.html [2001, March 1st]. Coley D.A., An introduction to Genetic Algorithms for Scientists and Engineers, pp. 2334, World Scientific Publishing, 1999. Giannikos J., El-Darzi E., Lees P., An Integer Goal Programming Model to Allocate Offices to Staff in an Academic Institution, Journal of the Operational Research Society, Vol. 46, No. 6, pp. 713-720, 1995. Goldberg D.E., Genetic Algorithms in Search, Optimisation and Machine Learning, Addison-Wesley, 1989. Man K.F., Tang K.S., Kwong S., Genetic Algorithms, Springer, 1999. Osman I.H., Kelly J.P., Meta-Heuristics: Theory & Applications, Kluwer Academic Publishers, 1996. Rayward-Smith V.J., Osman I.H., Reeves C.R., Smith G.D., Modern Heuristic Search Methods, Wiley, 1999. Ritzman L., Bradford J., Jacobs R., A Multiple Objective Approach to Space Planning for Academic Facilities, Journal of Management Science, Vol. 25, No. 9, pp. 895-906, 1980. Wren A., Scheduling, Timetabling and Rostering, a Special Relationship?, Selected Papers from PATAT ’95 Conference, Edinburgh, Scotland, Lecture Notes in Computer Science, Springer-Verlag, Vol. 1153, pp. 46-75, 1996.