Hardware-Software Debugging Techniques for Reconfigurable Systems-on-Chip G. Talavera1, V. Nollet2, J-Y Mignolet2, D. Verkest2,3,4, S. Vernalde2, R. Lauwereins2 and J. Carrabina1 Email:
[email protected] Department of Computer Science, Universitat Autonoma de Barcelona, Spain 2 Interuniversity MicroElectronics Center (IMEC), Leuven, Belgium 3 Department of Electrical Engineering, Katholieke Universiteit Leuven, Belgium 4 Department of Electrical Engineering, Vrije Universiteit Brussel, Belgium 1
Abstract— In complex reconfigurable Systems on Chip, the dynamism of targeted applications requires an efficient management of platforms. To enable runtime resource management, operating system and reconfigurable SoC platform should be developed together. In this context, additionally to the issues inherent to hardware and software design development, we have to deal with the supplementary difficulty of the interaction between software and hardware, and of both with the platform. In this paper we present a real-time debugging tool operating in a mixed hardware and software environment. This dynamically loadable tool seriously decreases the time required for debugging while the overhead in terms of additional code is minimal.
Key Words: Debugging, System-on-Chip, Real Time, Reconfigurable Hardware.
1 Introduction Nowadays multimedia applications are emerging on portable devices like Personal Digital Assistant (PDA) or a mobile phone. Examples of those applications are web browsers, MP3 and MPEG players. Portable multimedia devices require both dedicated hardware that can achieve the requirements of calculation and the flexibility of software. The use of an embedded Instruction Set Processor (ISP) and reconfigurable hardware (FPGA) provides a good combination between flexibility and performance [1]. In the context where reconfigurable hardware and software coexist, testing and debugging represents a significant amount of development time, resources and cost [6]. Debugging is mostly dependent on the designer’s experience. To remove a bug from the code, first the designer has to detect the malfunction or the erroneous behaviour and to classify the error, then detect the location of the error in the code and finally modify the code to correct it. Often, this process is an iterative trial and error
process in which solving a bug can uncover new bugs in the code. Moreover, co-designing embedded hardware and software has other problems. Even if the development of applications in some stages can be realized on different hosts machines, the dependence between software, hardware and the host platform requires that the final code has to be tested on the target platform. Executing code on the real platform helps to unveils problems related to the real interaction between hardware and software of the platform. These problems do not necessarily appear in the simulation environment, which means they are harder to diagnose and to solve. The single and most important purpose of a debug tool should be the separation of hardware and software development to allow designers to easy find where the problem comes from.
2 Scenario and platform Future SoC architectures will contain one or more microprocessors, ASICs and reconfigurable hardware. We want to achieve multitasking on both the microprocessors and the reconfigurable hardware. The key problem is to find suitable reconfigurable hardware that allows us to run multiple tasks in parallel. To run independent tasks in parallel on one piece of reconfigurable hardware, we have to be able to instantiate and delete certain tasks without affecting the others. 2.1 Reconfigurable Hardware Today's FPGAs, like Xilinx Virtex II family, enables reconfiguration of only a part of the reconfigurable fabric while other parts continue to execute. This way, different tasks of an application, or several independent applications, can be mapped to the reconfigurable hardware in sharing fashion exploiting the parallel processing potential. From an application point of view, partial reconfiguration allows it to change portions of its functionality without
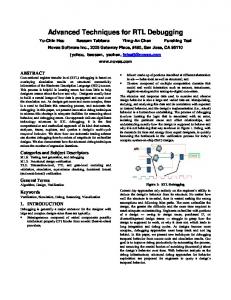
halting the entire application or without requiring extra hardware functionality (i.e. chip area). 2.2 Platform Our prototype platform is composed of a Compaq iPaqTM PDA running RTAI Linux on its StrongArm processor SA- 1110 (206MHz) and a board containing a Xilinx Virtex IITM XC2V6000 FPGA. The iPaq and the FPGA board are connected via the Expansion Bus of the iPaq. Moreover, the whole system is connected to a PC through the serial port of the iPaq. 2.3 Communication architecture To avoid complete place and route for each new reconfiguration, which can require a considerable amount of time, an additional layer with a fixed interface topology is created (Figure 1). In this coarse-grain architecture, each one of those prepartionned areas is denoted as tile and can be configured separately. A fixed communication network between the tiles allows them to communicate together and with the microprocessors [4]. This separation between communication and computation enables an easy and flexible instantiation of new blocks of functionality in the system.
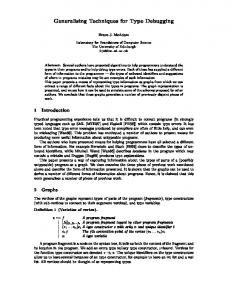
existing one is deleted, some of the present tasks might be rescheduled on other resources to provide the needed computational power or to decrease the power consumption. Applied to our architecture, the task creation and deletion consists in the usual task handling in case of a software task, and in partially reconfiguring the FPGA in case of a hardware task. The operating system should however keep track of the available resources, meaning location of all the tasks running (e.g. which tile of the FPGA). Task rescheduling, from hardware to software or vice versa, is more complex. The main problem is to identify state equivalence between a software task and a hardware task. Indeed, when a task is rescheduled from hardware to software or vice-versa, the state information should be transferred in order to resume the task where it has stopped. The operating system should also handle the communication between the tasks. As shown in Figure 2, three possible cases are envisaged, namely communication between: - Two hardware tasks - Two software tasks - A hardware task and a software task The communication scheme selected is message passing. The interconnection network handles the communication between hardware tasks. The operating system updates at run-time the routing tables of the tasks, and the network drives the messages to the correct destination. When a hardware task wants to communicate with a software task or vice versa, the messages are sent to a special tile, the interface tile, where the messages between the microprocessor and the FPGA are stored in buffers.
Fig 1: The topology of the coarse grain architecture This partitioning increases flexibility for managing the reconfigurable area and enables real multitasking. This way, every tile is capable of running a hardware task which is equivalent to a software thread. 2.4 The operating system In order to handle real hardware software multitasking on this platform, a Linux-based real time operating system for reconfigurable systems (OS4RS) was developed. This operating system is responsible for managing the different applications running on the platform. Each application contains a combination of tasks that can run on the available resources. When a new task is started, or an
Fig 2: HW-SW communication For software-software communication, the same scheme (message passing) is used in order to have a unified representation of the communication between tasks, no matter where the tasks are located. In order to guarantee some quality of service (QoS) in the system, real-time services should be provided by the operating system. The communication will indeed generate interrupts that should be handled fast enough (especially in the case of multimedia streams).
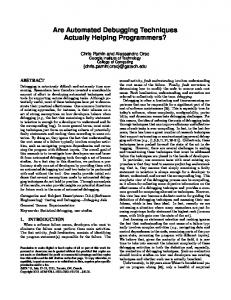
3 Software debugging techniques 3.1 The debug module A typical Real-Time Linux operating system is an operating system extension located between the operating system and the hardware, creating an environment where Linux can continue working with its applications. The RTOS in our platform is an open source real time operating (RTAI) system with another real time extension to adapt the code to our necessities. The developed debug module is another real time module that is inserted, if required, between the two real time extensions, the RTAI extension, and “our extension” as we can see in Fig. 3. The debug module is loadable at run time, provides some main functionalities and a common debug function. This function is based on the standard rt_printk function, but providing extra features in an automatic way like an adjustable debug level, thread, line, function and file information.
T1 RT1
RT2
T2 T3
Linux kernel
RT3
“IMEC “RT extension” RT
I/ I/O
Debu Debug Direct HW acces
RT extension I/O
HW Fig 3: The real time operating system During the development of the code, designers should add to their code some debug sentences with a debug level parameter. For example: dbg(3,"Sending a message on port %d\n", port_id); By adding at design time the debug level parameter, 3 in the example, and by checking at run-time this value against the desired level of debug that should be shown, it is possible to show debug in a selectable way. The debug information is independently selectable by function, source file or thread, which means that all the debug info from a certain function, source file or thread can be displayed. There is no limitation in the number of elements that can be debugged at same time. To have common criteria, a range of debug levels is proposed in Table I. This way of error detection is based on the print function and it is the first impulse that almost all development designers have but often more functionalities are required. Frequently it is useful to change at run time one or more functions adding new functionalities for a certain moment, like, for example, to store in a file for later data analysis the messages send by the applications.
Table I: debug levels Level Action 0 it is the level by default an executing the debug with level 0 the applications run normally and nothing is displayed 1 shows when the Linux real time modules are loaded or removed 2 free use for the designer 3 entrances and exits of functions 4 free use for the designer 5 entrances and exits of functions with the associated parameters 6 free use for the designer 7 free use for the designer 8 free use for the designer 9 shows everything, step by step The debug module stores the pointers of the original function send_message() and the new debug function send_message_dbg(). At run time we can interchange pointers and have the original behavior or the modified one. This way of debugging is more efficient than the previous one because we can add selectively the debug or new functionalities without having all overheads of all the debug statements and comparisons. The same procedure can be used to do regression testing. The idea is that whenever the system fails after some important change has been made, the application programming interface (API) programmers can change from the old to the new functions one by one and detect which one of these new functions is responsible for the system failure. Although the main objective here is to help the API designers, this functionality can be extended to test any change to any other function. 3.2 Implementation The “print” feature of the debug module is easily implemented by adding three independent lists, one for the functions, one for the threads, and the last one for the files. When invoked at run time, the debug module adds or removes the specified feature in the pertinent list. If some entity (e.g. function, thread, etc.) is selected for debugging, the debug module will enter in the debug procedure, comparing the actual running thread, the file and the function where the thread is passing through, with the names inserted in the lists. If there is a match, the debug information will be displayed, the comparison will be stopped and the normal execution will resume. To enable the run time changeability of functions, there is a file in which all these functions, which can be loaded or not, are stored. This file, functions_to_debug.c, is linked together with the main debug module debug.c and the debug.h creating the module file dbg.o, which is the real time module that we will insert into the platform. The separation of the debug in these two “c” files
(“debug.c” and “functions_to_debug.c”) is useful because it separates all the debug code and the selectable functions to load or remove at run time. Thus, to add a new function, we do not need to know the code of the debug module, but just follow a simple methodology. This feature of the debug is compatible with the print based feature, and in the new loadable functions we can also add debug sentences which also allow us to have more instant information on the display console. Once the function is inserted for the first time, no additional changes should be done, and any designer can change the function if required.
4 Hardware debugging techniques Multimedia applications exchange a high volume of messages and are non deterministic in nature. Hence, it is not practical to simulate a complete application execution in a reasonable amount of time. Since the application cannot be simulated, a logic analyzer can be used to monitor, on chip, the application. However, a logic analyzer operates at the physical level thus providing an enormous amount of information. The ideal solution is to work at a higher level of abstraction and record only the behavior of the application, not the operation of the underlying infrastructure. The following on-chip hardware debugger, further denoted as sniffer, is the solution we adopt to provide a tool for debugging hardware errors in the application. 4.1 The sniffer A sniffer is a network monitor tool that captures data packets and decodes them using built-in knowledge of the protocols. The sniffer allows us to visualize the messages sent over the network inside the FPGA. This option, combined with all the hardware development tools and procedures is enough to detect if hardware processes are receiving and sending the packets expected. A unique logical identifier is assigned to every task, independent of its execution location (i.e. hardware or software). Whenever the OS4RS schedules a task in hardware, an address translation table is updated. This logical address allows the operating system to translate a logical address into a physical address and vice versa [3][5]. The communication between a software task and a task running in the FPGA is passing through the hardware abstraction layer. In this case, a translation between the logical address and the physical address is performed by the operating system. When a hardware task sends a message to another task, the sender sends the message to a logical port, which is logically connected to the receiver. In each tile, a Destination Look up Table (DLT) translates this logical destination with the physical destination on which runs the receiver task.
Each time a new task is placed, removed or rescheduled, the operating system is in charge of changing these DLTs to maintain the coherence of communication. The hardware sniffer allows us to choose the tile and port to be sniffed. The sniffer creates a backup of the affected DLT and changes it to force the task to send the message to the operating system.
SW
C
SW
A
Interface
Interface B
D
HW
C
A
message copied!! B
D
HW
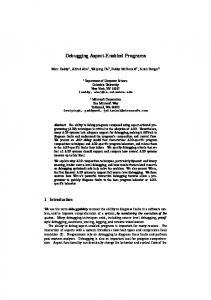
a) b) Fig 4: The communication scheme: a) normal communication, b) “sniffing” messages. By forcing the DLT with a special task identity to send the messages to the operating system, we can copy the messages in a buffer (Figure 4), and after that with the information stored in the backup DLT, send the message to the real destination task. 4.2 Testing the sniffer In order to test the sniffer, we used an in-house developed softcore ISP, further denoted as Lezard16. Two Lezard16 were instantiated in two tiles of the FPGA. The two Lezard16 where programmed to send, receive and forward messages on different ports. This in-house developed softcore is based on the Xilinx PicoBlaze microcontroller. It is a 16-bit microcontroller with an 18-bit instruction word. The Lezard16 instruction set is similar to the one of the PicoBlaze, except that the Lezard16 is not able to handle interrupts. Furthermore, it features a 1024 instruction word deep program memory, as opposed to the 256 instruction words memory of the PicoBlaze. The program memory is implemented as a dual-port memory, allowing the program code to be updated through the second access port. To enable the program code download, we encapsulate the Lezard16 into an ICN tile wrapper. This wrapper filters the data that comes from the interconnection network. Lezard16 configuration data is put into the program memory, while the application data is forwarded to the task running on top of the Lezard16. Implemented on our VIRTEX-II device, the Lezard16 uses 204 slices and the encapsulated version uses 314 slices. As expected, the ports selected to sniff were redirecting the messages to the kernel module that stores the data into a buffer, ready for user examination.
5 Interaction with the debug and the sniffer In Linux there is a mechanism for the kernel and kernel modules to send information to processes: the /proc file system. Originally designed to allow easy access to information about processes, it is now used by every bit of the kernel which has something interesting to report, such as /proc/modules which has the list of inserted modules. The method to use the proc file system is the following: you create a structure with all the information needed for the /proc file, including pointers to any handler functions (in our case there is only one, called when somebody attempts to read from the /proc file). Then, init_module registers the structure with the kernel and cleanup_module unregisters it. The interaction between the user and both the hardware sniffer and the software debugger is done by the /proc file system. When the debug module is loaded or the FPGA wrapper is loaded, an entry to /proc file systems is created and can be used to interact with the module. To make the interaction more easy and transparent to the designer, two interactive scripts have been made, one for each module.
processing due to the comparisons needed to display (or not) the debug messages but this functionality is the first impulse that designers have and the possibility to change the level allows an incremental search for errors without changing the code and recompiling it. Replacing functions at run time does not add unnecessary overhead. The functions are running normally and, when desired, some specific functions are changed to give us different functionalities and the previous ones removed from the execution. These extra functionalities do not need to add more code or slow down the processing. The software debug is now totally integrated in the operating system as another real time module. It can be loaded for debugging during the development process, but once the applications are ready and without errors, it can be removed just compiling all the system with the option “debug=off” in the “make” command. Furthermore, there is a little set of drastic errors which are never going to be removed. The detection of these critical errors is set with another function the rs_error. This rs_error function is considered as a critical error and regardless of the fact that the debug module is loaded or not, the critical error will appear.
6 Results
6.2 Hardware
The proposed methodology includes both software and hardware results so they will be presented separately.
The hardware sniffer is a part of the kernel module that controls the FPGA and it adds 237 (over 1085) lines of C code and 5 kb (over 22 kb) at the module. This implementation does not use hardware resources but increases the communication over the network when changing the Destination Look up Table present in each router and when sending the messages first to the interface tile (thus to the OS) where they are copied and resent to the original destination. A snapshot of the sniffer running under one of the examples mentioned is shown below:
6.1 Software: The actual implementation of the debug module has 782 lines of C code and after compilation occupies 12kb. Adding some external functions to load at run time, the linkage will increase the size of the final object file, depending on the number and size of the additional external functions. A snapshot of the debug module where we are debugging everything with debug level 7 is given in the figure underneath. scheduler.c (run_top_scheduler) (1126): Task 'edge_detect' is CREATED, searching for a processor scheduler.c (find_processor4task) (1176): Finding a processor for task 'edge_detect' (log 1) using policy 0 processor.c (rs_get_proc) (174): Trying to get a processor type 0 processor.c (rs_get_proc) (178): Found it ... processor.c (rs_get_proc) (184): ...and it is available scheduler.c (run_top_scheduler) (1132): Assigning task 'edge_detect' to processor 'StrongARM-1110' Fig 5: A sample output from the debugger module The overhead introduced by this software debug module depends on the way we use it. Adding lots of dbg() statements increases the code size and slows down the
--\/--Last 10 messages from tile: 1 port: 3 to task_id: 2 -\/-msg num:0 0AA0AA0FF0AA00DD000447770000DD00333000CC CCCFF00FF00F0AA0AA0FF0AA00DD000447770000 DD00333000CCCCCFF00FF00F0AA0AA0FF0AA00D D0004 msg num:1 47770000DD00333000CCCCCFF00FF00F0AA0AA0F F0AA00DD000447770000DD00333000CCCCCFF00F F00F0AA0AA0FF0AA00DD000447770000DD003330 00CC Fig 6: A sample output from the sniffer module The sniffer just produces an overhead in the communication when it is working; otherwise the communication is sent from the origin tile to the destination tile directly. Indeed, when the sniffer is
working, there is an overhead because more messages are sent over the network. Appropriate control flow techniques [10] can considerably alleviate this problem minimizing it, even becoming negligible [11].
[7]
7 Conclusion Locating bugs is extremely difficult and time-consuming when many hardware and software designers are working together on a platform. The tools and methodology developed by the authors assist in the design of new applications on the target hardware platform. Since the tools operate on executing applications, bugs can be detected, localized and corrected under real-life operating conditions. Future work will involve adding features to the debug module such as time-stamping, break point insertion and the possibility of changing thread priorities. The sniffer will be modified to operate on a next-generation platform with a new processor combined with FPGA fabric.
References [1] V. Nollet, J-Y. Mignolet, T. A. Bartic, D. Verkest, S. Vernalde, R. Lauwereins: ”Hierarchical Run-Time Reconfiguration Managed by a Operating System for Reconfigurable Systems”. Proceedings of the International Conference on Engineering Reconfigurable Systems and Algorithms 2003, Las Vegas, June 2003 [2] V. Nollet, P. Coene, D.Verkest, S. Vernalde, R. Lauwereins: “Designing an Operating System for a Heterogeneous Reconfigurable SoC”. Proceedings of the RAW'03 workshop, Nice, April 2003 [3] J-Y. Mignolet, V. Nollet, P. Coene, D.Verkest, S. Vernalde, R. Lauwereins: “Infrastructure for Design and Management of Relocatable Tasks in a Heterogeneous Reconfigurable System-on-Chip”. Proceedings of the DATE'03 conference, Munich, March 2003 [4] T. Marescaux, A. Bartic, D. Verkest, S. Vernalde, R. Lauwereins: “Interconnection Networks Enable FineGrain Dynamic Multi-Tasking on FPGAs”. Proceedings of the 12th International Conference on Field-Programmable Logic and Applications, pages 795-805, Montpellier, September 2002 [5] J-Y. Mignolet, S. Vernalde, D. Verkest, R. Lauwereins: “Enabling hardware-software multitasking on a reconfigurable computing platform for networked portable multimedia appliances”. Proceedings of the International Conference on Engineering Reconfigurable Systems and Algorithms 2002, pages 116-122, Las Vegas, June 2002. [6] T. Akgul et al: “A Debugger RTOS for Embedded Systems”. 27th Euromicro Conference 2001: A Net
[8] [9] [10]
Odyssey (euromicro'01) September 04 - 06, 2001. Warsaw, Poland Paul S. Graham: ”Logical Hardware Debuggers for FPGA-based Systems”. (Thesis). A dissertation submitted to the faculty of Brigham Young University in partial fulfillment of the requirements for the degree of Doctor of Philosophy. December 2001. Alessandro Rubini:”Linux Device Drivers”. Ed: O’Reilly, 1998 Ori Pomerantz: “ Linux Kernel Module Programming Guide”. 1999 (Free distribution) J. Duato, S. Yalamanchili, L. Ni: “Interconnection networks, an engineering approach”. September 1997. ISBN 0-8186-7800-3.