Monitoring, Analysis and Modeling of HTTP and HTTPS Requests in a Campus LAN Shriparen Sriskandarajah and Nalin Ranasinghe. Abstract— In this paper we monitored, analysed and modeled Hypertext Transfer Protocol (HTTP) and HTTP Secure (HTTPS) requests generated from a campus Local Area Network (LAN) to various web servers in the Internet. We focused on the parameter TCP session inter-arrival times. The TCP session inter-arrival times are analysed and fitted with standard distributions such as Exponential, Gamma, Lognormal, Weibull and Pareto distributions. With this study we found that for traffic chunks of less than or equal to 30 minutes time period, Gamma distribution provides best fit to the empirical TCP session inter-arrival times of HTTP and HTTPS requests. Keywords— Traffic modelling, TCP session, Inter-arrival time, Gamma distribution, HTTP, HTTPS.
I.
INTRODUCTION
The field of computer networking and today’s Internet trace their beginning back to the early 1960s. Network traffic analysis and developing Mathematical models for network traffic are useful in many fields such as planning the network, optimizing the system configuration, developing new applications, and simulating the network. Basically network traffic models are used in two ways: First a good traffic model leads to a better understanding of the characteristic of the Network traffic. Second to derive an accurate network simulation. In turn these simulations must be performed in order to study and validate algorithms and protocols to be applied to real traffic and to detect network anomalies such as TCP SYN flooding attack. Many organisations and Internet service providers continuously monitor and analyse their network traffic in order to find out the utilization levels on different parts of the network. It includes monitoring user requests and accessing of network resources and observing the network traffic load at various time periods. By identifying congested links and links with low utilization levels, service providers can equalize the traffic pattern, for example by finding out alternative paths, making the network functioning more efficiently. The main contribution of this paper is to monitor, analyse campus LAN traffic and to develop a Mathematical model for TCP session inter-arrival times of HTTP and HTTPS requests generated from the campus LAN to various web servers in the Internet. In this paper a trace driven approach is used to analyse and model the TCP/IP campus LAN traffic, that is, the properties of a campus LAN traffic are obtained via statistical analysis of actual traces. S. Shriparen is with the Computer Unit, University of Jaffna, P.O.Box 57, Thirunelvely, Jaffna, Sri Lanka (phone: +94 77 6172810; fax: +94 21 2222685; e-mail:
[email protected]). N. Ranasinghe is with University of Colombo School of Computing, UCSC Building Complex, No. 35, Reid Avenue, Colombo-7, Sri Lanka. (e-mail:
[email protected]).
The alternative approach is to derive models from the TCP mechanism itself and not on actual traces [1]-[3]. However, the trace driven approach is more realistic as the concomitant effect of user behavior, network protocols and channel conditions are implicitly captured by the TCP/IP traffic traces [4]. A measurement infrastructure is designed and implemented to capture the network traffic traces and to store the trace files. The measurement infrastructure has a monitoring point to monitor all HTTP and HTTPS request generated from the campus LAN to various web servers in the Internet. The network traffic traces are captured using a free and open source packet capture tool. The analysis and model fitting are done using a free and open source software environment for statistical computing and graphics. This paper is organised as follows. Section II describes the related work. Section III provides the method used to monitor and collect traffic traces. In section IV, our modelling methodology is formally stated. Section V presents results and analysis. The paper ends with conclusion and future work in section VI. II.
RELATED WORK
Network traffic can be modeled as sequence of arrivals of discrete entities, such as packets, cells, etc. Mathematically, this leads to the usage of two equivalent representations: counting process and inter-arrival time processes [5]. A counting process {N(t)}t=0..∞ is a continuous-time, integervalued stochastic process, where N(t) expresses the number of arrivals in the time interval (o,t]. An inter-arrival time process is a non-negative random sequence {An}, where An=Tn-Tn-1 indicates the length of the interval separating arrivals of n-1 and n. The two kinds of processes are related through (1). * ( )
+
*
+
{∑
∑
}
( )
In case of compound traffic, arrivals may happen in batches, that is, several arrivals can happen at the same instant T n. This fact can be modeled by using an additional non-negative random sequence {Bn}n=1..∞, where Bn is the cardinality of the nth batch. Mark and Bestavros [6] showed that the subset of network traffic that is due to World Wide Web transfer can show
characteristics that are consistent with self-similarity. Will E. Leland et al. [7] analyzed LAN traffic offered to a high-speed public network supporting LAN interconnection, a B-ISDN service. The main result of their statistical analysis is that the Ethernet LAN traffic shows statistically self-similar behaviour. A research done by Cao et al. [8] addresses the non-stationary of Internet traffic and suggests that the multi-fractal traffic structure evidence at the edges of the network diminishing within the core of the large network. Paxson and Floyd [9] studied telnet traffic and found that the session arrival process is well-modeled with a Poisson process, though with a timevarying rate (e.g. hourly). Arlitt and Williamson [10] found that the user requests for individual web pages are often wellmodeled by Poisson process. Barakat et al. [11] proposed a traffic model for uncongested IP backbone that is different from all the above mentioned traffic models in that it uses any flavor of flow definition to model the variation and the correlation of the traffic. The model relies on Poison shot-noise with only 3 parameters (λ, arrival rate of flows, E[Sn], average size of a flow, and [ S n2 / Dn ] , average value of the ratio of the square of a flow
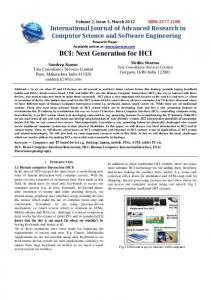
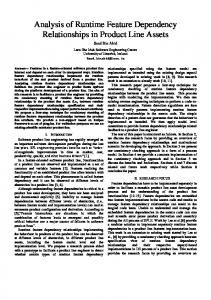
optical fibre VPLS (Virtual Private LAN Service) link. The squid proxy server and other public servers such as mail server and web server are connected to a core switch. A. Network Measurement Infrastructure The entire web request from campus LAN users are directed via a squid proxy server. The proxy server authenticates users using a username and a password and based on the authentication, it allows web accesses and campus network services. It is thus possible to monitor and tap the entire web request in the interconnection link between the proxy server and the core switch. There is a monitoring system running on a workstation to monitor and capture all HTTP and HTTPS requests from the campus LAN to various web servers in the Internet. The traffic traces captured in the monitoring system are transferred to a workstation that is used as the storage. The network measurement infrastructure is illustrated graphically in Fig.1.
size and its duration), the model is able to find good approximations for the average of the total rate (the throughput) on a backbone link and for its variations at short time scale. Feldman [12] showed that the TCP connection arrival process shows self-similar behavior and that TCP connection inter-arrival times are statistically better modeled by distributions with heavy tails especially the Weibull distribution than the traditional models. Nuzman et al. [13] proposed a two level model for TCP connection arrivals in local area networks. The first level is user sessions whose arrival is time-varying Poisson distribution. The second level is connections within a user session. Their number and mean inter-arrival are independent and biPareto distribution across user session. The inter-arrival process within a user session are well modeled by Weibull distribution, and across all users are correlated by Weibull distribution. The analysis done on wireless network traffic by Lee and Abraham, [4] addresses the modeling wireless TCP/IP traffic and shown that conventional distributions are inadequate to model the marginal distributions of wireless TCP flow inter-arrival times. They shown that marginal distribution of flow inter-arrival times is piecewise Weibull distributed. And the second and higher order statistics show that the flow inter-arrival times are long-range dependent and exhibit multi fractal scaling. III.
MONITORING AND COLLECTING TRAFFIC TRACES
The network traffic traces were collected from TCP/IP network that is located at Network Operating Centre (NOC) at the University of Jaffna, Jaffna, Sri Lanka, which Gigabit and 10/100 Ethernet links interconnecting routers, switches and servers. There were approximately 200 users - staff and students - accessing the Internet and campus network services from their LAN connected workstations, personal computers or Laptops. The Internet connectivity is provided by LEARN (Lanka Education and Research Network) which is 10Mbps
Fig. 1: Measurement Infrastructure
B. Network Traffic Monitoring The monitoring system records the traces using tcpdump [14] packet capture tool running on Linux operating system. The tcpdump filter is used to capture only those TCP packets with SYN flag bit is set to 1 in the segment header. When a LAN connected client sends a HTTP or HTTPS request to a server, the client application process informs the client TCP
that it wants to establish a connection to a process in the server. The TCP in the client then proceeds to establish a TCP connection to with the TCP in the server. The client-side TCP first sends a special TCP segment to the server-side TCP. This special segment contains no application-layer data. But one of the flag bits in the segment’s header the SYN bit is set to one [15]. C. Collecting Traffic Traces The primary task of the data collection system is to gather the trace files captured from the monitoring workstation in the monitoring point to a single platform. The traffic trace files are transferred using remote login facility with SSH2 protocol. The captured trace files are transferred to the data collection point after working hours to minimize the effect it has on the monitoring workstation. The summaries of dataset selected for analysis are listed in Table 1. The selected traces were collected on 30th March, 31st March, 1st April and 4th of April 2011. The second column gives the total number of TCP SYN packets received by the kernel for each dataset. Each dataset was then trimmed to span exactly 7 hours from 09:00 to 16:00. TABLE I SUMMARY DATA SET OF HTTP AND HTTPS REQUESTS
Date
No. of TCP Session
Start Time
30-Mar-2011 31-Mar-2011 1-Apr-2011 4-Apr-2011
169,123 178,340 188,923 165,245
8:10 8:57 7:16 8:34
IV.
End Time 17:21 22:21 17:04 17:31
MODELING METHODOLOGY
In this research work to analyse the network traffic and to fit suitable mathematical model for the network traffic, we used the statistical parameter ―TCP session inter-arrival time (IAT)‖ Xi , i = 1, 2, …, N. A new TCP session begins by the arrival of a TCP SYN packet with ACK bit set to 0 at a client host or a unique TCP port pair. A. Definition of TCP session inter-arrival time Assume that within an observation period of 0 < t < T, client i requests for a new TCP session at times ti(1), ti(2), … , ti(N), where Ni is the number of new TCP sessions observed for client i in 0 < t < T. Similarly, client j requests for a new TCP session at times tj(1), tj(2), … , tj(N). The new TCP session times are collected and ordered based on their time occurrence to produce a point process at times, say t(0), t(1), … , t(N), where N is the total number of session in 0 < t < T. The TCP session inter-arrival times are defined as Xi = t(i) – t(i-1) for i = 1, 2, …, N. The TCP session inter-arrival times are analysed by considering following time intervals:
One day traffic- that is, TCP session inter-arrival times of all HTTP and HTTPS requests in working hours in a day between 9:00 to 16:00 10 minutes traffic- that is, split the day data traffic into 10 minutes interval slots such as 9:00 to 9:10, 9:10 to 9:20, …, 15:50 to 16:00 20 minutes traffic- that is, split into 20 minutes interval slots such as 9:00 to 9:20, 9:20 to 9:40, …, 15:40 to16:00 30 minutes traffic- that is, split into 30 minutes interval slots such as 9:00 to 9:30, 9:30 to 10:00, … 15:30 to 16:00, and One hour traffic- that is, split into one hour interval slots such as 9:00 to 10:00, 10:00 to 11:00, ….15:00 to 16:00 The data set split into smaller time periods to perform closer analysis on the data and to reduce the number of observations. The statistical parameter TCP session inter-arrival times are checked whether the dataset best fits with the standard distributions Exponential, Gamma, Lognormal, Weibull and Pareto. The data analysis and model fitting are done using R [16], a package in R, known as ―fitdistrplus‖ is used to select the best fit distribution. The probability density function of the models considered here are listed in Table II. TABLE II PROBABILITY DENSITY FUNCTION OF STANDARD DISTRIBUTIONS
Distribution
Probability Density Function f(x)
Exponential Gamma
( ) ( ) ( )
Lognormal Weibul Pareto
*
√
(
(
)
(
)
+
[ (
) ]
)
A Quantile-Quantile (Q-Q) plot is drawn to compare empirical quantities with the theoretical quantities of a distribution. It is a graphical technique for determining if a data set follows a certain distribution. A 45-degree reference line also plotted. If the empirical data come from the population with the chosen distribution, the points should fall approximately along this reference line. After choosing a model that can mathematically represent our data we estimated the parameters of such model. The method of maximum likelihood is used to estimate the parameters. We used the likelihood function as: L(x1,x2,….,xn,θ) = ∏ ( ) (2)
Maximum likelihood estimate consist in finding θ which maximizes L(x1,x2,….,xn,θ). Goodness of fit test is done to test whether or not it is reasonable that the data follow a specified distribution. The goodness of fit test is defined for the following hypothesis: H0: the data follow specified distribution HA: the data do not follow the specified distribution The P-value is used as a measure of how much evidence we have against the null hypothesis. The null hypothesis, represented by the symbol H0, represents the hypothesis of no change or no effect. The smaller the p-value, the more evidence we have against H0. The Kolmogrov-Smirnov statistics also calculated to decide that the sample comes from a population with a specified distribution. V.
RESULTS AND ANALYSIS
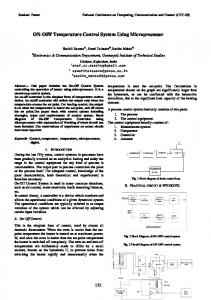
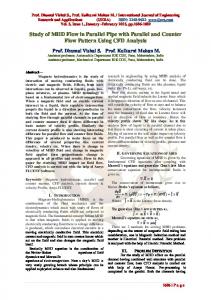
A. One Day Traffic We first considered the TCP session inter-arrival times of all HTTP and HTTPS requests to various web servers. From the captured data set, we selected a trace file captured on 01 April 2011, Friday. The day selected for detail analysis is a working day and it demonstrates smooth overall traffic rate without major anomalies. The selection to focus on working days is obvious, since they contain the most traffic to be analysed. The network is most utilized in working hours, it is observed that between 9:00 A.M. and 04:00 P.M. is the busy hours in the data collected site. The number of observed TCP sessions is 171153. The mean value is 147232.5 micro second and the standard deviation is 224048.5 micro second. Quantile-Quantile plot is drawn (Fig. 3) to compare empirical quantities with the theoretical quantities of Gamma distribution. In this plot on the x-axis we have theoretical quantities got by theoretical model and on y-axis we have empirical quantities. And a 45-degree reference line is also plotted. The Quantile-Quantile plot shows difference on sample quantities from the reference line. So the evidence for the conclusion that the data set does not best fit with Gamma distribution. Similarly, other standard distributions such as Exponential, Lognormal, Weibull and Pareto distributions are examined. As the result data set does not fit with any standard distributions examined. The results are quantitatively confirmed by Kolmogrov-Smirnov statistics given in table III. TABLE III KOLMOGOROV-SMIRNOV STATISTIC FOR EXAMINED DISTRIBUTIONS
Fig. 2: Quantile-Quantile Plot – Fitting Gamma distribution, 01 April 2011 between 09:00 and 16:00
B. 30 Minutes Traffic As explained in section V.A, the analysis results of dataset captured on 01 April 2011 between 09:00 and 16:00 shows that, it does not follow any standard distributions. Even though we are come to the conclusion that the data set does not fit with any standard distributions, we can observe from analysis that the dataset tends to Gamma distribution. So further analysis has been done on fitting Gamma distribution by splitting the data set into smaller time period. This objective is approach by considering shorter time intervals such as 10 minutes, 20 minutes, 30 minutes and 01 hour. As the result 10, 20 and 30 minutes analysis yield best fit to Gamma distribution. When the traffic chunk time interval increased to one hour, the results are not exactly fit to Gamma distribution but tend to Gamma distribution. TABLE IV GAMMA DISTRIBUTION PARAMETER ESTIMATES, 01 APRIL 2011, 30 MINUTES SLOTS
No.
Time Interval
No of TCP session
Gamma Distribution Shape (x10-1)
Rate (x10-6)
KS Statistic
1
09:00-09:30
8438
3.758113
1.761476
0.058719
2
09:30-10:00
13113
5.082886
3.702553
0.045079
3
10:00-10:30
15521
5.594223
4.824160
0.033948
4
10:30-11:00
14550
5.426137
4.385695
0.049834
5
11:00-11:30
14878
5.708368
4.718438
0.035878
6
11:30-12:00
15730
5.054538
4.417177
0.031382
7
12:00-12:30
12082
4.935764
3.313008
0.038197
8
12:30-13:00
6850
3.099620
1.179507
0.105700
9
13:00-13:30
9884
5.045977
2.770296
0.037672
Exponential Gamma
Kolmogorov-Smirnov Statistic 0.137776 0.066567
Lognormal
0.146516
10
13:30-14:00
12532
5.169701
3.600982
0.038511
Weibull Pareto
0.705800 0.400400
11
14:00-14:30
12950
4.995054
3.593001
0.037991
12
14:30-15:00
13170
5.394515
3.946823
0.039192
13
15:00-15:30
10997
5.321038
3.250703
0.037727
14
15:30-16:00
10458
5.365090
3.117544
0.037494
Distribution
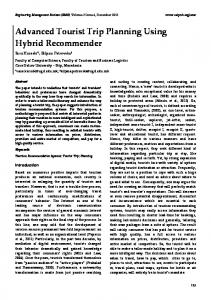
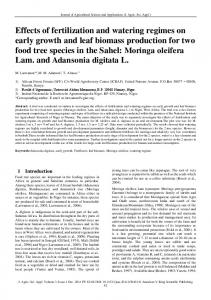
To optimize the number of intervals to be analysed, let us consider each and every 30 minutes interval between 09:00 and 16:00. There are fourteen slots of 30 minutes interval are considered for analysis. The statistic results of TCP session inter-arrival time on 01 April 2011, 30 minutes intervals are given in Table IV. The third column gives the total number of packets received by kernel for each time interval. The forth and fifth column lists the shape and rate parameters of Gamma distribution respectively. The sixth column lists the Kolmogorov-Smirnov (K-S) Statistic for each time interval. One of the slots out of fourteen is taken for further analysis. We have selected the slot between time interval 10:00 and 10:30 as is shows the busiest hour. In the histogram of observed data (Fig. 3) inter-arrival times are split into equal size classes on x-axis and y-axis denotes frequency counts for each classes. Fig. 4 shows the empirical cumulative distribution function on 01 April 2011 between 10:00 and 10:30A.M..
Chi-square goodness of fit test: HO: The data follow Gamma distribution HA: The data do not follow Gamma distribution Calculated P-value is 0.062419 HO is accepted as the P-value is greater than of a significance level fixed at least in 5%. Calculated Kolmogorov-Smirnov (K-S) statistics is 0.033948
Fig 5: Quantile-Quantile Plot – Fitting Gamma distribution, 01 April 2011 between 10:00 and 10:30A.M.
Fig. 3: Histogram of observed data, 01 April 2011 between 10:00 and 10:30 A.M.
Fig 6: Probability-Probability Plot – Fitting Gamma distribution, 01 April 2011 between 10:00 and 10:30A.M.
VI.
Fig. 4: Empirical cumulative distribution function 01 April 2011, between 10:00and 10:30A.M.
By examining the Quantile-Quantile plot shown in Fig. 5 and the Probability-Probability plot shown in Fig. 6, We can come to a conclusion that the dataset best fit to Gamma distribution with parameter estimate, Shape, α = 5.594223 x 10⁻¹ and Rate, λ = 4.824160 x 10⁻⁶
CONCLUSION AND FUTURE WORK
In this research work we have monitored, analysed and mathematically modeled the HTTP and HTTPS requests generated from a campus LAN. The statistical parameter TCP session inter-arrival time was defined and used to analyse and fit with standard distributions Exponential, Gamma, Lognormal, Weibull and Pareto distributions. The data captured in working hours between 9:00 A.M. and 4:00 P.M. in a day was first considered for analysis. This data set did not show good fit with the standard distributions. Even though the data set did not show good fit with the standard distribution, we could observe from analysis that the dataset approximately follow gamma distribution. So further analysis has been done on fitting Gamma distribution by splitting the data set into smaller time period traffic chunks such as 10 minutes, 20 minutes, 30 minutes and one hour. As a result 10, 20 and 30 minutes data best fit to Gamma distribution. When the traffic
chunk time interval increased to one hour, the results are not exactly fit to Gamma distribution but tend to Gamma distribution. We found that, for traffic chunks of less than or equal to 30 minutes time period, Gamma distribution provides best fit to the empirical TCP session inter-arrival times of HTTP and HTTPS requests generated from campus LAN to various web servers in the Internet. This research work can be extended to identify the changes in the fitted distribution when a denial of service attack such as TCP SYN flooding attack created from the campus LAN. Since we are identifying a new TCP session by the arrival of TCP packet with SYN bit set to one, In the SYN flooding attack, the attack generating clients send large number of TCP SYN segments, without completing the handshake step [15]. To achieve this, first simulate a similar network used in this research using one of network simulator. Simulate a SYN flooding attack; capture the network traffic traces during attack simulation time. By using the captured traffic traces identify the changes in the derived distribution. The distributions tested here were chosen to fit to TCP session inter-arrival time curve. The similar research work can be done on TCP session duration time as well. The TCP session duration can be calculated by identifying the arrival of a new TCP session by capturing the TCP packet with SYN flag set to one and the corresponding final packet by capture the TCP packet with FIN flag set to one.
REFERENCES [1]
[2] [3]
[4]
[5] [6]
[7]
[8] [9] [10]
[11] [12] [13] [14]
ACKNOWLEDGEMENTS We are grateful to the administrators from Network Operating Centre of the University of Jaffna for allowing us to access real network traffic traces.
[15] [16]
A. Kumar, Comparative performance analysis of versions of TCP in a local network with lossy links, IEEE/ACM Transactions on Networking , vol.6, No.4, pp 485–498, 1998. A. Abouzeid, S. Roya and M. Azizoglu, Stochastic modeling of TCP over lossy links, IEEE INFOCOM, pp 1724–1733, 2000. M. Rossi, R. Vicenzi and M. Zorzi, Accurate analysis of TCP on channels with memory and finite round-trip delay, IEEE Transactions on Wireless Communications, vol 3, No.2, pp 627–640, 2004. I.W.C. Lee and O.F. Abraham, Analysis and modeling of a campus wireless network TCP/IP traffic, Computer Networks, Vol. 53, No. 15, pp. 2674-2687, 2009. M. Becchi, From Poisson Processes to Self-Similarity: A Survey of Network Traffic Models, 2004. E.C. Marka and A. Bestavros, Self-Similarity in World Wide Web Traffic: Evidence and Possible Causes, IEEE/ACM Transactions on Networking Vol 5, No. 6, 1997. E.W. Leland, S.T. Murad, W. Walter and V.W. Daniel, On the selfsimilar nature of Ethernet Traffic, IEEE/ACM Transaction on Networking. Vol.2, No.1, 1994. J. Cao, W. Clevland, D. Lin and D. Sun, On the Nonstationary of Internet Traffic, Proceeding of ACM SIGMETRICS, 2001. V. Paxson and S. Floyd, Wide Area Traffic: The Failure of Poisson Modeling IEEE/ACM Transactions on Networking Vol 3, No.3, 1995. M. Arlitt and C. Williamson, Internet Web Servers: Workload Characterization and Performance Implications", IEEE/ACM Transactions on Networking, Vol. 5, No. 5, pp. 815-826, 1997. C. Barakat, P. Thiran, G. Iannaccone, C. Diot and P. Owezarski, A Flow-based model for Internet backbone traffic, 2001. A. Feldman, Characteristics of TCP Connection Arrivals, 1998. C.J. Nuzman, I. Saniee, W. Sweldensa and A. Weiss, A Compound Model for TCP Connection Arrival, 2000. S. McCanne, C. Leres, and V. Jacobson, ―Tcpdump‖ http://www.tcpdump.org F. Kurose and W. Ross, Computer Networking – A top down approach, Fifth edition, 2010. http://www.r-project.org