Recent Advances in Computer Science and Applications
1
Image Contrast Enhancement Using Modified Weber‟s Law T. Kalaiselvi, S. Karthigai selvi and S. Boomadevi Abstract--- This paper proposes a method to enrich contrast of poorly lighting images by modifying the Weber’s law. This modification has been done based on the mathematical morphology (MM) theory. Dark image can be enhanced by improving the brightness of the background with various morphological operators. Then the background intensity has been changed by using Weber’s law. The proposed work is applied on several general and magnetic resonance images (MRI). The performance analysis is done on visual inspection and quantitative parameter such as structural similarity index (SSIM) measures and absolute mean brightness error (AMBE). The proposed work is compared with the existing work histogram equalization (HE). The proposed method improves the quality against HE in terms of SSIM as 9% for general images and 17% for MRI images. Keywords— Image enhancement, Weber’s Law, Morphological operators, Image Contrast
D
I.
INTRODUCTION
IGITAL IMAGE enhancement is the process of adjusting intensity value to enrich the visual quality. Especially contrast enhancement increases the visual contrast in images for analysis and further processing [1]. In contrast enhancement, morphological filters plays vital role [2-4]. The other techniques are contrast stretching and histogram equalization (HE). HE method equalizes the histogram between large and small bins and produces over enhancement and saturation artifacts [5]. Some researchers have also focused on improvement of histogram equalization based contrast enhancement such as mean preserving bi-histogram equalization (BBHE) on equal area, dualistic sub-image histogram equalization (DSIHE) and minimum mean brightness error bihistogram equalization (MMBEBHE)[6][7]. Though these methods can perform good contrast enhancement, they
T. Kalaiselvi, Department of Computer Science and Applications, Gandhigram Rural Institute – Deemed University Gandhigram, Tamilnadu – 624302. E-mail: kalaiselvi.gri@ gmail.com S. Karthigai selvi, Department of Computer Science and Applications, Gandhigram Rural Institute – Deemed University Gandhigram, Tamilnadu – 62430. E-mail: karthigachandru@ gmail.com S. Boomadevi, Department of Computer Science, Rama Prabha College of Arts and Science, Dindigul, Tamilnadu – 624001. E-mail:
[email protected]
cause more annoying side effects depending on the variation of gray level distribution in the histogram [8]. Then combination of HE and contrast stretching was implemented to enhance the underwater images [9]. But it is not suitable for some images. Multiscale morphological technique was implemented for the contrast enhancement [10][11]. The other techniques, anisotropic diffusion [12], Fuzzy logic [13], wavelet transformation[14] and genetic algorithms [15] are used for enhancement. Greedy algorithm was used to improve image quality in grayscale and color images by implementing a novel objective function [16]. As a simple technique, Weber‟s law with morphological transform is widely using for background detection and contrast enhancement in images. In this operations, erosion and dilation are applied in Weber‟s law for background detection [17] in grayscale images. In another way, block analysis was implemented to detect the background in poor lighting images and reconstructed by opening operations to enhance the images [18][19][20]. The same procedure was implemented in MRI images to enrich its brightness and contrast value [21], the proposed technique uses the morphological transform and Weber‟s law to enhance the brightness and contrast in general and medical images. This technique reduces the two stage processes (background detection, opening by reconstruction) of Weber‟s law into a single step process. This paper organized as follows, section 2 describes the proposed technique, sections 3 comprises the evaluation on parameters, sections 4 discusses the results obtained by the proposed and HE method and section 5 concluded the results. II.
METHOD
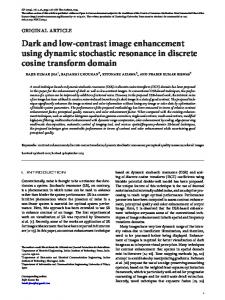
The proposed methods consists of 3 stages as shown Fig.1. In first stage, erosion and dilation are implemented to obtain the background parameters. The resulted image of stage 1 is used to find a threshold value in stage 2. Some intensity changes were made according to the threshold value in stage 3. Stage 1: Morphological Transformation. Stage 2: Threshold value detection Stage 3: Weber‟s Law Applications
ISBN 978-93-84743-57-4 © 2015 Bonfring
Recent Advances in Computer Science and Applications
2
2.1. Morphological Transformation Dilation increases the valleys and enlarges the width of maximum regions. It reduces the dark regions (background). Erosion is used to reduce the regions in the
where K and b are constants in contrast enhancement, on that b is considered as background parameter. K is considered as scaling parameter. The constant K is calculated as follows K
255 τ log256
i
(5)
where i is the mean of high and low gray levels in the image. It is calculated in existing method [2] by using either maximum and minimum intensity or eroded and dilated images. τ
i
m
i
M 2
i
(6)
where Mi and mi are taken as dilated end eroded images in the proposed method.
Figure 1. Flow Chart of Proposed Methods Image and known that it reduces the peaks and enlarges the widths of dark regions. Hence, it can remove positive noises but affect negative impulsive noises little. 2.2. Threshold Detection Weber‟s Law defines contrast and introduces the concept of Just-Noticeable difference [JND]. Weber‟s Law are more sensitive to light intensity changes in low light levels than in high ones [1]. The contrast C of an object with luminance Lmax against its surrounding luminance Lmin is defined as follows [2] [3] [4]. L max L
C
L
if L=Lmin ΔL L max
equ. (1) can be rewritten C
ΔL
min
(1)
min L
min
(2)
(3)
L
It indicates (log L) c. The Weber‟s law can be expressed as follows C KlogL
b
(4)
2.3. Weber’s Law Using background parameter the background pixels were added by the eroded image pixel intensity and foreground pixel intensity is added with the dilated image pixel intensity. The existing work considers log10 for log transformation, but the proposed method only concentrate in the gray scale images only. The gray scale image intensity ranges from 20 and 27. Hence, it uses log2 instead of log10. It is given as follows, T(f
log(f 1) M , f τ kτ i, j i, j i, j i, j i, j ) i, j kτ log(f 1) m , , otherwise i,j i, j i j
(7)
where f represents the image and i,j represent pixel location in the image. M is the dilated image and m is the eroded image. III.
EVALUATION PARAMETERS
3.1. Structural Similarity Index (SSIM) It is a method for measuring the similarity between two images x and y. The SSIM index is a full reference metric, in other words, the measuring of image quality based on an initial uncompressed or distortion-free images as reference. SSIM is designed to improve on traditional methods like peak signal- to- noise ratio (PSNR) and mean squared error (MSE), which have proved to be inconsistent with human eye perception. SSIM
(2 μ x μ y C1)(2 σ xy C2) 2 2 2 2 ( μ x μ y C1)( σ x σ y C3)
ISBN 978-93-84743-57-4 © 2015 Bonfring
(8)
Recent Advances in Computer Science and Applications
3
where µx and µy are mean of original image x, and the contrast enhanced image y respectively, σx2 and σy2 are variance of x and y respectively, σxy is the covariance of x and y. C1 = (k1L)2 and C2 = (k2L)2 are two variables to stabilize the division with weak denominator, L is the dynamic range of the pixel values (typically this is 2 #bits per pixel -1) and k1 = 0.01 and k2 = 0.03 by default values. The SSIM values lies between 0 and 1. In the result of SSIM, „1‟ indicates the high similarity. 3.2. Absolute Mean Brightness Error (AMBE) It is used to rate the performance of contrast enhancement techniques in preserving the original brightness. It is defined as the absolute difference between the mean of the original and the output images and is proposed to rate the performance in preserving the original brightness AMBY(x,
y) x m y m
(9)
where xm is mean intensity input image x and ym is mean intensity of the output image y. Lower AMBE indicates the better brightness preservation of the image. IV.
RESULTS AND DISCUSSION
The above methods are coded in MATLAB 7.8 using Pentium IV processor. For our experiment, some standard general images were collected from web site. Some MRI images were collected from the IBSR and other web resources. Initially, the image contrast was adjusted to resemble poor lighting images using MATLAB code. Then the proposed and existing methods were applied on those images. The results are shown in Fig.1 the original (before contrast adjustment) are given in column1. The contrast adjusted images are given as input. They are shown in column 2. The output of HE and proposed method are given in column3 and 4 respectively. As per this output images, HE highly brighten the bright region
ISBN 978-93-84743-57-4 © 2015 Bonfring
Recent Advances in Computer Science and Applications
4
and darken the light dark region. But proposed method does not made high deviation. In Fig. 1, first four rows are showing the result of MRI images. The first row image contains abnormality like tumor. In the output proposed method avoids the region overlapping well and highly enhances the images compared to HE. In row 2 and row 3, the proposed method shows the internal structures highly than the existing HE. The next analysis is done with general images. They are shown in Fig.2 and rows 4 and 5. In the satellite images, HE merges the bright regions with the background but proposed method highly avoids the region merging. The last row shows the dog image which is real time image. The HE put shadows under the neck but proposed method avoids it. By this visual analysis the proposed method highly adjust the contrast and also smoothing work. Table 1. Quantitative Results Image
SSIM
V.
REFERENCES [1] [2] [3]
AMBE
Proposed
HE
Proposed
HE
[4]
MRI 1 MRI 2
0.917 0.909
0.241 0.252
13.703 16.444
140.466 142.138
[5]
MRI 3
0.911
0.268
13.389
135.778
MRI 4
0.671
0.284
11.587
121.499
MRI 5
0.696
0.503
15.667
85.707
Rice
0.834
0.738
41.643
18.724
Mandrill
0.832
0.758
37.723
1.3
Lena
0.834
0.859
37.173
3.637
[8]
Dog
0.794
0.83
28.01
28.05
[9]
Einstein
0.838
0.734
39.164
24.76
[10]
Stadium
0.771
0.56
29.322
73.201
Quantitative analysis is very important in the machine vision. Hence the quantitative results obtained between the original and output images are tabulated in Table. 1. In this table the image names are given in column 1, SSIM of proposed and HE are given in column 2 and 3 respectively and AMBE of proposed and HE are given in column 4 and 5 respectively. According to this table, the proposed method gives SSIM value close to 1. It represents the proposed method highly improved the contrast close to its original. In terms of AMBE, proposed method gives less value for MRI images and high value for general images. The less AMBE value is high significant. Hence, the proposed method highly suitable for MRI images than general images. But it gives more visual quality than HE for all types of images.
CONCLUSION
This paper derives a new contrast enhancement method with the base of Weber‟s law. It works on poor luminance images which are taken from dark area and MRI images. It enhances and improves the contrast and brightness of the poorly illuminated images. The results were compared against existing HE method by visual and quantitative results. According to the results the proposed method outperforms the HE method. It is mostly suited for MRI images for enriching the tissue contrast and thus improving the segmentation process. It cannot enhance very smooth images like Lena. The future work focuses those types of images.
[6]
[7]
[11] [12] [13] [14] [15] [16] [17]
Sreedhar, K., “Enhancement of images using morphological transformations”, International Journal Computer Science & Information Technology ,Feb 2012 ,pp.138-140. Sathya, S., Manavalan.R., ”Analysis of background detetion and contrast enhancement of MRI images”, IEEE computer applications ,Dec 2011, pp.16-20. Saradha devi.A., “A block based scheme for enhancing low laminated image”, International Journal of Multimedia & It’s applications ,Aug 2010, pp.50-54. Yeong-Taeg Kim, “Contrast enhancement using brightness preserving Bi-Histogram equalization”, IEEE Trans, Consumer Electronics, Feb 1997, pp.1-8. Iyad Jafar, Hao Ying, “Multilevel Component-Based Histogram Equalization for Enhancing the Quality of Grayscale Images”, IEEE Electronic Information Technology , 2007, pp.563-568. Wongsritong. K., Kittayaruasiriwat. K., “Contrast enhancement using multipeak histogram equalization with brightness preserving”, IEEE Asia pacific Conference on Circuit and System, Nov 1998, pp.24-27. Divya Mananx, et.all., ”A new approach for improvement of Dark images”, International Journal Engineering Electronics, July 2012. Ketcham, D.J., Lowe, R., ”Seminar on image processing in Realtime enhancement Techniques” ,1976 , pp.1-6. Pizer, S.M., Amburn, E.P., “Adaptive histogram equalization and its variations”, 1987, pp.335-368. Narasimhan, K., Sudarasan, C.R., “A Comparision of Contrast enhancement technique in poor illuminaged grey level and color image”, International Journal Computer Application, 2011. Gauch, J.M., ”Investiagations of image contrast space defined by variations on histogram equalizatons”, CVGIP: graph models. Image process, July 1992, pp.269-280. Stark, J.A., ”An alternative algorithm for adaptive histogram equalization”, CVGIP: graph models. Image process, March 1996, pp.180-185. Nikesh, “Image enhancement and background detection using morphological transformation”, International Journal of Engineering Research and Applications, Feb 2014, pp.07-10. Iyad Jafar, Hao Ying., ”Multilevel component-Based Histogram Equalization for Enhancing the Quality of GrayscaleImages”, IEEE Electronic Information Technology , 2007, pp.563-568. Shannon, C., “A mathematical theory of communication”, Bell System Technology Journal., 1948, pp.379-423. Nicholas Sia Pik Kong, “Color image enhancement using brightness preserving dynamic histogram equalization”, IEEE Trans. Consumer Electronics, November 2008, pp. 1962-1968. Jain. A.K., “Fundamentals of Digital Images Processing”, Englewood Cliffs, NJ: Prentice-Hall, 1989.
ISBN 978-93-84743-57-4 © 2015 Bonfring
Recent Advances in Computer Science and Applications
[18] Kasperek, J., ”Real time morphological image contrast enhancement in virtex FPGA”, in Lecture Notes in Computer Science. New York: Springer, 2004. [19] Vincent, L., ”Morphological segmentation for texture and particles”, Digital Image Processing Methods, New York,1994, pp.43-56. [20] Toet, A., ”A hierarchical morphological image decomposition pattern recognition letters”, 1990, pp.267-274. [21] Sherrier, R.H., ”Regionally adaptive histogram equalization of the chest”, IEEE Trans.Medical image, 1987, pp.1-7.
ISBN 978-93-84743-57-4 © 2015 Bonfring
5