The Photogrammetric Journal of Finland, Vol. 22, No. 1, 2010
Received 11.10.2009, Accepted 26.04.2010
INDIRECT ORIENTATION OF IMAGES USING CONTROL POINTS EXTRACTED BY THE MEANS OF MONOPLOTTING MODEL Daniel R. dos Santos1, Aluir P. Dal Poz2, and Quintino Dalmolin1 1 2
Federal University of Paraná, Department of Geomatic, Curitiba, Brazil State University of São Paulo, Department of Cartographic Engineering, Presidente Prudente, Brazil
[email protected];
[email protected];
[email protected]
ABSTRACT This article presents a method for extracting control points from photogrammetry and light detection and ranging (LiDAR) data integration for the indirect orientation of images. Its most important characteristic is control point extraction from the proposed monoplotting model, which allows the projection of image space onto the object space by use of the integration of data derived from different sensors. Data integration has shown its potential in the optimization of photogrammetric tasks, including the indirect orientation of images. Here, the image points are extracted from scanned analogue images, captured using a conventional metric camera and covering the same region as a LiDAR data-set, and based on the intersection between the projection ray from the perspective centre through an image point and its object space correspondence and a digital surface model (DSM derived from LiDAR data). The control points are determined and used in the adjustment for the indirect orientation of digital images taken by a small-format digital camera. Implementation and testing of the adopted method have employed data from different sensors. The quality of the control points determined by the suggested method was determined statistically using the discrepancies between 3D coordinates of pre-signalised points determined by means of a global positioning system (GPS) survey. The generated control points were used in the least squares adjustment for indirect orientation of images acquired from a small-format digital camera. The results obtained showed that the proposed method is promising and has potential for the indirect orientation of digital images. 1. INTRODUCTION The indirect orientation of images is demanded in different mapping tasks such as: map revision and production; orthophoto and digital terrain model (DTM) generation; 3D extraction and object reconstruction; geographic information system (GIS) updating; change detection; etc. The aim of indirect orientation is to establish a relationship between the image and ground reference systems. To realise the indirect orientation of images, the identification of image points that represent precise image and object space coordinate correspondences is required. Any other sensor model can apply this relationship such as direct linear transformation, affine transformation, projective or rational function transformation and more interesting ideas have been suggested by Okamoto et al. (1992), El-Manadili and Novak (1996), Fritsch et al. (1998), Hattori et al. (2000), Zhang and Zhang (2002), Grodecki and Dial (2003), Ono and Hattori (2003), Fraser and Hanley (2004), Fraser and Yamakawa (2004), Habib and Alruzouq (2004), Fraser et al. (2006), etc. The point-
60
based rigorous sensor model has also been used for indirect orientation of images. The most important methods were proposed by Ebner and Strunz (1988), Gugan (1987), Kratky (1989), Zeng and Wang (1992), Ackermann and Tsingas (1994), Toth and Krupnik (1994), Orun and Natarajan (1994), Gulch (1995), and Schenk (2004). Usually, the ground reference system, required to establish a relationship between images and object space, depends on sensor geometry and available data. There are two methods of collecting control points, that is, by conventional geodetic surveying methods and remote methods. According James et al. (2007), control point data collection using a global positioning system (GPS) and topographic instruments is slow by comparison with photogrammetry and remote sensing, because traditional ground surveying is direct, time-consuming and has expensive operational costs. Fast, autonomous and reduced cost alternatives for control point data collection are photogrammetry and light detection and ranging (LiDAR) systems. Two methods exist to measure photogrammetric coordinates: the stereoscopic and monoscopic (monoplotting) methods. The stereoscopic method uses two or more images for the precise determination of coordinates. For a rigorous solution, the monoplotting method uses a single image and a high quality digital surface model (DSM) or DTM. Various procedures for monoplotting have been published in the literature, with alternative solutions proposed by Makarovic (1973), Masry and Mclaren (1979), Jauregui et al. (2002), Ressl et al. (2006), etc. LiDAR comprises a GPS receiver, an inertial navigation system (INS) and a light amplification by stimulated emission of radiation – a LASER. The LiDAR has the capability to rapidly provide 3D information about points located on a surface. The system emits pulses that are reflected from objects on the surface and returned to be received by the system. The distance between the sensor and the target is computed based on the time delay between pulse emission and its return (Wehr and Lohr, 1999). The data used in this paper were provided by a airbone system, specifically an Optech ALTM 2050 laser scanner. Aircraft positions were determined by differential GPS (DGPS) and the attitude of the sensor was provided by an INS. Points in object space were scanned nearly perpendicular to the flight path. This system automatically provides 3D information, with high accuracy and speed. Another advantage of the system is a decrease in the geodetic surveying required. The information registered by DGPS and INS is used for the generation of a DSM or DTM and the spectral information acquired by LiDAR is employed to produce an intensity image. The intensity value is a measure of the return signal strength. It measures the peak amplitude of return pulses as they are reflected back from the target to the detector of the LiDAR. Intensity values are relative rather than absolute and vary with altitude, atmospheric conditions, directional reflectance properties and the reflectivity of the target. The complexity of the system influences the quality of position determination. According Maas (2003), the major error sources influencing the accuracy of point data are the LiDAR instrument itself, the position and orientation determination system, the alignment between these two subsystems and possibly human errors in data handling and transformation. According Wehr and Lohr (1999), a LiDAR data set can be characterised as a cloud of irregularly distributed 3D points. The sampling density depends on the flying speed, the pulse rate, the scan angle and the flying height. However, pointing the LASER beam to specific objects or features is not possible using a LiDAR system. Ackermann (1999) dealt with this problem, explaining that the resulting coordinates are derived from the footprints of the laser scan, whose points are distributed in a random fashion. Due to the aleatory effect of the scanning system and the
61
frequency used, it is not possible to register the information about every ground point influencing the horizontal errors because of the point spacing. Many users prefer to work on DTM or DSM in a regular grid and apply an interpolation filtering procedure. According Habib et al. (2007), the integration of data derived from different acquisition systems had been showing potential, principally because LiDAR has the capability to rapidly provide 3D information about points located on a surface with high accuracy and provides rich geometrical surface information, which could complement information from photogrammetric data. Several scientific papers have been presented as an alternative solution for extracting control points derived from photogrammetry and LiDAR data integration, the most important being by Habib and Schenk (1999), Schenk et al. (2001), Schenk and Csatho (2002), Habib et al. (2004a, b, c), Furkuo and King (2004), Chen et al. (2004), Barbarella et al. (2004), Habib et al. (2005a, b), Habib et al. (2006), Habib et al. (2007), Abdelhafiz et al. (2007), Mitishita et al. (2008), and Delara et al. (2008). Consequently, this study aims at extracting control points from photogrammetry and LiDAR data integration for the indirect orientation of images. Implementation and testing of the adopted method involves data from different sensors. The quality of control points extracted from data integration images was statistically available through comparison with 3D coordinates determined by means of a GPS survey. The control points extracted from the suggested monoplotting model were applied for indirect orientation of images over test sites in Curitiba, Brazil and the results showed that the proposed method is promising and has potential for the indirect orientation of images. This paper is organised as follows: the method is presented in the next section, followed by the experimental results, a discussion, some conclusions and recommendations for future work. 2. METHOD 2.1
Overview
The proposed method is based on the extraction of control points from LiDAR and photogrammetry data integration for the indirect orientation of images. The process sequence of method is as follows: (1) Taking into account one scanned analogue image (with 1:16000 image scale) taken using a conventional metric camera with known interior orientation parameters (IOP) and exterior orientation parameters (EOP), the process starts by collecting 11 pre-signalised image points and 19 other image points in the scanned analogue image for extracting control points from data integration. Here, the 19 image points not signalised belong to the same region covered by the digital image taken by a small-format digital camera (with 1:1800 image scale, see Fig. 1a). For each image point manually collected, a corresponding LiDAR data-set region is projected from object space onto image space using the well-known collinearity equations and the IOP and EOP of the scanned analogue image. As a result, several image triangles are generated using the cloud of irregularly 3D distributed points from the LiDAR data-set projected from object space onto image space and the implemented algorithm automatically verifies the intersection between collected image points and image triangles; (2) When a collected image point positively intersects an image triangle, the control point is determined using the suggested monoplotting model. The algorithm repeats stages (1) and (2) for all the image points collected in the scanned analogue image; (3) Finally, 19 other image points are collected in the digital image taken by the small-format digital camera and their control points’ correspondences extracted from
62
the suggested model are used for indirect orientation of the digital image using the collinearity equations. It is interesting to note here that after the EOP determination of the digital image, it could also be used for a change detection photogrammetric task. The results obtained are statistically verified and present the efficiency and potential of the proposed method for indirect orientation of images. In the following, the methodology and mathematical models used in the method are described in detail. 2.2
Process to verify the intersection between irregularly distributed 3D points from a LiDAR data-set projected to image space and collected image points
Consider one scanned analogue image (with 1:16000 image scale), taken with a conventional metric camera with known IOP and EOP. Eleven pre-signalised image points and 19 other image points that cover the same region as the digital image taken by a small-format digital camera were collected. Figure. 1a shows the digital image covering one part of the scanned analogue image and Figure. 1b shows an example of the pre-signalised image points.
(a)
(b)
Figure 1. (a) Digital image recovering one part of the scanned analogue image. (b) Example of pre-signalised image points collected from the scanned analogue image. Here, the collection of image points from the scanned analogue image is manually realised by an operator and the systematic errors are eliminated by applying the monoplotting model suggested in this paper. For each image point manually collected, a corresponding LiDAR data-set region (cut-off DSM search window, Fig. 2) of object space is projected onto image space using the collinearity equations (Mikhail et al., 2001) and known IO and EO parameters.
63
Figure 2. Process to verify if the image point is considered to be inside the image triangle. In Figure 2, the red points are the cloud of irregularly distributed 3D points from the LiDAR dataset; the black rectangle is the cut-off DSM search window that will be projected using the collinearity equations. Here, all the points inside the black rectangle will be projected from object space onto image space, with points OPQ being the likely 3D coordinates that will be used to verify if the collected image point ( g i ) is considered to be inside the image triangle (blue image triangle opq). The image point is regarded as inside the image triangle if the intersection of the collected image point and the image triangle occurs. This procedure is performed for all collected image points in the scanned analogue image; the intersection process is automatically verified. When an image point is regarded as inside the image triangle, the suggested monoplotting model must be applied for the extraction of control points. 2.3
Extraction of control points using the monoplotting model
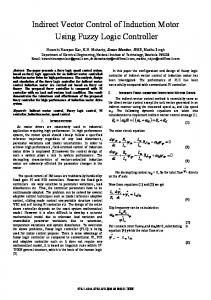
The proposed mathematical model allows the projection of image space points onto the object space using photogrammetry and LiDAR data integration. As described above, the proposed model is based on the intersection between the projection ray from the perspective centre, an image point and its object space correspondence (collinearity condition) and a DSM or DTM derived from the LiDAR data-set. Figure 3 shows the geometry of the proposed model. r
In the Figure 3, the vector ni = PCg i' is formed by perspective centre (PC, with coordinates X C , Y C , Z C ) and an image point ( g i ), as follows: r ni = ( xi '− x0 , yi '− y0 ,− f )T
(1)
Where f is calibrated focal length, xi ' , yi ' are the image coordinates. We can normalize the vector considering the following expression: r ( x '− x ) r ( y '− y ) r (− f ) r (2) ni = i 0 i + i 0 j + k di
di
di
64
Figure 3. Geometry of proposed model. Hence x0 , y0 are the principal point coordinates (pp) and
di = ( xi '− x0 ) 2 + ( yi '− y0 ) 2 + (− f ) 2
.
r The normal vector N i to the object space is obtained by multiplying the vector nri by the inverse of rotation matrix M T , defined by the sequence M = M κ M ϕ M ω the well-known 3D rotation Matrix, as
follows: ⎡ N xi ⎤ r r ⎢ ⎥ N i = M T ni = ⎢ N yi ⎥ ⎢ N zi ⎥ ⎣ ⎦
(3)
The basic mathematical model is the parametric representation of the 3D feature, defined as follows: r (4) Gi = Niti + PC Hence, it is important to note that ti is a real variable denoted as the line parameter. In the Figure 1, assuming no collinearity between the vectors PO , QP and G i O , we satisfied the equation of a plane, which can be obtained through the cross product of these three vectors, as follows: (5) Gi O • ( PO ∧ QP) = 0 Developing equation (6) and carrying out some mathematical manipulations we have the general equation of a plane: (6) AX + BY + CZ + D = 0 Since the parametric representation of the 3D feature passes through the perspective centre and Gi = [ X iYi Z i ]T , we can intersect it with the object triangle (DSM points OPQ). Substituting equation (4) in (6) we have the following mathematical expression: (7) A( N xi ti + X C ) + B( N yi ti + Y C ) + C ( N zi ti + Z C ) + D = 0
65
Now, using equation (7) for extracted the ti parameter, we consider: ti = −
(8)
AX C + BY C + CZ C + D AN xi + BN yi + CN zi
Finally, using the ti parameter in equation (4) the suggested monoplotting mode can be written as: AX + BY + CZ + D (9) X =− N +X C
i
Yi = −
C
C
AN + BN + CN zi i x
i y
i x
C
AX C + BY C + CZ C + D i Ny +Y C AN xi + BN yi + CN zi
⎛ AX C + BY C + CZ C + D i ⎞ Zi = ⎜ − Nz + Z C ⎟ − ZN ⎜ ⎟ AN xi + BN yi + CN zi ⎝ ⎠
Hence, X iYi Z i are the 3D coordinates (control points) extracted from the monoplotting model and Z N is the geoidal undulation determined using a geoidal map of region.
Figure 4. Cut off image point search window processed by step 1. As described above, the control points are extracted using equation (9) for each image point manually collected by the operator. In this case, the proposed model is applied for all collected image points (Fig. 4) and control points are determined. 2.4
Sensor model for indirect orientation of images
The ground reference system (GRS) assumed here is the Conventional Terrestrial Reference System (CTRS). The CTRS has its origin at the centre of gravity of the Earth. The axis Z points towards the North Pole, axis X is directed towards the Greenwich meridian, the axis Y is in the equatorial plane, and the three axes constitute a right-handed system (Fig. 5.a). Now the XiYiZi (Eq. 9 and Fig. 4.b) are determined based on the intersection between the projection ray from the perspective centre, an image point and its object space correspondence (collinearity condition) and the cloud of irregularly 3D distributed points from LiDAR data-set (determined by GPS/INS data integration). The extracted control points are transformed to the South American datum 1969 (SAD69) knowing the characteristics of the reference ellipsoid geodetic reference system 1980 (GRS80) and are then shifted to the centre of the area covered by the images ( X sYs [ Z s − Z N ]) . The image coordinate system defined in a digital image is two-dimensional. It has its origin at the left upper corner of the image, the C-axis is in the direction of increasing rows and the L-axis is orthogonal to it (see Fig. 5b). The pixel coordinates (C , L) can be converted to metric image coordinates ( x' , y ' ) by the following expression:
66
NC )Tp 2 N y ' = −( L − L )Tp 2
x' = (C −
(11)
Where Tp is the pixel resolution, N C , N L total number of rows (C) and columns (L), respectively.
(a)
(b)
Figure 5. (a) Definition of the collinearity sensor geometry. (b) Definition of the image coordinate system. The small-format digital camera is an imaging sensor frame (see Fig. 5a). Its detector subsystem employs the charge coupled device (CCD) technique, where each frame has its own perspective central relationship with the ground. Generally, the transformation between this system and the ground is described by the collinearity equation. For a known control point in object space, the standard collinearity model can be deduced such that the projection ray from the perspective centre through an image point intersects the control point. Figure 5a illustrates this scenario. In order to apply the collinearity equations to the image coordinates of a point ( x' , y ' ) , they must first be transformed to the photogrammetric coordinate system by reducing the values of systematic effects such as the principal point coordinates ( xo , yo ) and length distortions ( Δ r , Δ d ) before the adjustment. So, the collinearity equations can be written as: r00 ( X i − X C ) + r01 (Yi − Y C ) + r02 ( Z i − Z C ) r20 ( X i − X C ) + r21 (Yi − Y C ) + r22 (Z i − Z C ) r ( X − X C ) + r11 (Yi − Y C ) + r12 (Z i − Z C ) y '− yo − Δ ry − Δ dy = − f 10 i r20 ( X i − X C ) + r21 (Yi − Y C ) + r22 (Z i − Z C ) x'− xo − Δ rx − Δ dx = − f
(12)
Where X i , Yi , Z i are control points extracted from the suggested monoplotting model, and are the elements of rotation matrix M.
r00 ,..., r22
The mathematic model presented in equation (12) is non-linear with respect to the parameters. The set of error equations provided by linearization can be written in vector form as V = AX + L , where V is the residual error vector, A is the design matrix, X is the correction vector and T Lb contains the values of the observations. In the least squares adjustment, residual V PV must be minimised and the product of minimisation is the vector form X = −( AT PA) −1 ( AT PL ) , where P is a matrix containing the inverse of the variances of the observations.
67
3. EXPERIMENTS AND RESULTS Two typical photogrammetric experiments were conducted to verify the viability of the method. The experiments addressed: 1) discrepancy analysis between control points extracted from the suggested monoplotting model (equation 9) and 3D coordinates determined by means of a GPS survey; and 2) indirect orientation of a digital image using the control points extracted from the proposed method and the collinearity equations presented above. Here we used two data-sets to carry out the proposed experiments; the first data-set is based on control points extracted from the suggested monoplotting model, while the second data-set is based on control points determined by means of GPS survey. The steps involved in the methodology were implemented in C++ using the Borland Builder 5.0 for Windows. 3.1
Data sets and models tested
The data-sets used for experiments were: one scanned analogue image (with 1:16000 image scale acquired in 1999) taken with a conventional metric camera with known IO and EO parameters; one digital image (with 1:8000 image scale acquired in 2003) taken with a small-format digital camera DSC F717, which needed to be orientated. Here, it is important to remember that the scanned analogue image covered part of Curitiba - more specifically the Campus of the Federal University of Paraná/Brazil - and the digital image covered one part of the scanned analogue image; a data-set of 3D coordinates of the 30 control points determined by means of a GPS survey, including 11 pre-signalised and 19 other control points not pre-signalised; a LiDAR data set captured with ∼0.7 m point spacing, whose LiDAR data were only available from the LACTEC already interpolated to a 0.8 m grid using inverse-distance-weighting; 11 pre-signalised and 19 control points not pre-signalised determined from the suggested monoplotting method. Hence, the 19 control points not pre-signalised determined using the GPS survey and the monoplotting model were to be used for indirect orientation of the digital image and the other 11 pre-signalised points were to be used for analysing the control point accuracy determined using the suggested monoplotting model. Table 1 shows the specifications for the photogrammetric data-set and Table 2 shows the specifications for the LiDAR data-set used in the experiments. Table 1. Specifications for photogrammetric data-set. Camera model
WILD RC-10
Calibrated focal length Scale Number of images Avg. flight height (m) Pixel size (mm) Expected image measurement accuracy (mm) Camera model
153.167 1:16000 1 ∼1375 0.024 ±0.024 SONY DSC F717
Calibrated focal length Scale Number of images Avg. flight height (m) Pixel size (mm) Expected image measurement accuracy (mm)
68
10.078 1:8000 1 ∼730 0.004 ±0.004
According to Wehr and Lohr (1999), the LiDAR system provides horizontal accuracy of better than 0.5 m and vertical accuracy of better than 0.15 m. According to the US national map accuracy standards (NMAS), horizontal control point errors should not exceed 33% of target DSM or DTM horizontal error and vertical control point errors should not exceed 40% of the target DSM or DTM vertical error (Wolf and Dewitt, 2000). Thus, with a horizontal error of ±0.5 m and a vertical error of up to ±0.15 m, the expected horizontal and vertical control point accuracies (assuming 1 pixel measurement error) extracted from the suggested monoplotting model using the scanned analogue image are ±1.51 m and ±0.38 m, respectively. This does not take into account any error introduced through point projection from object space onto image space and point measurement in the scanned analogue image (Step 1). Table 2. Specifications for LiDAR data-set. Model system
Optech ALTM 2050
Avg. flying height (m) Mean point density (points/m2) Expected horizontal accuracy (m) Expected vertical accuracy (m)
975 2.24 0.5 0.15
In this first experiment, we collected 11 pre-signalised image points in the scanned analogue image and applied the suggested monoplotting model. The analysis of control point accuracy was realised using the calculated discrepancies between control points determined from the suggested model and the 3D coordinates determined by means of the GPS survey. 3.2
Analysis of control points accuracy
The main goal of the first experiment was to determine the control point accuracy. Thus, we computed the discrepancies between the 3D coordinates of points determined by means of a GPS survey and the control points determined by the proposed monoplotting model. Firstly, monoscopic image measurements of 11 pre-signalised points were taken manually in the scanned analogue image (e.g. see Fig. 1) and the remaining points were used in the monoplotting model to determine the 3D coordinates in the object space (control points). It is interesting to note that Step 1 described above was applied to calculate the 3D coordinates for each collected image point. We also used 11 pre-signalised 3D coordinates determined by means of GPS survey to compare with the control points determined from the suggested model. The discrepancies between the 3D coordinates of pre-signalised points determined by means of a GPS survey and the suggested method are presented in Table 3. Table 3. Results of root mean square error (RMS error) discrepancy. Discrepancies between control points determined from the monoplotting model and 3D coordinates determined from GPS survey Number of pre-signalised control points Mean discrepancy (m) RMS error discrepancy (m)
69
11
μX =-0.99, μY=-0.099, μZ=-0.01 σX =0.63, σY=0.43, σZ=0.19
3.3
Indirect orientation of a digital image taken by a small-format digital camera
The second experiment concerned the indirect orientation of a digital image taken by a smallformat digital camera using the collinearity equation and other control points determined using the suggested monoplotting model to verify the applicability of the method. Hence, another 19 not pre-signalised image points were collected in the scanned analogue image and the control points were determined from the suggested monoplotting model and used in the adjustment for indirect orientation of the digital image. We also used these 19 control points determined by means of GPS survey in the adjustment for indirect orientation of the digital image described above. The results obtained in both methods were used to compute the discrepancies between them and are listed in Table 4. Table 4. Estimated EOP using the control points determined from monoplotting model and determined by means GPS survey. Estimated EOP by using the control points determined using the suggested model Rotations (rad) Standard deviation of rotations (rad) Translations (m) Standard deviation of Translations (m)
kappa=1.95, phi=-0.0005, omega=-0.016 σkappa=0.00031, σphi=0.0015, σomega=0.0013 XC=677399.57, YC=7183614.10, ZC =1652.15 σXC=0.54, σYC=1.65, σZC=0.23
Estimated EOP by using the control points determined by GPS survey Rotations (rad) Standard deviation of rotations (rad) Translations (m) Standard deviation of Translations (m)
kappa=1.951, phi=-0.005, omega=-0.014
σkappa=0.0004, σphi=0.0024, σomega=0.0023
XC=677398.54, YC=7183613.74, ZC =1651.84 σXC=1.93, σYC=1.84, σZC=0.55
Discrepancies between the methods Rotations (rad) Translations (m)
Δkappa=0.001, Δphi=0.0055, Δomega=0.002 ΔX=1.03, ΔY=0.36, ΔZ =0.31
As described above, a space resection of the digital image (with 1:8000 image scale) was executed with control points determined from the monoplotting model and control points determined by means of GPS survey and the discrepancies were computed. The initial approximations of the EOP were: kappa=1.9, phi=omega=0.0 radians and XC=677600.00, YC=7183800.0, ZC =1850.00 metres. 3.4
Discussions
The values presented in Table 3 reveal that the RMS errors in horizontal and vertical ground coordinates are better than the expected precision value; that is, they are less than 1.51 m and 0.38 m. Hence, using the LiDAR and photogrammetry data integration (proposed method), the control point horizontal and vertical accuracy can be improved. It is important to remember that the image scale has an influence on the results here; that is, the larger the image scale, the higher precision in the determination of control points. Figure 6 shows the systematic errors for the horizontal and vertical components.
70
Figure 6. Horizontal and vertical discrepancies. Figure 6 shows that all the X and Y discrepancies resulting from the analysis performed with the proposed method were less than 0.64 m and the Z discrepancies were less than 0.2 m. These values represent the differences between the horizontal and vertical ground coordinates of the control points determined using the suggested method and the GPS survey. However, the distribution of the X discrepancy reveals a systematic trend that was not modelled. Slightly inaccurate values of the IO and EO parameters are probably the source of this systematic error; hence no conclusions can be drawn. Fig. 6 shows that one control point had its horizontal discrepancy greater than 1.65 m, probably due to the pre-signalised image point being close to the building. In this case, one or two points that delineate the image triangle could have been the edge points of the building. These results demonstrate the accuracy of the control points determined using the suggested monoplotting model and its potential to extract control points. With respect to indirect orientation of images the discrepancy values show that both methods are close, with the rotation parameter phi found in the method presenting the largest discrepancy (0.0055 radians ~ 31’51”) and, in the same way, the discrepancy value of the translation parameter XC is equal to 1.03 m. This problem was expected due to the un-modelled systematic error in X LiDAR coordinates (see Fig. 6). Thus, both methods are compatible; that is, the proposed method can be applied for indirect orientation of images. The standard deviations of parameters determined from the proposed method reveal values less than determined from the conventional method. Therefore, we do not regard the result as expected because the 3D coordinate accuracy determined by means of the GPS survey is better than the control point accuracy determined from the proposed method. Thus, we need more investigations into this outcome. The estimated orientation parameters of kappa and ZC present the lower standard deviations. The estimated rotation parameter phi presents a most sensitive convergence, whose stability was found after the fourth iteration, while the other parameters present convergence after the third iteration. With respect to the translation parameters, all estimated parameters show stability after the third iteration. The proposed method presented in this work to extract control points derived from data integration has worked very well in all experiments because good results for EOP and control point accuracy were obtained. An important advantage of proposed method is that the conventional limits on the number of control points that can be collected no longer be relevant. Here, a large number of control points can be determined and there is no need for pre-signalised control points for indirect orientation of
71
images such as through conventional method, including image points derived from building roofs (see Fig. 4a). Other advantage ones is that the traditional limits on the Z interpolation with respect to the proposed monoplotting model by Makarovic (1973) there is no need, because the suggested monoplotting model here computed the 3D coordinates directly, that is, there is no need Z interpolations. Therefore, there is need to verification if the collected image point is considered to be inside the projected image triangle. Other one is, how described above, the implemented algorithm remain file the cut off image points search window (Fig. 4a) and it become possible the automation of indirect orientation of images using area-based matching. The disadvantage of the method is that it requires one set of LiDAR data and the analogue image scale has an influence on the results of control point horizontal and vertical accuracy to digital image already be accurately oriented. This might not be the case in all practical situations.
4. CONCLUSIONS AND RECOMMENDATIONS FOR FUTURE WORK This paper presented a method for extracting control points from LiDAR and photogrammetry data integration for the indirect orientation of images. The most important contribution of the suggested method is the means of determining control points using a monoplotting model based on the intersection between the projection ray from the perspective centre through an image point and its object space correspondence and a DSM derived from LiDAR data. With a purpose of evaluating method’s potential in extracting control points and indirect orientation of images, two experiments were conducted: the discrepancies analysis of control points extracted from suggested monoplotting model; and analysis of results obtained from indirect orientation of digital image by using the well-known collinearity equation. In all cases, the results obtained can be considered satisfactory and in accordance with the ones theoretically expected. The discrepancy analyses produced horizontal coordinate RMS error values of less than 0.64 m and vertical coordinate RMS error values of less than 0.2 m. The analysis of results obtained from indirect orientation of a digital image using the collinearity equation revealed that both methods are compatible and the proposed method can be applied for indirect orientation of images. The standard deviations of parameters determined from the method revealed values less than determined from the traditional method and we need to better investigate the cause of this effect. The manual establishment of feature point correspondences between image and object space helped the success of the indirect orientation of images. The control points extracted using the proposed method also showed its potential for indirect orientation of images, producing results close to those obtained from the traditional method. Using the integration of data derived from LiDAR and photogrammetry, we can obtain accurate 3D coordinates, whose integration is necessary for a complete description of 3D features. However, the greatest factors influencing accuracy are the digital image scale and DSM or DTM resolution. The automatic area-based correspondence problem will be the focus of our future work, as well as the automatic indirect orientation of images and the automatic extraction of control points.
72
5. ACKNOWLEDGEMENTS The authors would like to thank the LACTEC for providing the LiDAR data-set used in this work and to CNPq (Conselho Nacional de Desenvolvimento Científico e Tecnológico) for general support of this project no. 570316/2008-1. 6. REFERENCES Abdelhafiz, A., Riedel, B., and Niemeier, W., 2007. “3D image” as a result from the combination between laser scanner point cloud and digital photogrammetry. In: Optical 3D Measurement Techniques VII, Vol. I, pp. 204-213. Ackermann, F. and Tsingas, V., 1994. Automatic digital aerial triangulation. Proceedings of ASPRS0ACSM Annual Convention and Exposition, pp. 1-12. Ackermann, F., 1999. Airborne laser scanning-present status and future expectations. ISPRS Journal of Photogrammetry and Remote Sensing, 54(2/3), pp. 64-67. Barbarella, M., Lenzi, V., and Zanni, M., 2004. Integration of airborne laser data and high resolution satellite images over landslides risk areas. International Archives of the Photogrammetry, Remote Sensing and Spatial Information Sciences, 35(B4), pp. 945-950. Chen, L. T., Teo, Y., Shao, Y., Lai, J., and Rau, J., 2004. Fusion of LiDAR data optical imagery for building modeling. International Archives of XXth ISPRS Congress, Istanbul, Turkey, 35(B4), pp. 732-737. dal Poz, A. P., 1997. Uma solução para o problema fotogramétrico inverso. Cartografia e Cadastro (Lisboa), Lisboa, Portugal, 7, pp. 43-47. Delara, R. S. Jr., Mitishita, E. A., Vogtle, T., and Bahr, H. P., 2008. Automatic digital image resection controlled by LiDAR data. 3D Geo-Information Sciences, 11(2), pp. 213-234. Ebner, H. and Strunz, G., 1988. Combined point determination using digital terrain models as control information. International Archives of Photogrammetry and Remote Sensing, 27(B11/3), pp. 578-587. El-manadili, Y. S. and Novak, K., 1996. Precision rectification of SPOT imagery using the direct linear transformation model. Photogrammetric Engineering & Remote Sensing, vol. 62, no. 1, pp. 67-72. Fraser, C. S. and Yamakawa, T., 2004. Insights into the affine model for satellite sensor orientation. ISPRS Journal of Photogrammetry and Remote Sensing, 58(5/6), pp. 275-288. Fraser, C. S., Dial, G., and Grodecki, J., 2006. Sensor orientation via RPCs. ISPRS Journal of Photogrammetry and Remote Sensing, 60(3), pp. 182-194. Fraser, C. S. and Hanley, H. B., 2004. Bias compensated RPCs for sensor orientation of highresolution satellite imagery. Proceedings of ASPRS Annual Conference, 9 pages (on CD-ROM).
73
Fritsch, D., Englich, M., and Sester, M., 1998. Modelling of the IRS-1C satellite pan stereoimagery using the DLT approach. ISPRS Commission IV Symposium on GIS – Between Vision and Applications, 32(Part 4), pp. 511-514. Forhuo, E. and King, B., 2004. Automatica fusion of photogrammetric imagery and laser scanner point clouds. International Archives of Photogrammetry and Remote Sensing, 35, pp. 921-926. Grodecki, J. and Dial, G., 2003. Block adjustment of high-resolution satellite images described by rational functions. Photogrammetric Engineering and Remote Sensing, 69(1), pp. 59-68. Gugan, D. J., 1987. Practical aspects of topographic mapping from SOPT imagarey. Photogrammetric Record, 12(69), pp. 349-355. Gulch, E., 1995. From control points to control structures for absolute orientation and aerial triangulation in digital photogrammetry. ZPF, 3/1995, pp. 130-136. Habib, A. F. and Schenk, T., 1999. A new approach for matching surfaces from laser scanners and optical sensors. International Archives of Photogrammetry and Remote Sensing, 32(3W14), pp. 55-61. Habib, A. F. and Alruzouq, R. I., 2004. Line-based modified iterated Hough transformation for automatic registration of multi-source imagery. Photogrammetric Record, 19(105), pp. 5-21. Habib, A. F., Ghama, M. S., Morgan, M. F., and Mitishita, E. A., 2004a. Integration of laser and photogrammetric data for calibration purposes. International Archives of XXth ISPRS Congress, Istanbul, Turkey, Commission I, 6p. (CD-ROM). Habib, A. F., Ghama, M. S., Kin, C. J., and Mitishita, E. A., 2004b. Alternative approaches for utilizing LiDAR data as a source of control information for photogrammetric models. International Archives of XXth ISPRS Congress, Istanbul, Turkey, Commission I, 6p. (CDROM). Habib, A. F., Ghama, M. S., and Tait, M., 2004c. Integration of LiDAR and Photogrammetry for close range applications. International Archives of XXth ISPRS Congress, Istanbul, Turkey, Commission I, 6p. (CD-ROM). Habib, A. F., Ghanma, M. S., and Mitishita, E. A., 2005a. Photogrammetric georeferencing using LiDAR linear and areal features. Korean Journal of Geomatics, 5(1), pp. 1-13. Habib, A. F., Ghanma, M. S., Morgan, M. F., and Al-Ruzouq, R., 2005b. Photogrammetric registration using linear features. Photogrammetric Engineering and Remote Sensing, 71(6), pp. 699-707. Habib, A. F., Cheng, R. W., Kim, E., Mitishita, E. A., Frayne, R., and Ronsky, J., 2006. Automatic surface matching for the registration of LiDAR data and MR imagery. ETRI Journal, 28(2), pp. 162-174. Habib, A. F., Bang, K. I., Aldelgawy, M., Shin, S. W., and Kim, K. O., 2007. Integration of photogrammetric and LiDAR in a multi-primitive triangulation procedure. ASPRS Annual Conference, pp. 7-11.
74
Hattori, S., Ono, T. Fraser, C. S., and Hasegawa, H., 2000. Orientation of high-resolution satellite images based on affine projection. International Archives of Photogrammetry and Remote Sensing, 33(3), pp. 359-366. James, T. D., Carbonneau, P. E., and Lane, S. N., 2007. Investigating the effects of DEM error in scaling analysis. Photogrammetry Engineering and Remote Sensing, 73(1), pp. 67-78. Jauregui, M., Vílchez, J., and Chacón, L., 2002. A procedure for map updating using digital monoplotting. Computer & Geosciences, 28(4), pp. 513-523. Kratky, V., 1989. Rigorous photogrammetric processing of SPOT images at CCM Canada. ISPRS Journal of Photogrammetry and Remote Sensing, 44(1), pp. 53-371. Maas, H. G., 2003. Planimetric and height accuracy of airbone laserscanner data – user requerements and system performance. Proceedings of 49o. Photogrammetry Week 2003 (Ed. D. Fritsch), Wichmann Verlag, pp. 117-125. Makarovic, B., 1973. Digital mono-plotters. ITC Journal, 4, pp. 583-599. Masry, S. E. and Mclaren, R. A., 1979. Digital map revision. Photogrammetry Engineering and Remote Sensing, 45(2), pp. 193-200. Mikhail, E. M., Bethel, J. S., and Mcglone, J. C., 2001. Introduction to modern Photogrammetry. Inc. New York: John Wiley & Sons, 479 p. Mitishita, E. A., Habib, A. F., Centeno, J. A. S., and Machado, A. M. L., 2008. Photogrammetric and LiDAR data integration using the centroid of a rectangular building roof as a control point. Photogrammetric Record, 23(6), pp. 19-35. Okamoto, A., Akamatsu, S., and Hasegawa, H., 1992. Orientation theory for satellite CCD linescanner imageries of mountainous terrain. International Archives of Photogrammetry and Remote Sensing, 29(2), pp. 205-209. Newby, P. R., 2007. Technical terminology for the photogrammetric community. Photogrammetric Record, 22(118), pp. 164-179. Ono, T. and Hattori, S., 2003. Fundamental principle of image orientation using orthogonal projection model. International Archives of Photogrammetry and Remote Sensing, 34(3), 6 pages (on CD-ROM). Orun, A. B. and Natarajan, K., 1994. A modified bundle adjustment software for SPOT Imagery and Photography: Tradeoff. Photogrammetry Engineering and Remote Sensing, 60(12), pp. 14311437. Ressl, C., Haring, A. Briese, C., and Rottensteiner, F., 2006. A Concept for adaptive monoplotting using images and Laserscanner. International Archives for Photogrammetry and Remote Sensing, 36(3), pp. 98-104.
75
Schenk, T., Seo, S., and Csatho, B., 2001. Accuracy study of airborne laser scanning data with Photogrammetry. International Archives of Photogrammetry, Remote Sensing and Spatial Information Sciences, 34(3/4), pp. 113-118. Schenk, T. and Csatho, B., 2002. Fusion of LiDAR data and aerial imagery for a more complete surface description. International Archives of Photogrammetry and Remote Sensing, 34(3/4), pp. 310-317. Schenk, T., 2004. From point-based to feature-based aerial triangulation. Photogrammetric Engineering and Remote Sensing, 58(2004), pp. 315-329. Toth, C. and Krupnik, A., 1994. Concept, implementation and results of an automated aerial triangulation system. ASPRS/ACSM Annual Convention, pp. 644-651. Zhang, J. and Zhang, X., 2002. Strict geometric model based on affine transformation for remote sensing image with high resolution. International Archives of Photogrammetry and Remote Sensing, 34(3), pp. 309-312. Zeng, Z. and Wang, X., 1992. A general solution of a closed-form space resection. Photogrammetry Engineering and Remote Sensing, 58(3), pp. 327-338. Wehr, A. and Lohr, U., 1999. Airborne laser scanning-an introduction and overview. ISPRS Journal of Photogrammetry and Remote Sensing, 54(2/3), pp. 68-82. Wolf, P. R. and Dewitt, B. A., 2000. Elements of Photogrammetry, with Applications in GIS. Third edition. McGraw-Hill, New York, 608 p.
76