Applied Mathematical Sciences, Vol. 7, 2013, no. 102, 5071 - 5084 HIKARI Ltd, www.m-hikari.com http://dx.doi.org/10.12988/ams.2013.36320
Interval Type-2 Fuzzy Logic System Model in Measuring the Index Value of Underground Economy in Malaysia Abd. Fatah Wahab Department of Mathematics, Faculty of Science and Technology University Malaysia Terengganu, Malaysia
[email protected]
Mohammad Izat Emir Zulkifly Department of Mathematics, Faculty of Science and Technology University Malaysia Terengganu, Malaysia
[email protected]
Hanafi A. Rahim Department of Mathematics, Faculty of Science and Technology University Malaysia Terengganu, Malaysia
[email protected]
Rozaimi Zakaria Department of Mathematics, Faculty of Science and Technology University Malaysia Terengganu, Malaysia
[email protected] Copyright ©2013 Abd. Fatah Wahab, Mohammad Izat Emir Zulkifly, Hanafi A. Rahim and Rozaimi Zakaria. This is an open access article distributed under the Creative Commons Attribution License, which permits unrestricted use, distribution, and reproduction in any medium, provided the original work is properly cited.
5072
Abd. Fatah Wahab et al.
Abstract Underground economy (UE) is known as hidden economy or shadow economy referring to unpaid tax. We applied interval type-2 fuzzy logic system (IT2 FLS) model in measuring the index value (IV) of UE in Malaysia over the period from 2001 to 2010. The efficiency of IT2 FLS model, the flow and trend of UE in Malaysia is discussed. Keywords: Interval type-2 fuzzy logic system, Underground economy, Index value
1 Introduction Fuzzy logic was originated and founded by Zadeh, has been around the world since 1965, [10] and was first developed by [2] for controlling a steam engine. The extensions of type-1 fuzzy set (T1 FS), the type-2 fuzzy set (T2 FS) were introduced by Zadeh in his trio paper [11] ten years later. T2 FS have been used in many field such as engineering, robotic, liquid level process and much more. The type-2 fuzzy logic system (T2 FLS) has a potential to provide a better performance than type-1 fuzzy logic system (T1 FLS) such as [3, 5, 6, 12, 13, 21]. But there are several researches have been done in using type-2 fuzzy in economy mostly related to stock market in [7, 9, 14, 15, 16]. There are still no research has been done in measuring the size of UE using T2 FLS except by using T1 FLS in [1, 17, 18, 19, 20]. We will use two major factors that affects the size of UE, tax rate (TR) and government regulation (GR) because these two factors gives the biggest impact in the size of UE for the period 2001 until 2010.
~ Definition 1. A type-2 fuzzy set A is characterized by a type-2 membership function μ A~ ( x, u ) where x ∈ X and u ∈ J x ⊆ [0,1] , [6], ~ A = {(( x, u ), μ A~ ( x, u )) | ∀x ∈ X , ∀u ∈ J x ⊆ [0,1]} (1) where 0 ≤ μ F~ ( x, u ) ≤ 1 and is typically written as ~ A = ∫ ∫ μ ( x, u ) / (x, u ) J x ⊆ [0,1] x∈X u∈J x
where
∫∫
(2)
denotes union over all admissible x and u.
From (1) and (2), J x ∈ [0,1] is a restriction that is equivalent to 0 ≤ μ A ( x ) ≤ 1 for ~ type-1 membership functions and J x denotes primary membership of A where J x ⊆ [0,1] for x ∈ X . Definition 2. The IT2 FLS can be expressed as [6],
Interval type-2 fuzzy logic system model
~ A=∫
∫
x∈X u∈J x
5073
J x ⊆ [0,1]
1 / ( x, u )
(3)
where the position of μ ( x, u ) in (2) is replaced by 1. When all μ A~ ( x, u ) = 1 then ~ A is an interval T2 FS (IT2 FS). There exists an uncertainty in the primary ~ membership of a type-2 fuzzy set A consists of a bounded region known as footprint of uncertainty( FOU) as in figure 1. ~ Definition 3. There are two type-1 membership functions that bound the FOU( A ) that is lower membership function(LMF) denoted by μ A~ (x ), ∀x ∈ X and upper
membership function denoted by μ A~ ( x ), ∀x ∈ X , [6], ~ μ A~ (x ) ≡ FOU A ∀x ∈ X and ~ μ A~ (x ) ≡ FOU A ∀x ∈ X
()
(4)
()
(5)
for an IT2 FS J x = [ μ A~ ( x ), μ A~ ( x )], ∀x ∈ X
(6)
1
0.9
0.8
0.7
Upper Membership Function
0.6
0.5
0.4
FOU
0.3
0.2 Lower Membership Function
0.1
0
0
1
2
3
4
5
6
7
8
9
10 x
Figure 1: The shaded area is called the footprint of uncertainty (FOU).
2 Designing the IT2 FLS Model for UE Fuzzy logic is a technique that can be used in dealing with human reasoning and decision making processes which involves inexactness, approximation, uncertainty, ambiguity, inaccuracy, vagueness, perception, subjectivity or sources of imprecision that are non-statistical in nature and this includes measuring the IV of UE. UE are something that involves with uncertainty and an inexact value. The IT2 FLS model is developed and designed to find the UE IV. The IV reflects as the indicator whether any people will evade or pay tax and follow the regulations. The fuzzy logic system consists of four components namely fuzzifier, inference engine, rule based and defuzzifier and for IT2 FLS there is an additional component that is type-reducer [6]. Figure 2 shows the control mechanism or a model for the IT2 FLS in UE.
5074
Abd. Fatah Wahab et al.
IT2 FS TR and GR in (%)
INFERENCE ENGINE
IT2 FS TR and GR in (%)
TR and GR in (%) TYPE-REDUCER
FUZZIFIER RULE BASE
DEFUZZIFIER IV < 0.5 → pay IV = 0.5 → neutral
UE IV
IV > 0.5 → evade
Figure 2: A model for IT2 FLS in UE The steps of the model are summarized below: 1) Crisp Input Values: Input the crisp value of the TR (%) and GR (%). 2) Fuzzification: The degree of membership of TR and GR is determined through the use of membership functions that are defined for each linguistic and causal variable (figure 3) for each year. The linguistic term as in figure 3 can be represent by derive the membership functions for each linguistic term using the formulation in table 2. 3) Firing the rule bases: From the value of fuzzy membership functions (figure 5 and figure 6), the rules from table 3 are applied. 4) Execute the inference engine: Apply the MIN and MAX operator (table 4). 5) Type-reducer: Calculate the type-reducer using the membership function in figure 4 and apply the Enhanced Karnik Mendel Algorithm (EKMA). 6) Defuzzification: Apply defuzzification process to find the IV. 7) Crisp output decision: Determine the decision that will be make by tax payer whether to pay or evade from paying tax as in figure 2.
3 Build the Membership Functions for UE In measuring the IV of UE in Malaysia, we will use two causal variables that are believed to be the main reason of UE activities that is TR and GR. However, the choice of the causal variables is subjective. The TR is the ratio of total tax revenue to gross domestic product (GDP) while the GR is the ratio of government regulation to GDP as in [20]. We will use the moving average process to find the ‘normal’ value for the year 2001. A minimum of 6 years data are used in the moving average process to take account of a possible electoral data [17, 18] and the data are gain from International Monetary Fund, Government Finance Statistics Yearbook and data files, World Bank and OECD GDP estimates.
Interval type-2 fuzzy logic system model
5075
Hence, for the normal value of the year 2001 the year related is from the period of 1995 until 2000 and for the year 2002 the year that associated with it is the year 1995 until 2001 and the same step is done until the year 2010. Next, we will created a scale or boundaries of the linguistic terms and determined the levels of it as “Very Low”, “Low”, “Normal”, “High” and “Very High”. The size of the UE are also translated in a linguistic terms to “Very Small”, “Small”, “Medium”, “Big” and “Very Big” as shown in table 1. This linguistic term is associated with the membership function and these linguistic terms boundaries are also subjective. Then, we have to assign the associated values with the subjective levels for both of the variables for each year. This process involves calculating the value of the associated levels using the standard deviation (SD) around the normal value in each year as been summarized in the table 1.
Tax Rate (TR) Very Low ~ VL ~ − 2SD
Low ~ L ~ − SD
Normal ~ N ~ M
High ~ H ~ + SD
Very High ~ VH ~ + 2SD
Government Regulation (GR) Very Low ~ VL ~ − 2SD
Low ~ L ~ − SD
Normal ~ N ~ M
High ~ H ~ + SD
Very High ~ VH ~ + 2SD
Underground Economy (UE) Very Small ~ VS
Small ~ S
Medium ~ M
Big ~ B
Very Big ~ VB
Table 1: Level of TR, GR and UE for IT2 FLS. VL
L
N
H
M-2SD
M-SD
M
M+SD
VH
1
0.9
0.8
0.7
u(x)
0.6
0.5
0.4
0.3
0.2
0.1
0 M+2SD
Figure 3: Membership functions of TR and GR
5076
Abd. Fatah Wahab et al.
VS
1
S
B
M
VB
0.9
0.8
0.7
y
0.6
0.5
0.4
0.3
0.2
0.1
0
0
0.1
0.2
0.3
0.4
0.5 x
0.6
0.7
0.8
0.9
1
Figure 4: Consequent membership functions of TR and GR
μVL~ ( x ) = 1.0 ~ ~ ~ ~ M − SD − x M − SD − x , μVL~ ( x) = ~ ~ VL SD SD ~ ~ ~ ~ x − M − 2SD x − M − 2SD μ ~ ( x) = , μ L~ ( x) = ~ ~ L SD SD ~ ~ M −x M x − μ ~ ( x) = ~ , μ L~ ( x) = ~ L SD SD ~ ~ x − M + SD x − M + SD μ ~ ( x) = , μ N~ ( x) = ~ ~ N SD SD ~ ~ ~ ~ M + SD − x M + SD − x μ ~ ( x) = , μ N~ ( x) = ~ ~ N SD SD ~ ~ x−M x−M μ ~ ( x) = ~ , μ H~ ( x) = ~ H SD SD ~ ~ ~ ~ M + 2SD − x M + 2SD − x μ ~ ( x) = , μ H~ ( x) = ~ ~ H SD SD ~ ~ ~ ~ x − M − SD x − M − SD μ ~ ( x) = , μVH~ ( x) = ~ ~ VH SD SD
μ ~ ( x) =
μVH~ ( x) = 1.0
~ ~ if x ≤ M − 2SD
_
~ ~ ~ ~ if M − 2SD ≤ x ≤ M − SD ~ ~ ~ ~ if M − 2SD ≤ x ≤ M − SD ~ ~ if M − SD ≤ x ≤ M if
~ ~ ~ M − SD ≤ x ≤ M
if
~ ~ ~ M ≤ x ≤ M + SD
if
~ ~ ~ M ≤ x ≤ M + SD
if
~ ~ ~ ~ M + SD ≤ x ≤ M + 2SD
if
~ ~ ~ ~ M + SD ≤ x ≤ M + 2SD
if
~ ~ x ≥ M + 2SD
___________________________________________________________________________________________________
Table 2: Membership functions associated values
3.1 Fuzzification of TR and GR The IT2 FLS form of the membership function and the fuzzification for TR and the GR is
Interval type-2 fuzzy logic system model
VL
L
1
5077
H
N
VH
X: 17.79 Y: 0.8561
0.9
0.8
0.7 X: 17.79 Y: 0.5869
u(x)
0.6
0.5
0.4
X: 17.79 Y: 0.4131
0.3
0.2
X: 17.79 Y: 0.1439
0.1
0 10
12
14
16
18
20
22
24
Tax Rate (%)
Figure 5: Fuzzification of TR for the year 2001
VL
1
L
N
H
VH
X: 12.04 Y: 0.8556
0.9
0.8
0.7
u(x)
0.6
X: 12.04 Y: 0.5201
0.5 X: 12.04 Y: 0.4799
0.4
0.3
0.2
X: 12.04 Y: 0.1444
0.1
0
8
9
10
11 Government Regulation (%)
12
13
14
Figure 6: Fuzzification of GR for the year 2001
Figures 5 and figure 6 show the membership function and the fuzzification process for IT2 FLS. The difference between IT2 FS and T1 FS is there is more intersection point for IT2 FS because of their nature of membership function.
3.2 IT2 FLS Model Rule Based
All the process and the rules for the IT2 FLS are remains exactly the as T1 FLS, but some or all the FSs involved are type-2. Here, we also assume the consequent and antecedent of the fuzzy sets in the rule are type-2. From table 1, because now we deal with IT2 case, the symbol “~” above all the linguistic terms and SD that is used denotes IT2 fuzzy variable. In IT2 case, the way to express the rule no.1 is
~ ~ ~ If TR is VL and REG is VL then UE is VS
5078
Abd. Fatah Wahab et al.
Rule 1 2 3 4 5 6 7 8 9 10 11 12 13 14 15 16 17 18 19 20 21 22 23 24 25
TR ~ VL ~ VL ~ VL ~ VL ~ VL
~ L ~ L ~ L ~ L ~ L ~ N ~ N ~ N ~ N ~ N ~ H ~ H ~ H ~ H ~ H ~ VH ~ VH ~ VH ~ VH ~ VH
REG ~ VL
~ L ~ N ~ H ~ VH ~ VL ~ L ~ N ~ H ~ VH ~ VL ~ L ~ N ~ H ~ VH ~ VL ~ L ~ N ~ H ~ VH ~ VL ~ L ~ N ~ H ~ VH
UE ~ VS ~ VS ~ S ~ S
Degree 1 1 1 1
~ M ~ VS ~ S ~ S ~ M ~ S ~ S ~ S ~ M ~ B ~ S ~ S ~ M ~ B
0.8 0.8 1 0.8 1 0.8 1 0.8 1 0.8 1 0.8 1 0.8
~ B
1
~ VB ~ M ~ B ~ B ~ VB ~ VB
0.8 0.8 1 1 1 1
Table 3: IT2 FLS model rule based
3.3 MIN and MAX Process for IT2 FLS Model From the fuzzification process in figure and figure the fuzzy value of TR and GR is 2001 N
H
[0.586867,0.856052]
[0.143948,0.413133]
H
VH
[0.520133,0.855556]
[0.144444,0.479867]
TR
GR
Interval type-2 fuzzy logic system model
5079
The possible combination of rule from above is N/H, N/VH, H/H and H/VH No
Activated Rules
TR/GR=UE level (degree)
degree(MIN [TR, TR], [GR, GR] )
MAX
1
14
N/H = B(0.8)
([0.586867,0.856052], [0.520133,0.855556])
[0.4161064, 0.6844448]
2
15
N/VH = S(1.0)
([0.586867,0.856052], [0.144444,0.479867])
[0.144444, 0.479867]
3
19
H/H = B(1.0)
([0.143948,0.413133], [0.520133,0.855556])
[0.143948, 0.413133]
4
20
H/VH = VB(0.8)
([0.143948,0.413133], [0.144444,0.479867])
[0.1151584, 0.3305064]
Table 4: MIN and MAX operator process for IT2 FLS In table 4, column two shows the rule that will be activated from the fuzzification process of TR and GR for the year 2001. For example, the expression for rule 14 is “If Tax Rate is Normal and Government Regulation is High then UE is Big with degree 0.8”. In the third column of table 5.4, TR and GR denotes the lower bound of TR and GR while TR and GR denotes the upper bound of TR and GR respectively. The MIN operator here is applied between TR and GR and between TR and GR . For rule 14, the min value between TR and GR is 0.520133 and the min value between TR and GR is 0.855556 and these values is multiplied with the degree of that particular rule resulting with the value in 0.4161064 and 0.6844448 respectively. On the last column, the outcome would be four possible values in the form of interval. In this column we will applied the MAX operator among rules with the same UE level. From table 4, there are two rules with the same UE levels of B. The B levels cannot be true simultaneously, therefore we will choose the max value between TR and GR and between TR and GR . The B level with the interval value [0.4161064, 0.6844448] is choose and B level with the interval value [0.143948, 0.413133] is dropped (the bold value). N
1
H
1
B
1
u(x)
MIN x 0.8
0.5
0.5
0
0
10
12
14
16
20
22
24
N
1 u(x)
18
0 8
9
10
11
12
0.5
13
14
0
VH
1
0.2
0.4
0.6
0.8
0.4
0.6
0.8
1
S
1
0.5
0.5 MIN
0 10
0 12
14
16
18
20
22
24
H
1
0 8
9
10
11
12
14
0
VH
1
0.5
13
0.2
0.5
1 VB
1 0.5 MIN x 0.8
0 10
0 12
14
16
18 TR (%)
20
22
24
0 8
9
10
11
12
13
14
0
0.2
0.4
0.6
0.8
1
0.6
0.8
1
1
GR (%)
MAX
u(x)
u(x)
0.5
0.5 0 0
0.2
0.4
x
AGGREGATION OF CONSEQUENTS
Figure 7: MIN and MAX process for IT2 FLS
5080
Abd. Fatah Wahab et al.
Figure 7 shows illustratively how the MIN and MAX process for IT2 FLS model takes places. The first column is the membership function of TR, the second column is the membership function of GR, and the last column is the aggregation of the three consequents.
3.4 Type-reducer in UE The form of interval indicates that the uncertainty is hidden between the intervals. Before we can find the crisp value between the intervals, first we have to reduce the IT2 FS to T1 FS. The type-reduction method has been well developed by Karnik and Mendel in [8]. We will use the EKMA as [4] for our type-reducer method as its effectiveness has been proven and have been used widely. Aggregation Of Consequents 1
0.9
0.8
0.7
u(x)
0.6
0.5
0.4
0.3
0.2
0.1
0
0
0.1
0.2
0.3
0.4
0.5 x
0.6
0.7
0.8
0.9
1
Figure 8: The AOC that is discretized into ten partitions
After the consequents are aggregated in figure, the aggregation of consequents (AOC) is then discretized into ten partitions as in figure 8. The finer the AOC is discretized, the result will be more accurate and the computational cost will be higher. The next step is to apply the EKMA to figure 8. Aggregation Of Consequents 1 X: 0.4441 Y: 1
X: 0.6723 Y: 1
0.9
0.8
0.7
u(x)
0.6
0.5
0.4
0.3
0.2
0.1
0
0
0.1
0.2
0.3
0.4
0.5 x
0.6
0.7
0.8
0.9
Figure 9: The switch point for y l and yr .
1
Interval type-2 fuzzy logic system model
5081
In figure 9, the switch point of y l value equal to 0.4441 and yr value is equal to 0.6723 are shown.
3.5 Defuzzification in UE The last step for measuring the UE IV in Malaysia and in FLS is to translate the fuzzy value to a crisp value or we called defuzzification process. The defuzzification process is execute by taking the average of yl and y r . This process can be done because y is an interval set.
Y= hence, from figure 9,
yl + y r 2
0.4441 + 0.6723 = 0.5582 2
The value of 0.5582 is show graphically in figure 10.
Aggregation Of Consequents 1 X: 0.4441 Y: 1
X: 0.5582 Y: 1
X: 0.6723 Y: 1
0.9
0.8
0.7
u(x)
0.6
0.5
0.4
0.3
Crisp Output
0.2
0.1
0
0
0.1
0.2
0.3
0.4
0.5 x
0.6
0.7
0.8
0.9
1
Figure 10: The black dot line represents the crisp value.
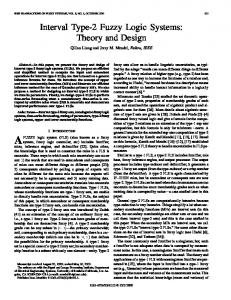
4 Results and Discussion From figures 11, the sizes of the UE in Malaysia gives its highest value or at its peak on the year 2001 with the UE index 0.5582 and its lowest value on 2009 with the UE index of 0.2545. As we can see from Figure 11 and based on the indicators that we have set, a person tends to working openly and above-board on the year 2002, 2003, 2006, 2007, 2009 and 2010 and a person tend towards working ‘underground’ on the year 2001, 2004, 2005 and 2008.
5082
Abd. Fatah Wahab et al.
Size Of UE In Malaysia Using IT2 FLS
1
0.9
0.8
UE Index Value
0.7
0.6
X: 2001 Y: 0.5582
X: 2004 Y: 0.5134
X: 2008 Y: 0.5063
X: 2005 Y: 0.5038
0.5
X: 2010 Y: 0.4291 X: 2003 Y: 0.4365
0.4
X: 2006 Y: 0.393
X: 2007 Y: 0.4201
0.3 X: 2002 Y: 0.3062 X: 2009 Y: 0.2545
0.2
0.1
0 2001
2002
2003
2004
2005
2006
2007
2008
2009
2010
Year
Figure 11: Size of UE in Malaysia using IT2 FLS.
We cannot determine which model or method is better or which method is more precise but what we can say is measuring the UE size by using the IT2 FLS is definitely more accurate than using the T1 FLS. This is support by many researchers and it is proven that IT2 FLS is better than T1 FLS. The IT2 FLS result is much more trustful rather that T1 FLS because of its nature of the membership function with a three dimensional membership function and its ability to model uncertainty directly because of their fuzzy membership function.
References [1] Corina-Maria Ene, Natalia Hurduc, (2010). A Fuzzy Model To Estimate Romanian Underground Economy. Internal Auditing and Risk Management, 2(18), 29-38. [2] E.H. Mamdani, S. Assilian, (1975). An experiment in linguistic synthesis with a fuzzy logic controller. International Journal of Man-Machine Studies, 7(1), 1-13. [3] Dongrui Wu, Woei Wan Tan, (2004). A type-2 fuzzy logic controller for the liquid-level process. Paper presented Proceedings of IEEE International Conference on Fuzzy Systems. [4] Dongrui Wu, Jerry M. Mendel, (2009). Enhanced Karnik-Mendel Algorithms. IEEE Transactions on Fuzzy Systems, 17(4), 923-934.
Interval type-2 fuzzy logic system model
5083
[5] Hani A. Hagras, (2004). A hierarchical type-2 fuzzy logic control architecture for autonomous mobile robots. Fuzzy Systems, IEEE Transactions on, 12(4), 524-539 [6] Jerry M. Mendel, (2001). Uncertain Rule-Based Fuzzy Logic Systems: Introduction and New Directions: Prentice Hall PTR. [7] Juan Carlos Figueroa Garcia, (2009, 11-14 Oct. 2009). An evolutive Interval Type-2 TSK Fuzzy Logic System for volatile time series identification. Paper presented at the IEEE International Conference on Systems, Man and Cybernetics, 2009. SMC 2009. [8] Nilesh N. Karnik, Jerry M. Mendel, (2001). Centroid of a type-2 fuzzy set. Information Science, 132(1-4), 195-220. [9] Kunhuang Huarng, Hui-Kuang Yu, (2005). A Type 2 fuzzy time series model for stock index forecasting. Physica A: Statistical Mechanics and its Applications, 353(0), 445-462. [10] L.A. Zadeh, (1965). Fuzzy sets. Information and Control, 8(3), 338-353. [11] L.A. Zadeh. (1975). The concept of a linguistic variable and its application to approximate reasoning-Part I-II-III Information Science, 8, 8, 9, 199-249, 301-357, 143-180. [12] Liang Qilian, , Jerry M. Mendel, (2000). Equalization of nonlinear time-varying channels using type-2 fuzzy adaptive filters. Fuzzy Systems, IEEE Transactions on, 8(5), 551-563 [13] Liang Qilian, Jerry M. Mendel, (2000). Interval type-2 fuzzy logic systems: theory and design. Fuzzy Systems, IEEE Transactions on, 8(5), 535-550. [14] M.H. Fazel Zarandi, E. Neshat, I. B. Turksen, B. Rezaee, (2007, 23-26 July (2007). A Type-2 Fuzzy Model for Stock Market Analysis. Paper presented at the IEEE International Fuzzy Systems Conference. [15] M.H. Fazel Zarandi, B. Rezaee, I. B. Turksen, E. Neshat, (2009). A type-2 fuzzy rule-based expert system model for stock price analysis. Expert Systems with Applications, 36(1), 139-154. [16] N. S. Bajestani, A. Zare, (2009, 17-18 Feb. 2009). Application of optimized Type 2 fuzzy time series to forecast Taiwan stock index. Paper presented at the 2nd International Conference on Computer, Control and Communication, 2009. IC4 2009.
5084
Abd. Fatah Wahab et al.
[17] Robert Draeseke, David E. A Giles, (1999). A Fuzzy Logic Approach to Modelling the Underground Economy: Department of Economics, University of Victoria. [18] Robert Draeseke, David E. A Giles, (2002). A fuzzy logic approach to modelling the New Zealand underground economy. Mathematics and Computers in Simulation, 59(1–3), 115-123 [19] Samaneh Talee Ardakani, Rasool Bakshi Dastjerdi, Azadeh Saadat Khah, (2011). Modeling Iran's Underground Economy (1976-2007) using Fuzzy Logic. 2, 1(1), 122-147. [20] Tiffany Hui-Kuang Yu, David Han-Min Wang, Su-Jane Chen, (2006). A fuzzy logic approach to modeling the underground economy in Taiwan. Physica A: Statistical Mechanics and its Applications, 362(2), 471-479. [21] Turhan Ozen, Jonathan Mark Garibaldi (2003). Investigating Adaptation in Type-2 Fuzzy Logic Systems Applied to Umbilical Acid-Base Assessment. Paper presented at the Proc. the 2003 European Symposium on Intelligent Technologies (EUNITE 2003), Oulu, Finland. Received: June 14, 2013