We present a probabilistic stick-figure model that uses a nonparametric Bayesian distribution over trees for its struc- ture prior. Sticks are represented by nodes ...
Learning stick-figure models using nonparametric Bayesian priors over trees Edward W. Meeds, David A. Ross, Richard S. Zemel, and Sam T. Roweis Department of Computer Science University of Toronto {ewm, dross, zemel, roweis}@cs.toronto.edu
Abstract We present a probabilistic stick-figure model that uses a nonparametric Bayesian distribution over trees for its structure prior. Sticks are represented by nodes in a tree in such a way that their parameter distributions are probabilistically centered around their parent node. This prior enables the inference procedures to learn multiple explanations for motion-capture data, each of which could be trees of different depth and path lengths. Thus, the algorithm can automatically determine a reasonable distribution over the number of sticks in a given dataset and their hierarchical relationships. We provide experimental results on several motion-capture datasets, demonstrating the model’s ability to recover plausible stick-figure structure, and also the model’s robust behavior when faced with occlusion.
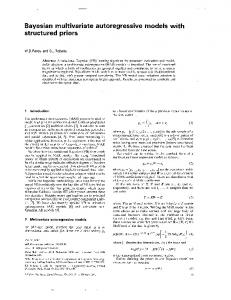
Figure 1. Two frames of a stick-figure model learned automatically on a giraffe motion-capture dataset. Marker data with the same color and symbol belong to the same stick. We use a probabilistic stick-figure model that can automatically learn the number of sticks and their relationships in a tree.
1. Introduction 1.1. Learning stick-figure models A fundamental challenge that arises when analyzing visual sequences is the problem of describing the motion of non-rigid objects. One approach, common when dealing with human motion, is to fit the data with an articulated kinematic model, or “stick-figure”, composed of a number of rigid parts connected by flexible joints. The structure of a stick-figure—the shape of each body part or “stick” and the connectivity between them—remains fixed across time, while motion is encoded as a sequence of pose parameters– the joint angles between connected sticks–permitted to vary at each timestep. The joint angles derived from a stick-figure provide a more-parsimonious representation of the data, suitable for higher level modeling of human and animal activities (in part due to its invariance to global transformations of the data). For example, stick-figure models are used to convert feature positions obtained from optical motion-capture to joint angles, which can be used to animate computer generated characters.
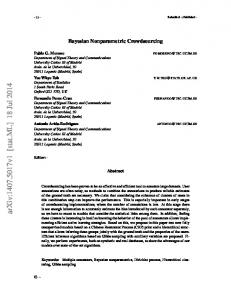
Figure 2. Stick-figure models inferred for a 4-joint articulated arm. Sticks are differentiated by colored circles at their distal endpoints representing child node translation uncertainty; marker association is indicated by color and symbol. The first two rows show two stable modes: one using 3 joints, and the more frequent (and correct) mode using 4 joints. The bottom left figure is a frame reproduced from the second row. Uncertainty over node parameters permits multiple hypotheses for explaining the marker data. Averaging over these hypotheses produces the predictive log-likelihood shown at bottom right.
In some carefully controlled settings, such as human motion-capture, the structure of a stick-figure may already be known, however, in general, this structure must be identified from the data. A reasonable approach is to limit the search to trees, where each node represents a stick, and each 1
edge a joint between them. Trees allow for a fully connected figure, while still permitting efficient (non-loopy) inference of joint angles. Typical approaches [16, 5, 12] involve segmenting the visual features into parts, and then solving for connectivity using a minimum spanning tree. Although efficient, this approach has a number of drawbacks. First, greedily solving for segmentation before connectivity will not in general produce a globally optimal structure. Moreover, since real bodies exhibit a larger range of flexibility than stick-figures, it is likely that no single structure can accurately model the data. Both of these concerns may be addressed by adopting a Bayesian approach. By specifying a prior over stick-figures, samples can be drawn from the joint posterior distribution over structures and parameters, allowing us to explore (and base inferences upon) the full range of suitable stick-figure models for a given data sequence. Examples of learned stick-figures are shown in figures 1 and 2.
1.2. Nonparametric Bayesian models and priors over trees Bayesian methods facilitate a principled manner of handling uncertainty, as well as side stepping the problem of overfitting and incorporating domain knowledge. Most parametric models are too limited to model complex, real world problems, thus interest has shifted to nonparametric models which can capture richer, more complex probability distributions. One of the primary tools for robust nonparametric density estimation is the infinite mixture model [11] based on the Dirichlet process [3]. These models are popular because they are only slightly more complicated to implement that finite-sized mixture models with Dirichlet distribution priors, but are able to effectively treat K, the number of components in the mixture, as a nuisance parameter. Thus, these nonparametric Bayesian models can handle both uncertainty over component parameters, but also the number of components. Dirichlet process mixture models (DPMs) have been successfully applied to document modeling [13] and bioinformatics [15]. Given these properties, DPMs seem ideally suited for grouping visual features into sticks. However, DPMs are fundamentally limited in flexibility because they are essentially “flat” mixtures—cluster parameters are independent from each other. This limitation prevents adjoining stick nodes from being related, and is ruinous for learning stickfigure structures. Because markers at a stick node are close to markers from the stick node’s “parent” and “children” nodes, it would be useful to capture these relationships with a tree structure. To do this we use a novel nonparametric Bayesian prior over trees to learn the underlying stick-figure structure. A tree sampled from this prior is not restricted by depth and can have variable path lengths—it is a natural data generating process for stick-figure applications.
The remainder of the paper is organized as follows. In section 2.1 we describe the generative model for stickfigures and in section 2.2 the generative model for the nonparametric Bayesian prior over trees. This is followed in section 3.1 by inference procedures for node indicators and tree structures, and in section 3.2 for the stick-figure parameters. Experimental results and discussion follow in sections 4 and 5.
2. The generative model 2.1. A probabilistic stick-node model 2.1.1
Data model
Each data vector xi is a trajectory of F 2-dimensional marker positions. In other words, a data-vector is the sequence of locations of a single marker over F time frames. Each vector has a time-invariant location yi on the sticknode (hereafter, stick will refer to a stick node) to which it is associated (indicated by a variable ci ) (figure 3A). The prior over node indicators is the nonparametric Bayesian tree prior proposed in section 2.2. The portion of the data vector at time f is generated by first sampling from a spherical Gaussian distribution centered at its time-invariant location yi , and then rotating and translating this vector into world coordinates (figure 3B): yi
∼
Gaussian (Lk /2, Σky )
(1)
xif
∼
Gaussian (Rkf yi + Tkf , I/skx )
(2)
where Σky is a diagonal matrix with entries 1/skyh and 1/skyv , and Lk is a horizontal length vector (we have implicitly conditioned on the setting ci = k). 2.1.2
Stick parameters
A stick is represented by a set of parameters at a node in the tree. The main set of parameters are rotations and translations over time. The model generates data in a timeinvariant representation and then translates and rotates them into world coordinates. Figure 3 shows a schematic representation of the stick model for the time invariant parameters (3A) and parameters in world coordinates (3B). The set of time invariant parameters for node k includes the length vector Lk , the horizontal precision for time invariant data locations skyh , the vertical precision for time invariant data locations skyv , and the precision for data locations at each time frame skx . The other node parameters are the precision of the node joint skT , where child node translation points are sampled, and a set of translation points {Tk1 , . . . , TkF } and rotation angles {θk1 , . . . , θkF }. Therefore φk = {Lk , skyh , skyv , skx , skT , Tk1 , . . . , TkF , θk1 , . . . , θkF }. Precisions skyh , skyv , skx , skT are given Gamma priors with fixed shape and inverse-scale parameters. The remaining node base distribution is the product of the following distributions (conditioned on the parent node ρk and other
2.2. A nonparametric Bayesian prior over trees This section describes a nonparametric Bayesian prior over trees of non-fixed depth and path lengths. The generative process for a tree is very similar to mixture models using a Chinese restaurant process (CRP) prior [10]. This prior is very flexible because it can generate trees with a variable number of nodes and paths of different lengths.
(A) Time-invariant stick in local coordinates.
2.2.1
(B) A two-stick tree at time frame f in world coordinates. Figure 3. Schematic description of the stick-figure model. (A) Time-invariant stick node in local coordinates. A stick labeled k is represented by a horizontal vector Lk . Time invariant data locations y1 and y2 are sampled from a Gaussian distribution centered at Lk /2 and with vertical precision skyh and horizontal precision skyv . At each time frame, data are generated from a spherical Gaussian with precision skx . Stick length is set deterministically √ by the horizontal precision Lk = [6/ skyh , 0]. (B) A chain of two sticks at time frame f in world coordinates. Stick 1 is attached to the root and stick 2 is attached to stick 1. The data associated with stick 1, x1 and x2 , are put into world coordinates by rotating samples from the local coordinate model by angle θ1f . The translation point for stick 2 at time f , T2f , is a sample from a spherical Gaussian centered at the distal endpoint of stick 1.
parameters and hyperparameters, omitted due to space restrictions): G (Tkf ) = Gaussian (Rρk f Lρk + Tρk f , I/skT )
(3)
G (θk1 ) = vonMises (θρk 1 , κρ )
(4)
G (θkf ) = vonMises (θkf −1 , κnd ) vonMises (θρk f , κρ ) (5) »
where Rρk f =
cos θρk f sin θρk f
− sin θρk f cos θρk f
–
. Thus, Θ =
{asx , bsx , asyh , bsyh , asyv , bsyv , asT , bsT , κρ , κnd }. The variables a and b are shape and inverse scale parameters for Gamma distributions. The von Mises, or circular normal distribution, is used to model angles: vonMises (θ|θ0 , κ) =
exp (κ cos (θ − θ0 )) 2πI0 (κ)
(6)
where κ > 0 is the precision, θ0 ∈ [0, 2π] is the mean or center of the distribution, and I0 (κ) is the modified Bessel function of the first kind of order 0, with parameter κ. For large κ, the von Mises distribution becomes approximately Gaussian, with mean θ0 and precision κ, and for small values of κ it becomes approximately uniform on [0, 2π].
Generation of node and data locations
Data and node locations are generated using a simple sequential procedure much like the Polya urn scheme [1] or the CRP [10]. A single parameter λ, called the growth parameter, controls the number of nodes in the tree, and plays exactly the same role as the concentration parameter α in Dirichlet process mixture models. Before detailing the generative process, we briefly introduce the notation. Each data vector xi , in a data set indexed from 1 to I, has associated with it an indicator variable ci taking on values between 1 and K, representing the node to which it belongs in the tree. This is the equivalent of a cluster indicator variable in a Dirichlet process mixture model. Each node has a set of parameters φk , and data are generated from the data model of its node, F (φci , Θ). Node parameters φk are generated from its base distribution G which is centered around its parent node ρk . Both distributions may depend on a set of global hyperparameters Θ. The set of indices in the set {1, . . . , I} that have ci = k is called a node set and is denoted as Ck . The set of indices h ∈ {1, . . . , K} that have ρh = k (the child nodes of node k) is called the child set Hk . We use | · | to indicate the size of a set. Initially, a tree consists of a root node, which should be thought of as the base distribution and no data are ever associated with it. Just as with Dirichlet process mixtures, the first data vector is associated with a new node, drawn iid from the root node’s model distribution, with probability 1. Subsequent data vectors are generated by first sampling values for ci , then generating the data vector from the data model distribution at that node, F (φci , Θ). Occupied nodes are chosen with probability proportional to the number of data associated with them. A new node is chosen as a child node of either the root or one of the occupied nodes, with each of these K + 1 possible parent nodes having probability proportional to λ/(K + 1) of being chosen. 1 , where here k can In other words, P (ρK+1 = k) = K+1 also be 0 for the root. A new node is therefore chosen with probability proportional to λ and its parent node is chosen uniformly from the union of the set of occupied nodes and the root node. Note how this generative process is similar
to the Polya urn scheme: nk (7) λ+i−1 λ (8) P (ci = K + 1|λ, c1 , . . . , ci−1 ) = λ+i−1 P (xi |φci , Θ) = F (xi |φci , Θ) (9) ` ´ ` ´ P φK+1 |φρK+1 , Θ = G φK+1 |φρK+1 , Θ (10) P (ci = k|λ, c1 , . . . , ci−1 ) =
where nk = |Ck |. We have conditioned on possible hyperparameters Θ for both the data model and the node parameter model. This process implies that the nodes are labeled in order of their inclusion in the tree. Figure 4 shows an example of a tree with 7 data points, and the predictive distribution for the 8th data point. Finally, the order of the data-vectors is randomly permuted. 2.2.2
Another view of the generation process
To better understand this prior we describe an alternative generative process which produces the same tree structures as described in the previous section. Start by partitioning integers 1, . . . , I into node sets {C1 , . . . , CK } using the Polya urn scheme with parameters λ and I, thus determining {c1 , . . . , cI }. Nodes are added to the tree by choosing the first cluster indicator variable from the ordered set {c1 , . . . , cI }. The node is added as a child node of one of the nodes already in the tree, picked uniformly at random. Once a node has been added, the cluster indicators from the added node are removed from the ordered set and the cluster indicator at the first position is used to select the next node to be added. For example, if C1 = {1}, C2 = {2, 5}, C3 = {3, 7}, C4 = {4}, and C5 = {6}, then after c1 is added to the tree, the remaining set of cluster indices is {c2 , c3 , c4 , c5 , c6 , c7 }. Next the cluster set containing index 2, C2 , is added, leaving the indices {c3 , c4 , c6 , c7 }. The remaining cluster sets are then added in order: C3 , C4 , and C5 . Finally, the order of the data vectors is randomly permuted. 2.2.3
Finite exchangeability
Because the prior generates data then randomly permutes their order, the marginal distribution of any data vector in a fixed sized dataset will be the same, but datasets of different sizes will have different marginal distributions. Therefore the prior definitely does not generate infinitely exchangeable datasets. We argue, however, that the prior generates exchangeable data for a fixed, finite dataset of size I. Since the generative process randomly permutes the order of the data vectors after it generates them, we know that there is an order to the data but we must search over all possible orderings in our inference procedure. Instead of showing that we are searching over all permutations, we can show that we are searching in the space of equivalence classes (i.e. the order
Figure 4. Generation of a tree structure using a nonparametric Bayesian prior over trees (root not shown). The tree is shown after 7 data vectors have been sampled and partitions into C1 = {1}, C2 = {2, 5}, C3 = {3, 7}, C4 = {4}, and C5 = {6}. We indicate at each occupied node the probability c8 = k. The possible locations of new nodes are shown as leaf nodes attached to each of the occupied nodes and the root. Each node including the root has equal probability of being the parent node of a new node. Data are shown as small dark circles along with their index. See text for more details of the generative process.
of indicators at a node is irrelevant). Suppose, though, that we are interested in keeping track of the order of the indicators, along with the actual indicator values. In such a case, one could implement a proposal mechanism that randomly shuffles the order of node indicators before removal from, and insertion to, a node. This shuffling procedure is equivalent to ignoring the order of the indicators at each node, thus searching in the space of equivalence classes. If the current node is an internal singleton then its current node is the only location which is consistent with the tree structure. Therefore special consideration must be given to internal singletons during inference.
3. Inference procedures Using the aforementioned generative stick-figure model and tree prior, we adopt the Bayesian approach to fitting a stick-figure to data: inferring the posterior distribution over structures (segmentations & connectivity) and parameters (rotations, precisions, etc.). Due to the complexity of the model, the posterior cannot be obtained analytically via Bayes’s rule. Instead, samples from the posterior are obtained via Markov chain Monte Carlo, integrating over model parameters wherever possible. This approach has a number of advantages over fitting a single maximum likelihood model to the data. First, by capturing uncertainty in the structure and parameters, we avoid the problems of overfitting. Also, model selection is achieved naturally via inference, as a result of the non-parametric prior. Finally, unlike greedy approaches which first solve for structure before fitting parameters [16], MCMC inference takes a holistic approach: current estimates of model parameters can be leveraged when reestimating structure and vice versa.
3.1. Learning tree structures The tree structure is implicitly defined by the node indicators. For this reason the most important tree structure updates occur via Gibbs sampling of node indicators. However, Gibbs updates can only produce small, local changes to the tree structure. We therefore supplement Gibbs with Metropolis-Hastings proposals for splitting, merging, and moving sub-trees, allowing the Markov chain to escape local minima and speed up the search over plausible model structures. 3.1.1
Gibbs sampling node indicators
The Gibbs sampling procedure for node indicators is very similar to Gibbs sampling cluster indicators in nonconjugate Dirichlet process mixture models [7]. The most important difference is the treatment of internal, singleton nodes. Gibbs sampling iterates over node indicators and treats each as the Ith data point. For singletons this means that current component parameters are discarded. For the tree prior, however, removing internal singletons violates the order of nodes in the tree, so the state of those node indicators must remain the same. For the other node indicators, including leaf singletons, the procedure is the same as for Dirichlet process mixtures. In general, if the current node for ci has nci > 1, then ci can legally be removed and treated as the Ith point. For k ∈ {1, . . . , K} the probability of choosing a node is n−i,k F (xi |φk , Θ) (11) P (ci = k|c−i , λ, xi , φ) ∝ λ+I −1 To handle new nodes (k > K), all nodes in the tree temporarily instantiate a child node, and have prior weight λ/(K + 1):
other. Likewise, merges can be made between two nodes having the same parent, or between two nodes in a chain. This algorithm uses an elaborate procedure to compute the Metropolis-Hastings acceptance ratio, but it is powerful because it asks: if we only focus on these nodes and data, does the data prefer a single node, or a split into two nodes? The acceptance ratio simplifies significantly because all the node parameters, and data, not involved in the proposal, cancel. Further details of how to compute the acceptance ratio can be found in [4]. If the proposal is rejected, the old parameters replace the parameters computed during the restricted Gibbs iterations, otherwise the tree is updated appropriately.
3.1.3
Sub-tree moves
We also perform Metropolis-Hastings updates on sub-tree positions. The procedure is similar to the split-merge proposals. A root of a sub-tree is chosen with probability proportional to the number of data associated with it. We propose moving it from its current parent node and attaching it as the child of some other node in the tree, excluding all nodes in the sub-tree. Computing the probability of these moves is efficient because it only requires updates to, and density evaluations for, the node parameters (the marker data do not change node locations).
3.2. Inferring stick-figure parameters Node parameters can be updated using Gibbs sampling that conditions on the data, the parent node parameters, the child node parameters, and the hyperparameters. The data likelihood for occupied nodes is computed by integrating out the time-invariant position yi : Z P (xi |φk ) = Gaussian (Lk /2, Σky ) Y × Gaussian (Rkf yi + Tkf , I/skx ) dyi
λ 1 P (ci = k|λ, xi , φ) ∝ F (xi |φk , Θ) K +1 λ+I −1 (12) where φk ∼ G (φρk , Θ). After sampling ci , unused nodes are discarded. If a new node is added, its label is set to K +1 and K is incremented.
f
=
` ´ Gaussian Rk Lk /2 + Tk , Rk Σky Rk> + Σkx (13) ˆ
3.1.2
Split-merge updates
Although Gibbs updates on node indicators can make structural changes to the tree by adding and removing nodes when they become newly occupied or unoccupied, it can only make small changes over many iterations. To complement Gibbs sampling we use split-merge proposals to make large moves in parameter space. Our algorithm adapts the Metropolis-Hastings non-conjugate split-merge algorithm from [4]. A node can be split into two nodes with the same parent, or into two nodes, with one node being the parent of one, and the original parent being the parent of the
ˆ
ˆ > ˜> > , Rk = Rk1 · · · RkF , Tk = 1 = skx I2F ×2F .
> where xi = x> i1 · · · xiF ˜ > > >
Tk1 · · · TkF
, and Σkx
˜>
The likelihood under the Gaussian distribution in equation 13 can be computed efficiently using matrix inversion and determinant lemmas because its covariance matrix is low rank. The likelihood of data vectors at new nodes should ideally be the marginal distribution of the data vector (given a position in the tree). For non-conjugate models, the marginal distribution is usually estimated by sampling a single set of parameters from the prior. This will underestimate the marginal for high dimensional parameter vectors, so we instead average over several samples from the prior, which improves the acceptance probability for new nodes.
3.2.1
Inference: translations
Translation positions can be updated efficiently because the posterior distributions are Gaussians. The translations of stick k depends on its parent’s translation, rotation, and length. Its data and child node translations depends on its translations. The posterior of Tk , conditioned on yi , is therefore proportional to Y
Gaussian (xi | Rk yi + Tk , Σkx )
i∈Ck
×
Y
Gaussian (Tc | Rk Lk + Tk , I/skT )
c∈Hk
×
Gaussian (Tk | Rρk Lρk + Tρk , I/sρk T ) (14)
After some algebra, the following posterior distribution results: Tk ∼ Gaussian (m, Σ)
(15)
where Σ−1 = (nk skx + |Hk |skT + sρk T ) I (16) 1 0 X X m = Σ@skx ∆xi +skT ∆Tc + sρk T ∆Tρk A (17) i∈Ck
c∈Hk
and ∆xi = xi − Rk Lk /2, ∆Tc = Tc − Rk Lk , and ∆Tρk = Tρk + Rρk Lρk . 3.2.2
Inference: rotations
Using the von Mises distribution over angles in the rotations allows us to make conjugate updates during inference. The posterior distribution of the angle at time f for stick k, conditioned on yi , is proportional to
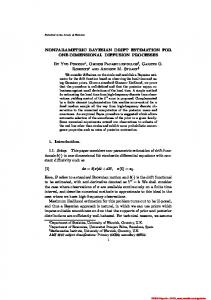
Figure 5. Selected time frames from the datasets used in our experiments (I: the number of data-vectors, F : the number of time frames in each trajectory). From top to bottom: 4-joint articulated arm (I=32, F =33), giraffe (I=58, F =30), walking figure (I=40, F =35). Occlusion experiments are simulated by passing a bar from left to right (red rectangle). Values for occluded markers (green) are imputed during MCMC simulation and are initialized to their closest marker in time.
where we have used superscripts (1) and (2) to index into the first and second elements of 2d vectors. These updates can be derived using trigonometric identities. 3.2.3
Inference: remaining variables
All but the horizontal time-invariant precisions skyh are conjugate to their Gamma priors. Time-invariant precisions can be updated using slice sampling [8]. These updates are no longer conjugate because the length of a stick is function of its horizontal precision. The growth parameter can also be updated using a procedure for updating concentrations in Dirichlet process mixture models [14] or by another technique (e.g. slice sampling).
vonMises (θkf −1 , κnd ) vonMises (θρk f , κρ ) vonMises (θkf +1 , κnd ) Y 3.2.4 × Gaussian (xif | Rkf Lk /2 + Tkf , I/skx )
Inference: summary of learning procedure
Before inference can be started, the user must specify the node hyper-parameters Θ and the tree growth λ (which × Gaussian (Tcf | Rkf Lk + Tkf , I/skT ) (18) could be given a prior and inferred). Once these are set, c∈Hk all stick parameters are inferred by MCMC simulation. At Gathering the terms that involve cos θkf and sin θkf , the each iteration, node indicators are updated by Gibbs samposterior of θkf is sampled using pling, sub-trees are rearranged by split-merge and sub-tree ” “ p 2 2 moves, and finally node parameters–translations, rotations, (19) θkf ∼ vonMises arctan (b, a) , a + b and precisions–are updated. The MCMC simulation gathwhich use the following statistics for parameters: ers samples from posterior distribution of tree structures and X a = κρ (cos θρk f + cos θcf ) + κnd (cos θkf −1 + cos θkf +1 ) node parameters. i∈Ck
Y
c∈Hk
+
X
(1) (1) skx (yi (xif
(1)
(2)
(2)
4. Results
(2)
− Tkf ) + yi (xif − Tkf ))
i∈Ck
We present results on several motion-capture datasets (shown in figure 5 with the number of data vectors and c∈Hk frames used for training). The first dataset is an artifiX b = κρ (sin θρk f + sin θcf ) + κnd (sin θkf −1 + sin θkf +1 ) cially generated articulated arm that has four sticks and four c∈Hk joints. It rotates counter-clockwise from a fixed pivot comX (1) (2) (2) (2) (1) (1) pletely onto itself until it opens up again into an arm. The + skx (yi (xif − Tkf ) − yi (xif − Tkf )) second dataset depicts a giraffe, walking from left to right. i∈Ck X (2) (2) It was obtained by applying a Kanade-Lucas-Tomasi fea+ skT (Lk (Tcf − Tkf )) (21) ture tracker to a video clip, followed by manually cleaning c∈Hk +
X
(1)
(1)
skT (Lk (Tcf − Tkf ))
(20)
Figure 6. Results on the giraffe. The top row shows three different segmentations and stick-figures gathered using an MCMC simulation at the same time frame. The bottom row shows the average predictive distribution for three different time-frames.
Figure 7. Results on the walking man dataset. The top row shows three different segmentations and stick-figures gathered using an MCMC simulation at the same time frame. The bottom row shows the average predictive distribution for three different time frames.
the results. The third dataset, a walking man, was created by orthographically projecting a sequence from the CMU Motion Capture database. Both the giraffe and human data were centered by subtracting the mean from each frame. For each dataset we gather a set of models using a Markov chain Monte Carlo (MCMC) simulation. The experiments also test the robustness of the models when markers are occluded by a vertical bar passing through the frames. Occluded markers are not integrated over explicitly, but are instead imputed at each iteration of the MCMC simulation. For most of the experiments, we use the following hyper-parameter values Θ = {asx = 10, bsx = 1, asyh = 100, bsyh = 1, asyv = 400, bsyv = 1, asT = 100, bsT = 1, κρ = 1, κnd = 1} and λ = 1.
4.1. Results on completely observed markers Figures 2, 6, and 7 show the results on the completely observed datasets. The colored contours in each plot indicate the predictive log-density of data, averaging over all models obtained during MCMC sampling. The contours indicate that, although any one structure may seem to be suboptimal, in aggregate the samples produce a good model. For each dataset, sensible tree structures are inferred. For the giraffe (figure 6), our method finds alternative expla-
Figure 8. Poor local minima without split-merge and subtree moves. In these two models from different MCMC iterations, an interior singleton node (large green circle near root) has a marker (green triangle near toe of front foot) at a very unlikely location. Because this node has child nodes, the marker will remain at this node until simulation moves into a state where it is a leaf node, or it is moved to a more probable location in the tree. Sub-tree and split-merge moves can rearrange the state of the nodes in the tree so that this local minima occurs rarely during the simulation.
Figure 9. Results on occluded articulated arm. The true locations of the occluded data are shown as black markers with white edges. The imputed values are green squares with black edges. The top row is an early model in the MCMC simulation. The bottom row is a stable model which has learned the true structure.
nations for the back and neck. This is due to the limited motion of these markers in the data, thus a single stick can sometimes explain all the back and head markers. For the walking man (figure 7), most models have a stick for both arms and legs, and sometimes a model will explain the feet with an extra stick, but there are not enough feet markers for this to be a stable explanation. In figure 8 a local minima on the walking man is shown. This result can be avoided using split-merge and sub-tree moves.
4.2. Results on occluded markers Figures 9 to 11 show the results on occluded datasets. Despite the noise added by imputing missing values rather than integrating them out of the model, the models are able to converge on structures that are of nearly the same quality as those with completely observed markers. The Bayesian prior over trees provides a mechanism for handling the uncertainty over structures even in the presence of occluded markers. Convergence from unlikely structures to plausible trees is therefore possible (see figures 9 and 10).
5. Discussion and conclusion The tree prior described in this paper is a natural generative model for stick-figure data. The nested Chinese restaurant process (nested CRP) [2] and the Dirichlet diffusion
tation into sticks, are learned automatically. We believe that nonparametric Bayesian priors, including the one we presented, are potential sources of new research in computer vision. For example, Dirichlet processes have recently been applied to the problem of scene decomposition [6]. Our work takes a further step in this direction, proposing a more powerful prior which can model complicated dependent motions.
References Figure 10. Results on occluded giraffe. The top row is an model early on in the MCMC simulation. At this point, the model assumes incorrectly that the front leg is bent backwards, instead of extended forward. The bottom row is a stable model, however, the end of the back leg is not very accurate (last column). This is due to the uncertainty in the stick-figure at the end of the legs (see figure 6).
Figure 11. Results on occluded walking man dataset.
tree (DDT) [9] are other possible nonparametric Bayesian choices for tree structures. Nested CRPs have the advantage that generated data are infinitely exchangeable, but have the disadvantage that the tree depth is fixed. Nested CRPs also permit internal tree nodes to be “empty”, with no data assigned to it, which can be advantageous. However, the tree depth needs to be set carefully: too many, and the model will overfit; too few, and it will underfit. A DDT is a tree with non-discrete branching points that could be adapted to this problem by discretizing branch times and by allowing data to be generated by internal nodes. This version of the DDT would very closely match the nested CRP, and would therefore have similar model selection issues. Improving the rotation prior is one of several areas of future research. The current prior over rotations is very “uninformative”—it does not correspond to naturally smooth movements. On the other hand, its posterior distribution is very accurate because it conditions on the data. Other areas of future research include adapting the model to 3d motion-capture data, learning multiple stick-figures in a scene, and learning the model without marker correspondence through time. We have presented a probabilistic stick-figure model which uses a novel nonparametric Bayesian prior over tree structures. The prior generates structures that naturally handle the uncertainty over hierarchical relationships among sticks and allows variable path lengths. Models recover plausible stick-figure structures and are robust to occlusion events. There are very few parameters to set by hand. The vast majority of variables, including the marker segmen-
[1] D. Blackwell and J. B. MacQueen. Ferguson distributions via Polya urn schemes. The Annals of Statistics, 1(2):353– 355, 1973. [2] D. M. Blei, T. L. Griffiths, M. I. Jordan, and J. B. Tenebaum. Hierarchical topic models and the nested Chinese restaurant process. In NIPS, volume 15. MIT Press, 2003. [3] T. S. Ferguson. A Bayesian analysis of some nonparametric problems. The Annals of Statistics, 1(2):209–230, 1973. [4] S. Jain and R. M. Neal. Splitting and merging for a nonconjugate Dirichlet process mixture model. Technical Report 0507, Dept. of Statistics, University of Toronto, 2005. [5] A. G. Kirk, J. F. O’Brien, and D. A. Forsyth. Skeletal parameter estimation from optical motion capture data. In CVPR, 2005. [6] J. Kivinen, E. Sudderth, and M. Jordan. Learning multiscale representations of natural scenes using Dirichlet processes. In IEEE International Conference on Computer Vision, 2007. [7] R. Neal. Markov chain sampling methods for Dirichlet process mixture models. Journal of Computational and Graphical Statistics, 9:249–265, 2000. [8] R. Neal. Slice sampling. Technical Report 2005, Department of Statistics, University of Toronto, 2000. [9] R. Neal. Density modeling and clustering using Dirichlet diffusion trees. Bayesian Statistics, 7:619–629, 2003. [10] J. Pitman. Combinatorial stochastic processes. Lecture Notes for St. Flour Course, 2002. [11] C. E. Rasmussen. The infinite Gaussian mixture model. In S. Solla, T. Leen, and K.-R. Muller, editors, NIPS, volume 12, pages 554–560. MIT Press, 2000. [12] Y. Song, L. Goncalves, and P. Perona. Learning probabilistic structure for human motion detection. In CVPR, 2001. [13] Y. Teh, M. Jordan, M. Beal, and D. Blei. Hierarchical Dirichlet processes. JASA, 101(476):1566–1581, 2006. [14] M. West. Hyperparameter estimation in Dirichlet process mixture models. Technical report, Duke University, 1992. [15] E. P. Xing, M. Jordan, and R. Roded. Bayesian haplotype inference via the Dirichlet process. Journal of Computational Biology, 14(3):267–284, 2007. [16] J. Yan and M. Pollefeys. Automatic kinematic chain building from feature trajectories of articulated objects. In CVPR, 2006.