vertices in the graph, potentially output as a hypothesis for a biological relation ..... Python-implementation is able to perform 1,000,000 iterations on a graph with.
Link Discovery in Graphs Derived from Biological Databases (Research Paper) Petteri Sevon, Lauri Eronen, Petteri Hintsanen, Kimmo Kulovesi, and Hannu Toivonen� HIIT Basic Research Unit, Department of Computer Science, P.O. Box 68, FI-00014 University of Helsinki, Finland {Petteri.Sevon, Lauri.Eronen, Petteri.Hintsanen, Kimmo.Kulovesi, Hannu.Toivonen}@cs.helsinki.fi
Abstract. Public biological databases contain vast amounts of rich data that can also be used to create and evaluate new biological hypothesis. We propose a method for link discovery in biological databases, i.e., for prediction and evaluation of implicit or previously unknown connections between biological entities and concepts. In our framework, information extracted from available databases is represented as a graph, where vertices correspond to entities and concepts, and edges represent known, annotated relationships between vertices. A link, an (implicit and possibly unknown) relation between two entities is manifested as a path or a subgraph connecting the corresponding vertices. We propose measures for link goodness that are based on three factors: edge reliability, relevance, and rarity. We handle these factors with a proper probabilistic interpretation. We give practical methods for finding and evaluating links in large graphs and report experimental results with Alzheimer genes and protein interactions.
1
Introduction
The amount of publically available biological data is growing at a tremendous pace, as new information about genomes, proteomes, interactomes etc. is published daily. Despite the large amount of that information, it is clear that it only represents a tiny fraction of the biological knowledge that potentially will be discovered. For instance, consider the functions of genes: in the Gene Ontology database1 , 29.5% of those gene products that have an annotation for a molecular function, the annotation at the time of writing is “unknown”. This example only represents some of the facts we know that we do not know yet. We present novel computational methods for predicting some of the missing information, with the primary aim of producing and ranking new biological hypothesis for life scientists working on their own specific problems. We assume � 1
Work done while visiting the University of Freiburg. http://www.godatabase.org
U. Leser, F. Naumann, and B. Eckman (Eds.): DILS 2006, LNBI 4075, pp. 35–49, 2006. c Springer-Verlag Berlin Heidelberg 2006 �
36
P. Sevon et al.
a fairly simple and generic form for the input data: a graph where biological entities and concepts constitute the set of vertices, and the edges correspond to known and annotated relationships between the vertices. In this framework, a yet undiscovered link between two entities or concepts may be manifested as a path or a subgraph connecting the corresponding vertices. Qualitative hypotheses for the biological mechanisms are generated by discovering such paths or subgraphs. In this paper, we use the term link to refer to any connections between two vertices in the graph, potentially output as a hypothesis for a biological relation. Not all paths represent a biologically meaningful links. Two edges incident on a vertex may constitute a spurious path, or edges may not be completely reliable. To be able to address more interesting questions, such as evaluation of the statistical significance of a link, or ranking a set of vertices in order of strength of linkage to a given vertex, we need a way of quantifying the strength of a link. This will be a central topic of this paper. In our scenario for the analysis, a life scientist poses queries to a graph database system. In a simple form, such a query can ask if a path exists between two given concepts, and how strong the link is. In a more complex setting, the user may submit sets of vertices and ask the system to find, evaluate and rank subgraphs connecting any pair of given vertices. As a motivating example, consider gene mapping for a particular phenotype. The mapping may have resulted in a large set of candidate genes. When further expensive analyses are planned for the wet lab, the investigators first compare the candidates in the light of what is known about them in the public databases and literature, hoping to be able to concentrate the efforts and resources on the most promising candidates. Due to the lack of automated methods, the work is mostly done by manually browsing the databases. This is a slow and laborious process, and necessarily limits the extent and coverage of the search. Our methods aim at partial automation of such tasks. As for the specific example, methods for automated discovery and analysis of connections between a candidate gene and a phenotype have only recently started to emerge [1,2]. In this paper, we propose a method for measuring the strength of a link based on the two-terminal network reliability [3] between the end vertices. The main contributions of the paper are a novel application of the network reliability measure, as well as a unique way of assigning probabilities to the edges based on three aspects: reliability, relevance, and rarity. Reliability reflects the confidence to the data source, relevance is a subjective measure of importance, and rarity rewards (informative) edges between nodes with low degrees. We give methods for finding good paths and subgraphs and for evaluating their quality. The applicability of the methods is not restricted to gene–phenotype links; they can be used for analyzing the link between any pair of concepts, and potentially even in completely different application areas. Related work. Our work can be characterised as link discovery (link mining, see, e.g., [4] for a review)—or, more specifically, as link prediction; we aim at predicting links between pairs of vertices, where none exist in the form of direct edges. We work on the abstract level of graphs. This gives our methods the
Link Discovery in Graphs Derived from Biological Databases
37
flexibility to work, in principle, with arbitrary concepts and relations. In contrast, methods for specific prediction and annotation tasks have already been heavily used in bioinformatics, for instance to predict genes from the DNA, to predict protein structures and functions, to analyse metabolic pathways, and so on. Our approach is complementary to these, and characteristically integrates different sources of data on an abstract level. Swanson [5,6] successfully demonstrated that novel, unexpected links can be found between entities that are not directly connected. He was able to find an association between a set of articles on Raynaud’s syndrome and another set on fish oil through associations via a third set of articles. Many measures have been proposed for assessing the strength of a link based on overlapping neighborhoods (see, e.g., [7] for a review), i.e., a subgraph consisting of parallel paths of length two. Lin and Chalupsky [8] consider the rarity of path type, in terms of edge types, as a factor of path interestingness. However, little has been published on analysis of connection subgraphs of arbitrary topology. Faloutsos et al. [9] present the idea of using delivered current in resistor networks as a measure for subgraph goodness in (social) networks and give a method for finding a good connection subgraph between two vertices. Asthana et al. [10] use two-terminal network reliability for predicting protein complex memberships from a network of protein interactions. Ramakrishnan et al. [11] assign weights to the edges based on various measures of informativeness, and then extract connection subgraph maximizing a goodness function based on the resistor network model of Faloutsos et al. Paper organization. The paper is organized as follows. We first describe the data in Section 2. In Section 3, we define measures for the strength of a link for a single path and for a subgraph, and show how to estimate the statistical significance of a link. In Section 4, we report experimental results using a set of known Alzheimer genes and a set of known protein interactions. Finally, in Section 5, we conclude with a discussion.
2
Description of Data
Our graph data model consists of various biological entities and annotated relations between them. Large, annotated biological data sets can be readily acquired from several public databases and imported into our graph model in a straightforward manner. We now describe the databases we use, and then give a formal definition of the data model. 2.1
Biological Databases
NCBI’s Entrez2 is an integrated, text-based search and retrieval system for the major biological databases. We use publically available copies of Entrez databases3 along with the Gene Ontology Consortium’s annotation database 2 3
http://www.ncbi.nlm.nih.gov/entrez/query.fcgi ftp://ftp.ncbi.nih.gov/entrez/links
38
P. Sevon et al.
(GOA) in our own research. The Entrez databases contain several kinds of interlinked entities (e.g. article abstracts, genes, gene clusters and proteins), assembled by NCBI from various source databases such as UniProt and PubMed. The GO annotation database contains information about the biological processes, cellular components, and molecular functions of gene products, and it is linked with Entrez databases. Although many of the Entrez’s source databases are themselves available for download, handling Entrez’s link files (essentially lists of edges between entities) is far easier than parsing numerous flat data files in each source database’s native format. This is our main reason for using the Entrez databases instead of the original databases. We represent these entities and relationships as vertices and edges in our graph model. As a result, we get a total of 1,968,951 vertices and 7,008,607 edges. The vertex types in our graph database and some statistics are summarized in Table 1. This particular collection of data sets is not meant to be complete, but it certainly is sufficiently large and versatile for real link discovery. Table 1. Vertex types Vertex type
Source database Number of vertices Mean degree
Article Biological process Cellular component Conserved domain Gene Gene cluster Homology group Molecular function OMIM entry∗ Protein Structural property
PubMed GOA GOA Entrez Domains Entrez Gene UniGene HomoloGene GOA OMIM Entrez Protein Entrez Structure
∗
2.2
330970 10744 1807 15727 395611 362155 35478 7922 15253 741856 26425
6.92 6.76 16.21 99.82 6.09 2.36 14.68 7.28 34.35 5.36 3.33
OMIM entries correspond to phenotype descriptions and gene loci.
Data Model
Our data model is a directed, labeled and weighted graph G = (V, E). The elements of the vertex set V are biological entities such as genes, proteins and biological processes, as well as more general objects like article abstracts. They are labeled by a type from a set Tv , such as “gene” or “protein”. Edge labels (edge types) from set Te describe the relations between vertices, for example “codes” (e.g., gene codes protein) or “refers to” (e.g., article refers to gene). For notational convenience, we define the edge set to consist of triplets (u, τ, v), where u and v are vertices from V and τ ∈ Te is the type of the edge between them. Each type τ has a natural inverse, such as “coded by” and “is referred by”, which we denote by τ −1 ∈ Te ; in a similar fashion, for each edge e = (u, τ, v) ∈ E we define its inverse edge e−1 = (v, τ −1 , u) ∈ E and assume one always exists.
Link Discovery in Graphs Derived from Biological Databases
39
Effectively, the graph could be seen as undirected but with directed labels. We call a directed path p from s to t an s–t path. Finally, we denote the set of edges incident to any vertex v ∈ V by E(v) and the set of neighbouring vertices of v by Γ(v) = {u ∈ V | (v, τ, u) ∈ E for some τ ∈ Te }. Edges sometimes have natural weights in the source databases. For example, a homology between two proteins could have values denoting the degree of sequence similarity. However, we will use other factors, too, to define the weights of edges. They will be discussed next.
3
Link Goodness and Significance
Our goal is to discover and evaluate links between vertices specified by the user. In order to be able to rank paths, or assess the significance of a connection between two vertices, we need a measure for path goodness. We start by defining edge weights (or probabilities), based on which we define a measure for the quality of a given path, and then outline methods for finding the best paths between a pair of vertices. After that we will address the evaluation of the link as a function of the whole graph, not just the single best path. Finally, we will show how to estimate the statistical significance of links, whether based on the best path, or the graph as a whole. 3.1
Edge Weights
We define edge probabilities (weights) as a function of three aspects: 1. Reliability: how confident are we in the edge? How reliable is the data source, how reliable is the method used to produce or predict the edge, and how strong or probable is the connection estimated to be in the data source? 2. Relevance: how relevant is the edge (type) with respect to the query? We assume that the investigator can give query-specific weights for edge types according to his or her subjective opinions of the importance of each edge type for the query at hand. 3. Rarity: how rare and informative is the edge? As an extreme example, an article that refers to all human genes—and such articles do exist—is not likely to be relevant for a specific gene, whereas an article that only refers to few genes is much more likely to be informative. In our definition, edge rarity will be directly related to the degrees of incident vertices. We assume that edge relevance is defined by the user, and that edge reliability is defined by the data source and potentially also by the user. We define rarity below, and then combine all aspects to one probability. Reliability. We envision that the reliabilities of edges are defined using a set of simple rules, such as: if the edge is derived from Swiss-Prot, then its reliability is 0.9, whereas if the edge is derived from the computer-annotated TrEMBL
40
P. Sevon et al.
database, then its reliability is 0.5. The interpretation of edge reliability is the degree of belief the investigator has for the edge being correctly annotated. If there is a value associated with an edge that reflects similarity or confidence, such as a homology score, the value can be transformed into a [0, 1]-similarity value. With the interpretation that the similarity of vertices u and v is the probability that any relationship between u and a third vertex t is also true for v and t, the similarity can be multiplied into the reliability of the edge. Relevance. The relevance of an edge type is the degree of the investigator’s belief that edges of that type represents a relevant connection with respect to the query. In a practical system, the investigator has a basic configuration—a set of default relevance values for edge types—and only few adjustments are needed for a typical query. The relevance values may sometimes be easier to give in terms of vertex types instead of edge types. Then, relevance q(τ ) for a vertex type τ can be decomposed into coefficients � for edge types by multiplying all edge types with one end-vertex of type τ by q(τ ), and edge types with both end-vertices of type τ by q(τ ). As path relevance will be defined as a product of edge relevances, this gives the desired outcome: the relevance of any path visiting a node of type τ is multiplied by q(τ ). Rarity. We want to give lower scores for paths that visit vertices with high degrees: the higher the degree of vertex v, the less likely it is that any two neighbors of v actually have an interesting connection through v. We define rarity d(v) first for vertices: d(v) is the probability that any two edges incident on v are related to each other and represent a meaningful path. We propose the ad hoc formula d(v) = (|Γ(v)| + 1)−α ∈ [0, 1], with α > 0, to determine the penalty for the degree |Γ(v)| of vertex v; smaller values mean larger penalty. The parameter α determines how steeply the penalty increases with the degree. With α = 1, rarity d(v) = 1/(|Γ(v)|+1) has a natural probabilistic interpretation. Consider a random walker who, at any vertex, is equally likely to follow any edge, or stop at the vertex. Then, given a path p through vertices v1 , v2 , . . . , vk , rarity d(vi ) is the probability that a random walker who has so far traversed nodes v1 , . . . , vi , will next stay on the path and visit node vi+1 . Although lower values of α do not give equally attractive interpretations as random walk probabilities, they can be useful in practice to give relevant penalties for vertex degree that reward parallel paths more than a standard random walker. The maximum value of d(v) for an non-terminal vertex v of a path is 3−α . Rarity values of the terminal edges are ignored; they would only add a constant factor to all paths. In principle, the values of α could be set separately for each vertex type, but in this paper we use a single value for all vertices. As with relevance above, the rarity values are decomposed into edge-specific coefficients by taking the square root of them. Ideally, in the context of analysis of connection subgraphs, the relatedness of edges incident on a vertex should be tested for each pair of edges separately and independently. With the rarity
Link Discovery in Graphs Derived from Biological Databases
41
values of vertices decomposed on the incident edges, this is clearly not the case. The approximation is used in order to avoid the quadratic computational cost for each vertex. It has no effect on evaluation of the goodness of a single path. Total edge weight. Now that we have defined all the components of edge weight, we define edge weight w(e) simply as a product of those factors: w(e) = r(e)q(e)d(e), where r(e) ∈ [0, 1], q(e) ∈ [0, 1], and d(e) ∈ [0, 1] are the reliability, relevance, and rarity of edge e, respectively. Under the assumption that they are probabilities for mutually independent necessary conditions for the edge, the weight w(e) is the probability that edge e exists. 3.2
Discovery of Best Paths
Let us consider random graph model G(G, w) specified by graph G and edge weights w described above. A realization of the random graph is obtained by independently removing each edge e from G at probability 1 − w(e). We propose the following definition for the goodness g(p, w) of path p = e1 e2 . . . ek : k � w(ei ) (1) g(p, w) = i=1
With the interpretation that w(e) is the probability that edge e exists, the goodness g(p, w) is the probability that the whole path exists in a realization of G(G, w). The path discovery problem. We now formulate the path discovery task: given two sets S and T of vertices (S and T may overlap), find 1. the k best paths from S to T , 2. all paths whose goodness is at least m, or 3. all paths that consist of at most � edges. These paths could be shown to the user as most likely hypotheses involving vertices from the given sets or, as will be discussed below, used for further analysis of the link. In any case, before giving final results to the user, it is useful to estimate the statistical significance of the results; this will also be discussed below. Algorithms. Standard algorithms for finding shortest paths [12,13] can be applied; the probabilities can be transformed into distances required by the standard methods by taking the negative logarithm of the goodness: − log g(p, w) =
k �
− log w(ei ).
(2)
i=1
Any combination of the abovementioned constraints for paths can be easily used.
42
P. Sevon et al.
The number of vertices that can be reached from a single source typically grows exponentially with path length, until it saturates. If the maximum number of edges (or minimum goodness) is set so that the saturation point is not reached at halfway to the maximum number (or minimum goodness), then a bi-directional search starting from both sets will be substantially faster than a standard unidirectional search. 3.3
Evaluation of Graph Connections
The goodness of a single best s–t path is not necessarily a good measure of the strength of the link between vertices s and t. A link consisting of several parallel paths may be considered stronger than a single path, even if all the individual paths are weaker. With a probabilistic interpretation, the quality of a single path reflects the probability that that particular path exists, whereas a more appropriate measure often would be the probability that at least one path exists between s and t. Graph connection goodness. Based on the probabilistic interpretation, we propose using the two-terminal network reliability [3] as a measure for link goodness g(G, w, s, t) between vertices s and t in graph G. The measure is defined as the probability of a path existing in a realization of the random graph: g(G, w, s, t) = Pr(“there is an s–t path in a graph generated by G(G, w)”). (3) Algorithms. The two-terminal network problem has been shown to be NP-hard by Valiant [14], but the probability can be estimated using a straightforward Monte Carlo approach: generate a large number of realizations of the random graph, and count the relative frequency of graphs where a path from s to t exists. Monte Carlo estimates that are accurate to within ±ε at high probability can be obtained using O(ε−2 ) iterations. Since we are only interested in cases where g(G, w, s, t) is not very close to zero, we need not worry about the number of iterations required to control relative accuracy. (Reasonable absolute accuracy can be achieved with 100,000–1,000,000 iterations; in practice, our Python-implementation is able to perform 1,000,000 iterations on a graph with 1,000 edges in roughly 1.5 hours on a 3.0 GHz P4 PC.) A lower bound for g(G, w, s, t) can be computed efficiently by first enumerating all m-good or k best paths from s to t, and then evaluating g(G� , w, s, t) in the subgraph G� induced by the set of paths. A graph G� = (V � , E � ) is induced by a set of paths, if V � and E � are the sets of vertices and edges, respectively, occurring in the paths. Since the induced graph is a subgraph of G, it clearly gives a lower bound. Following the terminology of Faloutsos et al. [9], the induced subgraph G� is here called a connection subgraph. An upper bound for g(G, w, s, t) can be obtained easily when the paths inducing G� are searched unidirectionally starting from, say, s: include all the pruned partial paths in G� and connect them with an edge of probability one to t. This
Link Discovery in Graphs Derived from Biological Databases
43
provides the tightest possible upper bound based on G� . With bi-directional search, the upper bound can be obtained in a similar way. Estimation of the upper bound is easily incorporated to the Monte Carlo algorithm, but the procedure is slowed down due to the large number of additional edges from the pruned paths. Our work so far relies on the lower bounds only. Further efficiency improvements are possible by repeatedly replacing parallel edges by only one edge and by removing vertices (except s or t) with exactly two neighbors as long as there are any. This is a linear-time operation in the size of the graph. For the class of series-parallel graphs, these operations reduce graphs to a single edge and two-terminal network reliability can be computed exactly in linear time. 3.4
Estimation of Link Significance
We eventually want to measure how strongly two given vertices, s and t, are related in graph G. The path probability g(p, w) (Eq. 1) and the two-terminal network reliability g(G, w, s, t) (Eq. 3) allow ranking of links, but their values may be difficult to put into perspective. Is a probability of, say, 0.4 for the existence of any s–t path high or low? This obviously depends on the data and the specific instances. Using maxp∈P(s,t) g(p, w), where P(s, t) is the set of all s–t paths (i.e., goodness of the best s–t path), or g(G, w, s, t) as a test statistic, we can estimate the statistical significance of the link. This tells us how likely it is to obtain, by chance, probability of 0.4 or better. There are a variety of meaningful null hypotheses to be considered: 1. Vertices s and t of types τs and τt , respectively, are not more strongly connected than randomly chosen vertices s� and t� of types τs and τt . 2. Vertex s of type τ is not more strongly connected to vertex t than a randomly chosen vertex s� of type τ . 3. Vertices s and t are not more strongly connected in the given graph G than random graph H and edge weights w� generated by model H similar to the (unknown) model which generated G and w. The last null hypothesis clearly is the most complicated one, as it is not easy to come up with model H that generates random graphs that are topologically sufficiently similar to the observed graph. The choice from the first two null hypotheses depends on what we are testing. In a symmetrical case, e.g., testing for significance of connection between two candidate genes, the first null hypothesis is appropriate. If the roles of the vertices are asymmetric, as in testing for the connection from a set of candidate genes to a single phenotype, the second null should be used. In the experiments, we apply the first null hypothesis to assesment of gene–gene link, and the second one to assesment of gene–phenotype link. Under the null hypotheses 1 and 2, p values can be estimated by sampling vertices s� (Null 1) or pairs (s� , t� ) (Null 2), and computing the test statistic (g(p, w) of the best s� –t� path p or g(G, w, s� , t� )) for all (s� , t� ) pairs in the
44
P. Sevon et al.
sample. The p value for the connection between s and t is then the proportion of (s� , t� ) pairs giving a test statistic at least as high as the one observed for (s, t). Because vertices of the same type may have wildly varying degrees, we only sample vertices s� and t� that have degrees similar to s and t, respectively. If a number of hypotheses are to be tested (e.g., several candidate genes), then the resulting p values should be adjusted accordingly to account for multiple testing.
4
Experiments
We demonstrate the use of link goodness by an example in the detection Alzheimer disease genes. We selected a handful of known disease genes, and estimated the significance of the gene–phenotype link for each. We did this this separately for two test different statistics: the probability of the best path between vertices s and t, and the two-terminal reliability computed from the connection subgraph induced by k best paths. In a second experiment, we evaluated the significance of links between genes whose protein products are known to interact. The experiments were performed using the Entrez dataset described in Section 2.1. Test design is not trivial: for any classified examples, i.e., known disease genes, there are trivial links in the graph (e.g., the OMIM entry for the disease refers directly to the candidate gene). The ideal solution would be to use only edges that are annotated prior to publication of the gene–disease association, but it is difficult to obtain the state of all databases at an earlier date. Instead, we simply removed all trivial paths from the set of k best paths—e.g., paths whose goodness is greater than a given threshold, or paths consisting of at most a given number of edges. In order to simplify the experimental setting and to avoid introducing a subjective bias, we assume that all edges have the same product rq of reliability and relevance. Consequently, the goodness of a path or subgraph depends only on the topology of the graph and parameters α and rq. We chose ten known human susceptibility and candidate genes for Alzheimer disease—APP, PSEN1, AD5, AD6, AD9, AD7, COL25A1, APOE, PSEN2, and AD6—obtained by querying the Entrez Gene database with term “Alzheimer”. As the vertex representing the phenotype, we used the entry in the OMIM database giving phenotype description of Alzheimer disease. This entry contains trivial links to all known Alzheimer genes, as well as a large number of references to literature on the disease. For each gene, we sampled 100 genes from the set of all human genes that have similar degree to the tested gene. The goodness values for links between vertices corresponding to these genes and the phenotype constitute our empirical null distribution. For each gene (candidate or random), we first enumerated the best 100 acyclic paths of at most 6 edges from the gene to the phenotype. For two of the genes, COL25A1 and AD9, no paths to Alzheimer disease were found. Next, in order
Link Discovery in Graphs Derived from Biological Databases
45
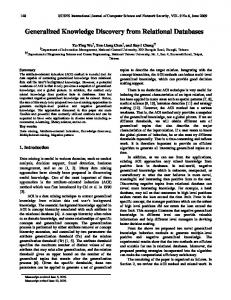
to eliminate the trivial links, we removed all paths shorter than three edges from this set. Figure 1 shows an induced graph for AD6 (but for clarity only 20 best paths). We used the goodness value of the best of the remaining paths, and the two-terminal network reliability of the graph induced by the remaining paths as test statistics. Two-terminal network reliability was estimated using Monte Carlo algorithm with 100,000 iterations; standard deviation of the estimate is less than 0.0064. Based on these two statistics, we then estimated two p values—one for the best path and another for the connection subgraph—for each candidate gene.
Fig. 1. The graph induced by 20 best paths from gene AD6 to Alzheimer disease. The terminal vertices are rectangular. The edges are labelled with their probabilities (α = 0.25, rq = 0.8). Gene AD6 (Entrez Gene entry 64851) is linked to the locus description (OMIM entry 605526) by a direct edge and via three articles. The locus description is in turn linked to another locus description, insulin-degrading enzyme (OMIM entry 146680), via two articles, and, finally, to Alzheimer disease (OMIM entry 104300) via two proteins and two UniGene clusters.
We experimented with the test statistics using parameter values (α, rq) ∈ {0.125, 0.25, 0.5, 1.0} × {0.2, 0.4, 0.6, 0.8, 1.0}. For α = 0.25 and rq = 0.8, the p values and values of the test statistics for each gene are shown in Table 2. The probabilities of best paths and connection subgraphs expectedly vary markedly across genes, and are not alone sufficient indicators of the strength of a link. The estimated p values are more useful here. In this test, they are consistently small; in fact, in many cases none of the 100 randomized data sets produced equally high goodness values. Based on the results, it is difficult to claim that the analysis of connection subgraphs
46
P. Sevon et al.
is more powerful than analysis of the best path, but we would expect that to be the case in general. The goodness values also vary with the values of the two parameters of our test. However, comparable p values were obtained for all combinations of parameter values (except for α = 1); mean p values for all combinations are shown in Table 3. This can be seen as an indication of the stability of the measures with respect to the parameters, but it also shows that the links are very strong and rather obvious (as seen in Figure 1), even though all short paths were removed. Table 2. Results: Alzheimer disease (α = 0.25, rq = 0.8)
Gene
Best path p value goodness
Connection subgraph p value goodness
AD7 APOE APP AD8 PSEN1 PSEN2 AD6 AD5
< 0.01 < 0.01 0.02 < 0.01 0.04 < 0.01 < 0.01 0.01
0.01 0.01 0.01 < 0.01 0.01 < 0.01 < 0.01 0.01
0.024 0.184 0.123 0.119 0.103 0.153 0.033 0.040
0.153 0.876 0.719 0.262 0.963 0.993 0.336 0.238
Table 3. Mean p values for all combinations of parameter values (best path/connection subgraph) rq \ α 0.2 0.4 0.6 0.8 1.0
0.125
0.250
0.500
1.000
0.0100/0.0075 0.0088/0.0075 0.0088/0.0063 0.0088/0.0063 0.0088/0.0200
0.0175/0.0063 0.0150/0.0075 0.0088/0.0075 0.0088/0.0063 0.0088/0.0063
0.0200/0.1325 0.0163/0.0075 0.0263/0.0100 0.0075/0.0075 0.0088/0.0075
0.0438/0.3813 0.0300/0.3813 0.0063/0.1338 0.0138/0.0075 0.0238/0.0088
In a second, more challenging experiment, we evaluated the strength of link between APP and five genes whose protein products interact with the APP protein: HADH2, APBA1, CHRNA7, APOA1, and SHC1. The interactions were obtained from the IntAct-database4 . The experiments were carried out the same way as with Alzheimer disease, except that we used the first, symmetric null hypothesis (i.e., vertices at both ends were randomized). In the results, two genes show significant linkage to APP (Table 4). The other three genes get non-significant p values despite relatively high values of the test statistics (compared to the Alzheimer experiment), suggesting that pairs of genes are generally 4
http://www.ebi.ac.uk/intact
Link Discovery in Graphs Derived from Biological Databases
47
strongly connected. A possible remedy is to give higher relevance coefficients for interaction-related edge types. However, it is also possible that simple weighting of edges is not sufficient to distinguish the potential interaction-related paths between the pairs of genes in these cases. Table 4. Results: interactions with APP (α = 0.25, rq = 0.8)
5
Gene
Best path p value goodness
Connection subgraph p value goodness
HADH7 APBA1 CHRNA7 APOA1 SHC1
< 0.01 < 0.01 0.17 0.56 0.15
0.01 < 0.01 0.52 0.51 0.07
0.159 0.137 0.058 0.041 0.118
0.917 0.998 0.359 0.530 0.937
Discussion and Conclusions
In this paper, we have proposed measures and methods for assessing the strength of a link between a pair of vertices in a graph consisting of biological concepts. Such graphs can be easily constructed from many biological databases; due to the simplicity of the data model, integration of data is usually simple and the essential requirement is a referential integrity between the data sources. We introduced the ideas of assigning probabilities to the edges derived from three factors—reliability, relevance, and rarity. The proposed measures for link strength are based on probabilities of paths that are derived from edge probabilies in a straightforward manner: One is the highest probability of path among all paths connecting the pair of vertices; the other is based on two-terminal network reliability, and approximates (bounds) the probability that at least one path exists between the vertices. We believe that the probabilistic interpretations for link strength are more natural and intuitive for investigators than, e.g., conductance in resistor networks or capacity and maximum network flow. We demonstrated the link goodness measures for evaluating the strength of gene–phenotype-link using a set of known Alzheimer genes. Both measures gave the known genes low p values, indicating that they would have been successfully identified among the most likely candidates for Alzheimer disease among a random set of genes, except for two genes for which no link was found. In a second experiment we evaluated the strength of the link between APP and five other genes whose protein products are known to interact with the APP protein. The results suggest that—although two of the genes showed significant linkage to APP—the simplistic experimental setup using a single relevance value for all edge types is not optimal, which was to be expected. We leave the evaluation of expert-specified relevance coefficients as a topic for future research.
48
P. Sevon et al.
Using the goodness of the best path as a test statistic should be less robust than using the two-terminal network reliability. However, in the example case of Alzheimer genes, both methods gave comparable p values. This may be due to several reasons: the function used for rarity, i.e., for penalizing vertex degrees, may be suboptimal, or the test method of removing short paths may still leave some trivial paths that skew the results. Further work is needed to study these issues in detail. Two of the Alzheimer genes did not have any paths to the disease. This may be due to the limited set of databases we currently use. Several important types of data are missing: protein–protein interactions, tissue specificities, pathways, and Medical Subject Heading annotations of articles, to name a few. Actually, we believe that our probabilistic approach is particularly suitable for analysis of data sets containing uncertain relationships, such as computer annotated interactions or links derived by text mining, as the confidence in the prediction can be easily plugged into the reliability measure. The use abstract, labeled graphs as a data representation has a number of trade-offs. On one side, it is a generic format, it is easy to convert data into it, and there is a large body of known results and algorithms for graphs. The downside is that information may be lost in the transformation, the vertex or edge types may be too different to be really used in the same graph, and—above all— without built-in knowledge about particular biological concepts, mechanisms, and phenomena, specific discoveries about them cannot be made. It seems obvious to us that several different approaches on different levels of detail and integration are needed, and that they complement rather than compete with each other. There are several topics for further research. The penalty for vertex degree is now determined for all vertices in a uniform manner, but it might be better to have different rules for different vertex types. The penalty could also be edge type sensitive. For example, consider an article with edges to a large number of genes, one biological process, and one phenotype; we do not want to penalize a path from the biological process to the phenotype from the edges to the genes. The path queries are now fully specified by the source and target vertex, minimum goodness, maximum length, and edge type relevances. To have more control over the resulting paths, we need a query language that allows an investigator to specify the path types of interest. Earlier suggestions for query languages for paths include regular expressions [15] and context-free grammars [16]. Expressive query languages open possibilities for specifying aspects such as the formulae for degree penalties as background knowledge, or edge relevances, that could be made context sensitive. Another important area for practical applications is visualization of the resulting graphs.
Link Discovery in Graphs Derived from Biological Databases
49
Acknowledgment This research has been supported by Tekes, Jurilab Ltd., Biocomputing Platforms Ltd., GeneOS Ltd., and Humboldt Foundation.
References 1. Turner, F.S., Clutterbuck, D.R., Semple, C.A.M.: POCUS: Mining genomic sequence annotation to predict disease genes. Genome Biology 4 (2003) R75 2. Perez-Iratxeta, C., Wjst, M., Bork, P., Andrade, M.A.: G2D: A tool for mining genes associated with disease. BMC Genetics 6 (2005) 45 3. Colbourn, C.J.: The Combinatorics of Network Reliability. Oxford University Press (1987) 4. Getoor, L., Diehl, C.P.: Link mining: A survey. SIGKDD Explorations 7 (2005) 3–12 5. Swanson, D.R.: Fish oil, Raynaud’s syndrome and undiscovered public knowledge. Perspectives in Biology and Medicine 30 (1986) 7–18 6. Swanson, D.R., Smalheiser, N.R.: An interactive system for finding complementary literatures: A stimulus to scientific discovery. Artificial Intelligence 91 (1997) 183–203 7. Liben-Nowell, D., Kleinberg, J.: The link prediction problem fof social networks. In: Proceedings of the 12th International Conference on Information and Knowledge Management (CIKM’03). (2003) 556–559 8. Lin, S., Chalupsky, H.: Unsupervised link discovery in multi-relational data via rarity analysis. In: Proceedings of the Third IEEE International Conference on Data Mining (ICDM ’03). (2003) 171–178 9. Faloutsos, C., McCurley, K.S., Tomkins, A.: Fast discovery of connection subgraphs. In: KDD ’04: Proceedings of the tenth ACM SIGKDD international conference on Knowledge discovery and data mining. (2004) 118–127 10. Asthana, S., King, O.D., Gibbons, F.D., Roth, F.P.: Predicting protein complex memebership using probabilistic network reliability. Genome Research 14 (2004) 1170–1175 11. Ramakrishnan, C., Milnor, W.H., Perry, M., Sheth, A.P.: Discovering informative connection subgraphs in multi-relational graphs. SIGKDD Explorations 7 (2005) 56–63 12. Tarjan, R.E.: Data Structures and Network Algorithms. CBMS-NSF Regional Conference Series in Applied Mathematics. SIAM (1983) 13. Eppstein, D.: Finding the k shortest paths. SIAM Journal on Computing 28 (1998) 652–673 14. Valiant, L.G.: The complexity of enumeration and reliability problems. SIAM Journal on Computing 8 (1979) 410–421 15. Lacroix, Z., Raschid, L., Vidal, M.E.: Efficient techniques to explore and rank paths in life science data sources. In: Proceedings of Data Integration in the Life Sciences, First International Workshop (DILS 2004). (2004) 187–202 16. Mork, P., Shaker, R., Halevy, A., Tarczy-Hornoch, P.: PQL: A declarative query language over dynamic biological schemata. In: Proceedings of the American Medical Informatics Association Annual Symposium 2002. (2002) 533–537