Maintaining Dynamic Channel Profiles on the Web Haggai Roitman, David Carmel, Elad Yom-Tov IBM Haifa Research Lab Haifa 31905 Israel {haggai,carmel,yomtov}@il.ibm.com
ABSTRACT This work addresses a novel problem of maintaining channel profiles on the Web. Such channel maintenance is essential for next generation of Web 2.0 applications that provide sophisticated search and discovery services over Web information channels. Maintaining a fresh channel profile is extremely difficult due to the the dynamic nature of the channel, especially under the constraint of a limited monitoring budget. We propose a novel monitoring scheme that learns the channels’ monitoring rates. The monitoring scheme is further extended to consider the content that is published on the channels. We describe a novelty detection filter that refines the monitoring rate according to the expected rate of novel content published on the channels. We further show how inter-channel profile similarities can be utilized to refine the channel monitoring rates. Using real-world data of Web feeds we study the performance of the monitoring scheme. We experiment with several monitoring policies over a large set of Web feeds and show that a policy based on learning the monitoring rate of the channels, combined with novelty detection, outperforms alternative channel monitoring policies. Our results show that the suggested content-based policy is able to maintain high quality channel profiles under limited monitoring resources.
Categories and Subject Descriptors H.3.5 [Online Information Services]: Web-based services
Keywords Web Monitoring, Web feeds, Channel Profiles
1.
INTRODUCTION
The number of diverse information channels available on the Web is rapidly increasing. It spans many different knowledge domains such as news, stock and market reports, auctions, and more recently channels containing data gathered from Blogs or Wikis. Recent advances in Web technology, such as the improved access capabilities to channels and the availability of new data delivery Permission to make digital or hard copies of portions of this work for personal or classroom use is granted without fee provided that copies Permission to copy without feefor all or part of material isadvantage granted provided are not made or distributed profit or this commercial and that copiesbear are not or and distributed direct commercial thatthe copies thismade notice the fullforcitation on the firstadvantage, page. the VLDB copyright notice and of the publication andthan its date appear, Copyright for components of the thistitle work owned by others VLDB and notice is must givenbe that copying is by permission of the Very Large Data Endowment honored. Base Endowment. To copy otherwise,Toorcopy to republish, to topost on servers Abstracting with credit is permitted. otherwise, republish, ortotopost redistribute to lists, a fee and/or permission from the on servers or torequires redistribute to listsspecial requires prior specific publisher, ACM. permission and/or a fee. Request permission to republish from: VLDB ‘08, August 24-30, 2008, Auckland, Publications Dept., ACM, Inc. Fax New +1 Zealand (212) 869-0481 or Copyright 2008 VLDB Endowment, ACM 000-0-00000-000-0/00/00.
[email protected]. PVLDB '08, August 23-28, 2008, Auckland, New Zealand Copyright 2008 VLDB Endowment, ACM 978-1-60558-305-1/08/08
151
mechanisms for disseminating the channel content, have resulted in the emergence of more advanced client-side Web applications. These applications require sophisticated manipulation of channels on the Web including the discovery, search, and recommendation of relevant channels. Such applications include various Web 2.0 mashups, and situational applications in general, which integrate data that is gathered from several different, possibly inter-related, channels. An imperative task for developers of such applications is to locate relevant channels that will maximize the benefit gained from their applications. A crucial step toward the support of such advanced services over channels is the ability to capture the essence of each Web channel. This can be done using channel profiles. A channel profile is a compact representation of the channel content, which can be used to summarize and capture the main characteristics of the content published on this channel. Profiles can simplify the way relevant channels can be located and can be used to match application requirements against the available set of channels managed by the system. Maintaining channel profiles is challenging due to several reasons. First, channel content is usually dynamic, as in the case of Web feeds where the content is continuously changing, sometimes at a daily or even hourly rate. Because the profiles of such channels may continually change over time, capturing the dynamic trends of the channel content is extremely difficult. Second, the majority of channels on the Web are available nowadays for access via pull-only protocols, while most servers refrain from supporting push protocols due to scalability issues. Previous work on novelty detection in data streams (e.g., [29]), and data stream summarization (e.g., [21]), assume that the stream of updates to a channel is pushed into the system. By contrast, in a pull based scenario each channel is required to be actively monitored in order to maintain enough snapshots to construct a fresh and reliable profile of its content. The freshness of maintained profiles therefore directly depends on the rate at which channels are monitored. Moreover, different channels may have different rates at which novel content is being published on them [17]; thus we can expect that profiles of different channels may change at a different (possibly even non-regular) rate. Third, in the pull-based scenario, channels may be volatile, meaning that novel content published over time has a limited lifespan during which it is available on the channel. Such data volatileness is very common in Web feeds, where channels have a limited capacity for the number of feed entries that are maintained on the feed. Such limitation is further determined by the feed popularity and the feed provider update policy [15] ( e.g., an overwrite policy for which the provider maintains only the last newest entries of the feed). Therefore, monitoring the channel profiles in a pull set-
ting is challenging, where it is hard to predict the moments when novel content, which may result in a significant profile change, is published on such volatile channels and is still available for access. Finally, channel monitoring can be constrained, either due to limited system resources such as bandwidth, memory, or CPU, or due to monitoring restrictions set by the channel providers themselves (termed “politeness constraints” in [9]) due to heavy workloads imposed by multiple client access. Therefore, the number of channels that can be monitored in parallel is further limited and requires efficient utilization of the allocated resources for the maintenance of fresh profiles. Traditional monitoring solutions rely solely on the model of raw update events, where the rate of actual content change is neglected. Thus, such solutions may consume superfluous resources and, therefore, may fail to scale. Many previous works have studied the monitoring of dynamic Web data sources such as Web channels. Our work differs from previous works in several aspects. Most current Web monitoring solutions derive monitoring rates based solely on the “raw” update rates of Web channels, while we consider also the rate of content change published on these channels to improve the monitoring policy. For this purpose, we suggest a learning scheme based on novelty detection for Web channels in pull-only settings. More specifically, our main contributions can be stated as follows. • We suggest a novel profiling model for channel content that can be used for channel search and discovery. • We formally define the problem of maintaining dynamic profiles of channels’ content. We provide several evaluation measures for those profiles quality. • Using the proposed measures, we explore solutions for channel profile maintenance and propose efficient and effective monitoring policies for a single channel as well as for multichannel monitoring. Our policies continuously decide which channels to monitor over time, considering both the update rate as well as the novel content rate of the channels data. We further refine the channel monitoring rates by utilizing inter-channel profile similarities. • Using real world Web feeds, we report on the performance of our policies with respect to the proposed measures. We show that by taking the content update rate of the channels into consideration, we are able to significantly save the monitoring resources required by the policy while maintaining a high profile quality. The rest of the paper is organized as follows. We begin with a motivating example in Section 2 that demonstrates the significance of dynamic channel monitoring on the Web. Section 3 discusses related work. In Section 4 we present our profile model and formally define the problem of maintaining channel profiles. Section 5 discusses different monitoring solutions for a single channel, while Section 6 discusses the monitoring problem for the multi-channel case. Finally, Section 7 concludes and Section 8 discusses future directions.
2.
MOTIVATION
As a motivating example, we consider an application of a simple profile management system for Web channels. Figure 1 illustrates the simple architecture of such system. The system consists of five components: pull protocol adapters, a monitor, a profiler, a search index, and a service API. The system monitors channels and accesses the content published on the channels using the pull-protocol
152
Figure 1: Example application of a profile management system for channels on the Web adapters (e.g., using HTTP GET calls). The content gathered by the monitor is delivered to the profiler that is responsible for updating the channel profile and generating a fresh profile for the channel’s content. The profile is then updated in the search index. The system exposes a convenient service API for clients to search and locate relevant channels for their application needs. The system can further match the client requirements (which might be submitted also as a user-profile to the system) against the current channel profiles available in the system to recommend relevant channels that can satisfy the client’s needs. Clients of such a system may consist of various mashup applications1 that need to discover the most relevant channels to be used as inputs and outputs of the different mashup components. Other clients may consist of different Web feed readers that search for relevant feeds according to their user profile, which describes the user’s information interests. Moreover, the system can recommend new sources for clients, helping them discover new relevant channels that they would not be aware of otherwise. The monitoring component of the system has a limited amount of available resources for the task of maintaining fresh channel profiles; thus, it is required to efficiently monitor the channels to maximize the system’s ability to cope with the management of multiple channels. To do so, the monitor has to estimate the rate at which each channel should be monitored and how to schedule the limited allocated monitoring system resources in the most efficient way. In what follows, we describe monitoring policies tailored for this specific task, i.e., maintaining good representative channel profiles that best reflect the channel content, under the constraints of limited computational resources.
3.
RELATED WORK
The Web is very dynamic, causing any representative repository of Web pages to become out-of-date over time. Maintaining a fresh repository of Web pages is challenging and many Web monitoring solutions have been suggested [3, 7, 12, 14, 18, 19, 24, 23, 22, 26, 27]. Such solutions usually rely on a model of updates to the data sources monitored. Using a given update model, a Web monitoring policy has to decide when and how much to monitor each of its data sources. Therefore, the efficiency of any Web monitoring solution strongly depends on the the efficiency of the update model. Several works study update models for dynamic data sources such as Web channels (e.g., [6, 8, 11]). These works rely mostly on update independence assumptions and provide update models that are usually based on Poisson processes. To overcome modeling errors during on-line monitoring, adaptive solutions have also been suggested (e.g., [3, 14]). These approaches rely on feedback 1 Many examples of such http://www.webmashup.com/.
applications
are
available
at
gathered during active monitoring of the data sources. While some Web monitoring solutions provide generic policies (e.g., [18, 24, 23]) that are application-independent, others provide domain-specific solutions (e.g., [27, 26] for Web feeds). Some monitoring solutions consider user-centric approaches (e.g., [19, 27, 24, 23]), where user data delivery requirements are also taken into consideration, either explicitly (e.g., in the form of user profiles [22, 24, 23]) or implicitly (e.g., by deriving user-reading patterns [27]). The recent study of Ntoulas et al. [17] on the evolution of the Web suggests that search engines (and other applications), which depend on content that is available for access via pull-only protocols, should consider both the update patterns of Web pages and the content that such updates contribute. Ntoulas et al. further measured the content change of Web pages using cosine similarity. This study has shown that the content of Web pages may change at a different rate than the page actual update rate.
3.1
Our Contributions
Our work extends the important observation made by Ntoulas et al. [17] and is targeted at maintaining the profiles of dynamic Web channels. It differs from previous works in several important aspects that are unique to this specific task. Current Web monitoring solutions derive monitoring rates based solely on the “raw” update rates of Web channels (e.g., [18, 26]), while we consider also the rate of content change published on these channels to improve the monitoring rates. For this purpose, we suggest a learning scheme based on novelty detection for Web channel monitoring in a pullonly setting. Both traditional novelty detection solutions (e.g., [1, 16, 29]), and state-of-the-art news summarization (e.g., [21]), news filtering (e.g., [2, 10]), and topic tracking (e.g., [20]) solutions assume that the complete stream of update events is available via push into the system. Furthermore, the main focus of these solutions is on efficient data filtering and novelty detection methods, where load shedding techniques can be applied in order to control the amount of pushed data to be consumed by the system (e.g., [28]). A pull-only setting is much more challenging, mainly due to the additional possibility of incompleteness of the processed data, which is generally attributed to the data volatileness properties. Such data volatileness is closely coupled with the maintenance policy of the data source. It is further worth noting that pulling data directly from the data source imposes additional computational resources. In the presence of limited such resources, any monitoring solution is required to make efficient decisions on how to optimally schedule the data monitoring tasks. The objective of previous solutions in the literature is to maximize a quality measure given in terms of “single-page-snapshot”, such as a single-page data freshness. Our objective is to maintain a high quality channel profile that represents a window of several pages provided on the channel. Most existing Web monitoring solutions require an update model as input, while we learn such a model on-line. Furthermore, assuming that updates to a channel are independent is usually an unrealistic assumption for our problem. Instead, we suggest an adaptive learning scheme based on reinforcement learning techniques for deriving a monitoring rate on-line, where we learn the rate of content change rather than just raw updates. We further incorporate inter-channel profile similarities in our learning scheme to refine more the monitoring rates. To the best of our knowledge, this is the first work to consider the problem of maintaining channel profiles on the Web. We propose a novel solution for this problem based on a content-oriented learning approach. We identify channel profiles as a fundamental tool for
153
the development of next generation of Web 2.0 applications that provide advanced search and discovery services over information channels and go beyond existing solutions in the literature.
4.
DEFINITIONS
In this section we provide definitions for the main concepts described in this work.
4.1
Web Channels
Let T represent an epoch of time, and let T ∈ T denote a time moment in T . We denote C = {C1 , C2 , . . . , Cn } a set of n channels, where each channel C ∈ C is defined as an infinite stream of update events C = (e1 , e2 , . . .), starting from the beginning of epoch T . We assume textual streams, where each update event e ∈ C contains a text message. We further denote lif e(e) the period of time during T on which update event e is available on the channel. For a given time T ∈ T , and a channel C ∈ C, a channel snapshot at time T (denoted CT )) is given by the set of update events available on the channel at time T ; that is: CT = {e|e ∈ C ∧ (T ∈ lif e(e))} Let W be a time window in T .2 Given a channel C ∈ C, we further denote CW the union of channel snapshots during the time window W : CW = ∪T ∈W CT
4.2
Channel Profiles
A channel profile represents the textual content of the channel events belonging to the channel snapshot CT . Due to the dynamic nature of channels, channel snapshots captured during different times may differ, resulting in a possible difference in the corresponding channel profiles. In this work we adopt the Bag Of Words (BOW) model for representing the channel content. Given a vocabulary of terms D = {t1 , t2 , . . . , tm }, the channel profile, at given time T , is then defined as a weight vector: P (CT ) = (wt1 , wt2 , ..., wtm ) Each weight wt corresponds to a unique term t ∈ D, which may appear in the textual content of the channel events. If CT content does not contain term t, then wt = 0. Each term can be either a word, a phrase, or a lexical affinity.3 Similarly, given a window W of k last events captured on the channel (i.e., a window of size k), we define P (CW ) as the profile representing the content of those events. The channel profile is therefore a compact representation of the channel content at a given time and is used to capture the relative importance of each of the terms in the channel at time T (or during a time window W ). An increase in profile window size results in more content that is accumulated over a longer period of time, and therefore, it may require more resources such as in-memory. Furthermore, the profile window size has an important role from a user’s point of view. A user that prefers generality (i.e., a wide perspective of the content published on the channel for a long time) would require a large window size to satisfy these needs. On the other hand, a user that 2 Such time window can be defined also in terms of number of events. 3 A lexical affinity is a pair of closely related words found in proximity to each other in the text [5].
prefers specificity (i.e., a narrow perspective of the current content published on the channel) would require a small window size.
4.2.1
Web Feed Profiles
Web feeds are usually used by content providers to publish content on the Web. Those feeds are dynamic channels, supported by pull-only protocols (e.g., available for access through HTTP GET calls), where the set of published items on each feed changes over time and items are volatile in most cases. A Web feed, such as RSS or Atom feed, is an XML file that contains a set of feed items, where each item links to some Web resource (e.g., an HTML file), and contains summarized details of the resource such as title and description. The items that are published on the feed over time comprise the dynamic feed channel. Therefore, we treat every new item published on feed C as an update event e ∈ C. The set of terms appearing in the item text (title and description) comprise the item bag of terms, B(e). We determine the terms’ weights in a Web feed profile using the well-known tf -idf weighting scheme [25]. Given CW , the set of items that are available on feed C during the time window W , the term frequency of a term t, tf (t, CW ), is the number of occurrences of t in CW . To calculate the inverse document frequency of a term t, idf (t), we first count all items gathered from the feeds C ∈ C, from the beginning of the epoch until the end of the time window W , denoted CW (T ). We then count the number of items t in CW (T ) that include at least one occurrence of term ³ t, CW (T´). Then the idf of term t is calculated by idf (t) = log
|CW (T )| t (T )| |CW
.4
Finally, the weight of each term t in the profile P (CW ) is given by wt = tf (t, CW ) · idf (t). While the tf of a given term t in the profile represents a the temporary local importance of the term in the channel during the given time window, the idf of a term represents its global importance by considering also the occurrence of the term in items that appeared on the different channels during the history. Since channel profiles are used to represent the dynamic textual content of the channel, common terms appearing in many channel items are less important in representing the channel content in a given time frame. Therefore, common terms (with low idf value) will be weighted lower compared to the rarest terms. Table 1 provides an illustration of the top-10 terms (both keywords and lexical affinities) of the CNN Politics Web feed5 profile that were captured during a period of 10 days in July 2007. We observe that the profile stayed quite stable during the first week and had minor changes; starting from the eighth day the profile changed remarkably. This example shows that some channel profiles are dynamic and might have a varying rate of content change over time.
4.3
Measures
We now define two measures over channel profiles. The first is a profile similarity, which is used to evaluate the similarity between two channel profiles. The profile similarity will be used to evaluate how the channel content is changed over time, by measuring the difference between channel profiles in different time periods. The second is a channel cohesion measure that further can be used to compare different channels with regard to the average rate of change of their content over time.
4.3.1
Profile Similarity
Given a pair of channel profiles P1 , P2 , we define the similarity between the two profiles as their vector space model cosine similarity: sim(P1 , P2 ) =
P1 · P 2 kP1 kkP2 k
(1)
It is worth noting that the similarity between profiles of the same channel in two different time windows reflects the amount of changes in content of the channel over time.
4.3.2
Channel Cohesion
Channel cohesion measures the cohesion of the textual content in the channel over time. A channel with a low cohesion is one for which new published events dynamically change the channel content as reflected by the corresponding channel profile. Such a low cohesive channel will require a higher monitoring rate in order to keep its profile up to date. A higher cohesive channel is a one where new items cause only minor change in its profile. This is typical of channels with many duplicate (or near duplicate) items or when items are focused on the same topic for a long period of time. For such channels, a low monitoring rate will suffice. D EFINITION 1 (C HANNEL C OHESION ). Given a channel C ∈ C, the channel cohesion during the epoch T = [T1 , T2 ] is calculated as: Z T2 1 sim (P (CT ) , P (CT +dT )) dT (2) coh(C, T ) = T2 − T1 T1 Channel cohesion measures the average profile similarity in a given time period [T1 , T2 ]. If the channel profiles significantly differ over the time period, the cohesion will be low. In practice, one can approximate the cohesion metric to measure the relative profile change per update event. Given N update events that occurred during epoch T , and assuming that the initial profile is empty (all terms weights are zero), Equation 2 is modified to: coh(C, T ) =
N 1 X sim(P (CWi−1 ), P (CWi )) N i=1
(3)
where CWi−1 is the channel without event ei and CWi is the channel after adding event ei . Figure 2 shows the cohesion of 40 Web feeds monitored during two months by our experimental system. We see high variance; where the range of cohesion values is between 0.76 to 0.91, with an average of 0.82. We also make an interesting observation from Figure 2. As we go from the left side of Figure 2 (with the lowest cohesion values) to the right side of Figure 2 (with highest cohesion values) we observe feeds that, judging by their titles, have a more focused topic, resulting in higher cohesion values. These results suggest that the cohesion measure can be used to further identify which channels are more stable than others with regards to the rate of profile change. This observation motivates the exploration of new policies for maintaining channel profiles that also consider the cohesion of the channel content, in addition to standard approaches that only consider update rate. Such monitoring policies will be addressed in the rest of the paper.
4
Note that the term’s idf for channel profiles is different than the static term’s idf in classic IR tasks, where the entire collection of data is given in advance. For channel profiles, the global number of occurrences of a term in the different channels can only be approximated dynamically and is affected by the monitoring process. 5 http://rss.cnn.com/rss/cnn allpolitics.rss
154
4.3.3
Channel Monitoring Policy
A monitoring policy’s task is to maintain accurate channel profiles by deciding which channels to probe6 at any given time. A 6
A probe is a channel pull action (monitoring).
Days 1 2 3 4 5 6 7 8 9 10
Web feed profile’s Top-10 terms gonzales, debate, cnn, ”al qaeda”, senate, ”debate youtube”, questions, house, youtube, appears gonzales, debate, senate, ”al qaeda”, house, qaeda, ”white house”, appears, contradict, ”appears contradict” gonzales, testimony, senate, ”al qaeda”, house, between, obama, ”white house”, alberto, ”alberto gonzales” gonzales, testimony, senate, obama, house, alberto, ”alberto gonzales”, ”white house”, contradiction, fbi gonzales, testimony, obama, house, senate, alberto, ”alberto gonzales”, ”white house”, contradiction, fbi gonzales, testimony, obama, house, senate, alberto, ”alberto gonzales”, ”white house”, white, contradiction gonzales, testimony, alberto, ”alberto gonzales”, obama, general, attorney, ”attorney general”, ”attorney gonzales” brown, roberts, home, justice, maine, chief, ”chief roberts”, ”chief justice”, ”home maine”, ”justice roberts” home, roberts, chief, ”chief justice”, brown, justice, maine, ”chief roberts”, fbi, ”justice roberts” home, justice, roberts, chief, ”chief justice”, brown, stevens, health, ”chief roberts”, maine, fbi
Table 1: The top-10 terms of the CNN Politics Web feed profile captured over ten days in July 2007. Note that the profile is quite stable during the first week, but changes remarkably on the eighth day.
Figure 2: The cohesion values measured for 40 different Web feeds during two months from July to August 2007 channel monitoring task is considered to consist of several costs such as opening a TCP/IP connection to the Web channel provider, capturing its current snapshot by downloading its content, refreshing the channel profile, and updating the index. We further assume a constrained monitoring setting where the monitoring policy is allowed to probe up to M < n channels in parallel at each time T ∈ T . The policy objective is therefore to maximize the quality of the channel profiles by selecting which M channels to probe at any given time, under the defined constrained setting.
4.3.4
Monitoring Quality
Given a channel C ∈ C, we denote the optimal profile at time T ∈ T , P opt (CT ) as the profile obtained by monitoring the channel after each update event in the channel. Given a channel monitoring policy pol, we further denote P pol (CT ) as the profile obtained by the monitoring policy at time T , which in general will be sub-optimal due to some missing non-monitored events caused by policy decisions. The profile monitoring quality obtained by policy pol over the set of channels C, is given by: · ¸ Z 1 X 1 sim(P opt (CT ), P pol (CT ))dT Q(C, pol) = n C∈C |T | T ∈T (4)
155
This quality measure provides an indication of how good the policy pol is with respect to the optimal policy. It measures the average similarity between the optimal profiles obtained by the optimal policy, to the profiles obtained by pol, over time and over the full set of channels.
4.4
Experimental Data and Simulation Setup
We conclude this section with a description of our experimental data that was used to evaluate the monitoring policies proposed in this work with respect to the quality measure described above. For our experiments, we used a collection of real world Web feed data from 132 feeds, taken from different domains such as news (e.g., CNN news), technical data (e.g., Apple technical support), and academic publications (e.g., Wiley publications)7 . We monitored the feeds extensively during a period of three months from July to October 2007. We extracted a total of 68400 unique feed items. The average number of extracted items per feed is 560. The average update rate is 0.284 events per hour with a standard deviation of 0.537. The monitoring policies proposed in this work were evaluated using a controlled simulation environment. The simulator recon7
The collection is available on request directly from the authors.
structs the exact on-line dynamic behavior of each Web feed according to the publication date of the feed items. Evaluated policies are required to select up to M out of n channels for monitoring at every time moment during the simulation runtime, where both M and n are configurable system parameters. Given that the policy has selected a certain feed for monitoring, the current snapshot of the feed at the time of monitoring is given back as feedback, simulating the pull-only access to the Web feed. For each policy-channel pair, the simulator dynamically maintains, the channel profile as maintained by the policy during monitoring runtime. To record the quality obtained by the policy, the simulation further maintains the optimal channel profiles, which are calculated according to the complete stream of update events to the channels. Other parameters can be also given as configuration parameters to the simulator, some of which will be discussed in the next section, e.g., the profile window size W . The simulator was implemented in Java and is based on open source packages, such as ROME feed parser8 and Apache’s HttpClient9 , to download and to extract the feed items from the Web feed. We further used the Juru search system [4] to parse and profile the Web feed content. The simulation experiments were run on a dual-core machine with 2GB RAM and Windows Server Edition OS.
5.
SINGLE CHANNEL MONITORING
This section describes our proposed framework for single channel monitoring. In this simplified case, the number of channels to monitor by the policy, in Equation 4, is reduced to n = 1. We distinguish between off-line and on-line channel monitoring. In the off-line case we follow [6] to apply a policy that monitors the channel in a uniform monitoring rate with respect to the average update rate of the channel. For the on-line case we provide an adaptive learning scheme to derive the channel update rate, which is used to derive a monitoring rate as in the off-line case. We experimentally show the effectiveness of the learning scheme to converge to the same uniform monitoring rate as determined in the off-line case. We further extend the policy to consider the content published on the channel. This extension estimates the rate of novel update events that appear on the channel. This work shows that monitoring based on the novel update rate provides a high quality channel profile with significant reduction in the system resources required for the monitoring task.
5.1
Off-line Monitoring
In the case of off-line monitoring for a given channel C ∈ C, the set of all update events e ∈ C and their corresponding content is known in advance for a given epoch T . This mode is, of course, only possible in retrospect. In practice, only the on-line case is a realistic one, for which the set of update events is unknown in advance. Let θC (T ) denote the update rate for channel C at time T ∈ T and let λC (T ) denote the monitoring rate of channel C at that same time. The off-line monitoring rate of channel C ∈ C is derived as the average update rate in the epoch T ; That is, given that channel C has N update events during T , then for each time T ∈ T the offf line monitoring rate is determined as the uniform rate λof C (T ) = N . |T | f It is worth noting that the off-line (uniform) monitoring rate λof C (T ) 8 9
http://rome.dev.java.net http://jakarta.apache.org/httpcomponents/httpclient-3.x/
serves as a first order approximation to the real (non-uniform) update rate of the channel θC (T ).
5.2
C
5.2.1
Learning On-line Monitoring Rate
We now provide an adaptive scheme based on Reinforcement Learning for deriving the monitoring rate of a channel. For this purpose we use Boltzman Learning [13]. Equation 5 provides the iterative learning rules that we use, assuming that the learning process starts at the beginning of epoch T . Let λon C (0) = λ0 be the initial monitoring rate, selected arbitrarily, and let Tprev = 0 denote the beginning time of epoch T . Let CW 0 denote the set of captured update events between two consecutive probes to channel C that occurred at times Tprev and T respectively, where we define W 0 = [Tprev , T ] and |W 0 | = (T − Tprev ). Then the learning rule is given by: on λon C (T ) = αT · λC (Tprev ) + (1 − αT ) ·
αT = α0 · exp
−T G
|CW 0 | |W 0 |
(5)
αT is a learning parameter that controls the tradeoff between the amount of exploitation and exploration of the learning process. The larger αT is, the more we rely on the current monitoring rate λon C (Tprev ) learned from history (exploitation) and the less we rely on the (local) observed rate (exploration). The G parameter controls the rate of learning where larger values imply a slower learning process. For our experiments we set α0 = 0.1 and G = 100, chosen by trial and error using the full set of Web feeds. Figure 3(a) compares the relationship between the off-line monitoring rate and the on-line monitoring rate derived from the experif mental data described above. The off-line monitoring rate λof C (T ) was determined as described in Section 5.1, using the full set of events captured on the channel during a two-month period. The on-line monitoring rate λon C (T ) was learned for the same period using Equation 5. Each point in Figure 3(a) corresponds to the off-line and the on-line monitoring rates as determined for one of the channels. We observed that the on-line rates are highly correlated (Spearman correlation ρ = 0.96) with the off-line rates. This demonstrates that the on-line monitoring rate, as learned by the learning scheme, converges to the off-line monitoring rate. Figure 3(b) shows the learning curve of the on-line rate over time for the CNN Top-Stories Web feed10 illustrating such convergence. Note that the off-line rate expresses the average rate of updates on the channel, while the on-line rate continuously adapts to the dynamic update rate of the channel. When the update rate is changed over time, the on-line rate will adapt to those changes in a local manner. This might explain the (few) outliers in Figure 3(a).
5.3 10
156
On-line Monitoring
In the on-line case, due to the volatile nature of the channels (and especially in the case of Web feeds), the rate at which we monitor the channel determines how many update events may be captured. With limited system resources for channel monitoring, the monitoring rate should be selected wisely – maximizing the profile quality while minimizing the monitoring rate. In on-line monitoring, the next monitoring time is derived from the current on-line monitoring rate. We denote Tprev the last time that the channel was monitored and λon C (Tprev ) be the current online monitoring rate. Thus, we choose to monitor the channel again at time T = Tprev + λon (T1prev ) .
Channel Monitoring Based on Novelty Detection
http://rss.cnn.com/rss/cnn topstories.rss
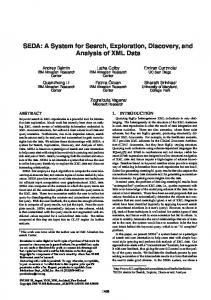
Figure 4: Flow diagram of the on-line monitoring process based on novelty detection. Then, we disregard any event ei ∈ CW 0 if its similarity to the current profile is high. That is: ∆ei coh(C, T ) ≥ coh(C, T ) + β · σcoh(C,T )
Figure 3: (a) The relationship between off-line and on-line monitoring rates of the Web feeds. The diagonal line represent equal values of the two update rates (45 degree slope). The strong correlation (Spearman ρ = 0.96) demonstrates the convergence of the on-line monitoring rates to the off-line monitoring rates. (b) A typical learning curve of the on-line monitoring rate for the CNN’s Top-Stories Web feed.
Otherwise, the event is considered novel following its dissimilarity to the channel profile and its potential for significant influence on the profile. nov Let CW 0 denote the set of remaining detected novel events that pass the novelty filter. The parameter β is a threshold parameter that is used to control the amount of filtering for novelty detection. It controls the tradeoff between monitoring rate and profile quality. A high β means low filtering – most events will be considered novel. Conversely, a low β will cause only a few events to be considered as novel, but this will, in turn, cause insufficient monitoring followed by degradation in channel quality.
5.3.2 We now present a channel monitoring scheme based on novelty detection. The idea behind this scheme is based on the observation that many new events are redundant in terms of providing novel information and do not cause any significant change to the channel profile. Moreover, the rate of new novel events differs from channel to channel therefore it is beneficial to learn the update rate of novel events and then use it as the monitoring rate for the channel. Since novel update rate is usually smaller than the complete update rate, and since a policy based on the novel update rate is expected to provide high quality channel profiles (as will be shown in Section 5.4), we can save valuable system resources.
5.3.1
Novelty Detection Scheme
Our novelty detection scheme works as follows. Similarly to Section 5.2.1, let CW 0 denote an ordered set of captured update events between two consecutive probes to channel C that occurred at times Tprev and T respectively (hence, W 0 = [Tprev , T ]). Furthermore, let coh(C, T ) be the cohesion calculated given the last N captured events on the channel up to time T ∈ T , as determined by Equation 3. We first calculate for each event ei ∈ CW 0 its marginal influence on the channel cohesion, given by: ∆ei coh(C, T ) = sim(P (CWi−1 ), P (CWi )) We further determine the standard deviation of the channel cohesion using the following unbiased estimator: v u N u 1 X (∆ei coh (C, T ) − coh (C, T ))2 (6) σcoh(C,T ) = t N − 1 i=1
157
(7)
Applying Novelty Detection for Monitoring
Using the novelty detection filter for off-line monitoring is straightforward - apply the filter on the complete set of events and calculate the off-line monitoring rate while considering only novel events. In the on-line case, Figure 4 shows a flow diagram of the process of updating the on-line monitoring rate using the novelty detection filter. The different equations involved in the calculation are also given next to their relevant components. Starting from the leftmost component, suppose that N1 new update events are captured between two consecutive monitoring times Tprev and T , which are kept in the buffer CW 0 in Figure 4. Further, suppose that prior to time T a total of N2 events were captured, thus resulting in a total of N = N1 + N2 events at time T . Then, we update Equation 3 to maintain the channel cohesion value on-line: N X 1 N2 · coh(C, Tprev ) + coh(C, T ) = sim(P (CWi−1 ), P (CWi )) N i=N +1 2
(8)
The coh(C, Tprev ) value is taken from the History component in Figure 4 that maintains both the last calculated channel cohesion value and the novel monitoring rate, and is updated after every monitoring probe. The Novelty Filtering component uses the previous and the new cohesion values to calculate the standard deviation of the channel cohesion using Equation 6. It then applies the filtering rule of Equation 7 on the new N2 update events captured at nov time T . The output of this component CW 0 is then used to derive the observed novelty update rate at time T , which is combined with the history learned rate (λnov C (Tprev )) according to the adapnov tive rules of Equation 5, where CW 0 ← CW 0 . This provides the current monitoring rate λnov (T ). C It is worth noting that by using this on-line scheme we reduce
Figure 5: Effect of the threshold β on monitoring quality (offline analysis)
Figure 6: Quality loss versus the gain in cutting the number of probes as a function of the filtering threshold parameter β (off-line analysis).
the expensive complexity in maintaining channel cohesion, where we consider only the current buffer of captured events in [Tprev , T ] for novelty detection filtering.
5.4
Performance Analysis
Our performance analysis study provides empirical evidence that using the proposed content-based scheme of Section 5.3.2 compared to the content-free scheme of Section 5.2.1, we can maintain high quality channel profiles with a significant savings in the number of probes required for this task. For example, the proposed content-based scheme reduces the number of times it probes channels by 50% while losing no more than 5% in quality. For this purpose we ran the simulation using the full set of Web feeds. Each feed was monitored twice, once using the contentfree monitoring scheme and once using the content-based monitoring scheme. We measured the quality obtained by applying each monitoring scheme on each feed according to Eq. 4. In addition, we recorded the total number of probes made by monitoring each feed according to each scheme. Using these two measures we further calculated for each feed the ratio of quality loss and probe cutoff (gain) between the two monitoring schemes as follows. Given a feed C ∈ C, let Q(C, f ree) and K(C, f ree) denote the quality and number of probes of the content-free scheme, and let Q(C, content) and K(C, content) denote the quality and number of probes of the content-based scheme. We then calculate the quality loss as Qloss (C) = 1 − Q(C,content) and probe cutoff Q(C,f ree) as Kcutof f (C) =
5.4.1
K(C,f ree) K(C,content)
− 1.
Novelty Filtering Threshold Analysis
We first studied the effect of the filtering threshold β on profile quality. Figure 5 shows the effect of different β values on channel profile quality in the off-line case. We observe that increasing β increases the average quality per channel (feed). Obviously, larger β values imply that more events are considered novel and thus the corresponding monitoring rate is larger and increases quality. Moreover, for β ≥ 0.1 the average quality among the different monitored channels is at least 95% from optimal. Finally, the 98-percentile curve of the channel profiles quality shows that for β ≥ 0.25 at least 98% of the monitored channels have at least 95% of the optimal profile quality. Using the same off-line case, we further explored the novelty detection scheme’s trade-off between monitoring quality and saving monitoring resources. We measured the relative cutoff in the number of probes compared to the loss in quality resulting from the cutoff. Figure 6 shows the loss in the average quality of the channel profiles as well as the average gain due to less probes, as a
158
Figure 7: Sensitivity analysis of the quality loss with respect to different profile window size W , in on-line setting using β = 0.1. function of β. We can clearly see a small loss in quality compared to significantly fewer probes for reasonable β values. For instance, for β = 0.1, we lost 5% in average profile quality while cutting down a third of the probes (50% gain).
5.4.2
Profile Window Size Analysis
We further evaluated the effect of the profile window size W in terms of the number of update events considered for profile calculation on the quality-budget trade-off in the on-line monitoring setting. In this experiment we fixed the threshold parameter β = 0.1 that we learned in the off-line analysis. Figure 7 shows results of this evaluation. We observe that the quality loss is directly affected by the profile window size W . As the window size increases, the profile provides a wider perspective of the channel and therefore there is less chance of missing update events and deviating from the optimal profile; hence the quality loss is reduced. Using the evaluation results presented in this section we conclude that the monitoring scheme based on novelty detection indeed provides better utilization of the monitoring budget while producing high quality channel profiles. This observation will be supported in the next section that further explores the multi-channel monitoring case.
6.
MULTI-CHANNEL MONITORING
A monitoring policy is allowed to monitor at most M channels in parallel. Thus, the profile quality obtained for multi-channel mon-
itoring depends on the policy’s on-line decisions of which channels to monitor over time. In the following we introduce a simple classification scheme for multi-channel monitoring policies (Section 6.1). We then introduce inter-channel profile similarities as a means of further refining the monitoring rates (Section 6.2). Finally, we present an empirical evaluation study on the performance of these policies (Section 6.3).
6.1
Monitoring Policies
We now define the importance of a channel during time to be relative to its monitoring rate, as derived by the learning scheme presented in Section 5. A channel with higher monitoring rate is considered more important. Note that the relative importance of a channel is changed dynamically over time according to the change in the derived monitoring rate. The monitoring policies can be classified according to two main properties. The first property classifies the policies as either greedy or fair. A greedy monitoring policy, such as those described in [18, 24], monitors the most M important channels at any moment in time.11 A fair policy, on the other hand, selects M channels at random, according to the distribution induced by the channel relative importance values. The second property relates to the policy attention to the content of the update events. A policy that ignores content is termed a content-free policy while a policy that considers content is termed a content-based policy. When the content is ignored, the monitoring rates are learned as described in Equation 5. When the content is also considered, the monitoring rate of each channel is calculated using the novelty detection filter. Since the monitoring rates of the channels determine their relative importance, a certain channel might have different importance values under content-free or content-based policies, due to the difference in monitoring rates. Based on the classification described above, we experiment with four policy types: content-free (greedy), content-free (fair), contentbased (greedy), and content-based (fair). The four policy types represent a wide range of possible policies for multi-channel monitoring.
6.2
Using Inter-channel Profile Similarities for Refining Channel Monitoring Rates
We now proposed a regularization scheme that can be used to further refine the channel monitoring rates based on inter-channel profile similarities. Using this scheme, we can refine a channel’s monitoring rate according to its profile similarity to other channels’ profiles without actually having to probe that channel. For example, suppose a channel’s profile has high similarity with the profile of another channel that has just been monitored (and therefore, its monitoring rate has been updated). Therefore, an increase in the last channel’s monitoring rate will cause an increase in the first channel’s monitoring rate as well. For this propose we maintain an n×n similarity matrix S, where a matrix entry Si,j corresponds to the average profile similarity between channel Ci profile and channel Cj profile during a given 11
It is worth noting that policies such as the ones of [18, 24] assume the availability of a given update model, while we learn the model on-line. Furthermore, we note that our monitoring rate learning methods can be easily integrated with any other monitoring solution that requires an update model as input. Therefore, our analysis for the multi-channel case also provides a proof of concept for the ease of usage of our methods by a wide range of other possible monitoring policies.
159
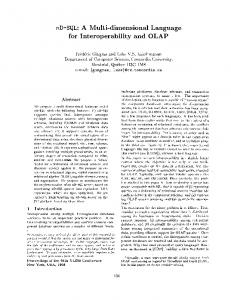
Figure 8: The average profile similarity matrix of 80 different Web feeds calculated over a period of two months between August to October 2007.
time period T , which is calculated as follows: Z 1 sim(P (Ci,T ), P (Cj,T ))dT Si,j = |T | T
(9)
We then normalize every row i of matrix S by dividing each entry Si,j by the total sum of values on that row. Figure 8 provides an 3D illustration of a similarity matrix that was calculated for about 80 different Web feeds over a period of two months from August to October 2007. Only half of the matrix is illustrated due to its symmetry. For clarity of presentation, we also eliminated the matrix diagonal, which should of course be all ’1’. Table 2 further provides the highest average similarity values that were recorded for different pairs of Web feeds. We also provide a definition of the relationship between each pair of Web feeds as was determined by a human assessment, either an inclusion (denoted C1 ⊂ C2 ) or a similarity (denoted C1 ∼ C2 ). For example, the content published on the NY-TIMES.TECHNOLOGY.Circuits Web feed is almost completely contained in the content that is published on the NY-TIMES.TECHNOLOGY Web feed (resulting in very high profile similarity). We now discuss how we use the similarity matrix S to refine − → the monitoring rates. Let λC (T ) = (λC1 , λC2 , . . . , λCn ) denote a vector of channel monitoring rates at time T , and let S norm (T ) denote the normalized similarity matrix as calculated at time T .12 We then refine the monitoring rates as follows: − → − → λC 0 (T ) = S norm (T ) × λC (T )
(10)
It is worth noting that a channel Ci whose profile is not siminorm lar to any of the other channel profiles will have Si,j6 =i = 0 and norm Si,i = 1, and therefore, after applying Eq. 10 its monitoring rate will remain unchangeable and depend solely on the channel’s own update events (content). Otherwise, the channel shares some profile similarity with other channels in the system and therefore its monitoring rate is determined by the relative similarity its profile has with the other channel profiles and the current channel monitoring rates. As we will show later on in Section 6.3.2, such refinement can further improve the quality of maintained channel profiles. 12
This calculation can be done incrementally.
Channel 1 (C1 )
Channel 2 (C2 )
NY-TIMES.HEALTH.Fitness and Nutrition NY-TIMES.TECHNOLOGY.Circuits CNN.Top Stories APPLE.New Software Articles.Mac OS X BBC.UK NY-TIMES.SPORTS.Pro Baseball WILEY.Business WILEY.Chemistry
NY-TIMES.SCIENCE.Nutrition NY-TIMES.TECHNOLOGY CNN.Most Popular APPLE.New Software Articles.dot Mac BBC.News Front Page NY-TIMES.SPORTS WILEY.Accounting WILEY.Engineering
Average profile similarity 0.98936 0.92181 0.4888 0.45744 0.43452 0.28882 0.26385 0.21652
Type of relationship C1 C1 C1 C1 C1 C1 C1 C1
∼ ⊂ ∼ ∼ ∼ ⊂ ∼ ∼
C2 C2 C2 C2 C2 C2 C2 C2
Table 2: The top average profile similarity values between different pairs of Web feed profiles as was measured between August to October 2007.
Figure 9: The average quality obtained by the four different policies with respect to different monitoring budget levels (different M values).
6.3
Evaluation
We now present an empirical evaluation of the different policies that were proposed in Section 6.1 using varied parameter settings. In general, the two content-based policies dominated their content-free counterparts. We then show that the monitoring rates refinement scheme of Section 6.2 can further help to improve the performance.
6.3.1
Content-based versus Content-free
Figure 9 reports the results of a simulation we conducted monitoring the full set of 132 channels while using different monitoring budgets (i.e., different M values). The graph shows the average profile quality obtained by the different policies for different M values. The two content-free policies are represented by complete lines, while the two content-based policies are represented by dashed lines. We fixed the profile window size to be W = 20 and further fixed β = 0 as the novelty filtering threshold for the content based policies. The obvious observation from Figure 9 is that the quality obtained by the policies increases as the monitoring budget increases. Furthermore, the empirical results reveal two interesting observations. First, both content-based policies dominate the content-free policies at every budget level. These results support the empirical observations made in Section 5 on single channel monitoring. The results further suggest that considering the content for the derivation of channel monitoring rates and using them to determine the relative channel importance can improve the quality obtained by content-based policies. Second, we observe that while fairness provides better quality over greediness for the content-free policies, this is not the same for the content-based policies. The content-based (greedy) policy dominates the other three policies. This observation implies
160
Figure 10: The average quality obtained by the four different policies with respect to different profile window sizes (different W values).
that when content is not considered, it is preferable to fairly share the budget between the different channels and avoid making local greedy decisions. On the other hand, these results further imply that content-based policies may benefit from some greedy decisions when the budget is spread more efficiently among the different channels. Nevertheless, fairness might still be the preferred choice, for example when the policy monitors channels where most of them have high novel content rates. To explore the effect of profile window size on the four different policies we fixed the monitoring budget to be M = 6 and ran the simulation using different profile window size (W ) values. Figure 10 reports on the average quality obtained by the four policies for the different profile window sizes. We observed that as we increase the profile window size, we improve the quality obtained by all four policies; yet again, with less remarkable improvement for the content-free (greedy) policy. We also observed that the two content-based policies still dominate the two other content-free policies, and manage to better utilize the monitoring budget for every profile window size. Overall the two content-based policies show almost similar performance, suggesting that any type of content-based policy, whether fair, greedy, or in between, may achieve better performance than any possible content-free policy. We further analyzed the effect of the novelty filtering threshold β on the performance of the two content-based policies. We again fixed the monitoring budget to M = 6 and fixed the profile window size to W = 20. Figure 11 provides the results of this analysis, illustrating an interesting observation. As β values increase, less update events get filtered and the two content-based policies behave differently. For β ≤ 0 (more novelty filtering) we observe that overall the two policies keep their same performance level, where the greedy policy further dominates the fair policy. On the other
Figure 11: The average quality obtained by the two contentbased policies with respect to different novelty filtering threshold values (different β values).
hand, for β > 0 (less novelty filtering) we observe that the two policies show opposite trends. While the fair policy remains quite robust and even improves slightly with the increase in the filtering threshold, the greedy policy performance completely deteriorates, almost to the level of quality obtained by its content-free counterpart greedy policy. This can be explained as follows: as less update events are filtered, the monitoring rates are less affected by the novelty filter and the two policies behave similarly to their content-free counterpart policies. Therefore, the content-based (fair) policy dominates the content-based (greedy) policy in a similar way the content-free (fair) dominates the content-free (greedy) policy in Figure 9. To conclude, overall, the simulation results clearly show that taking content into consideration, by the multi-channel monitoring policies, improves the overall obtained quality of the channel profiles.
6.3.2
Utilizing Inter-channel Profile Similarities
Finally, we evaluated the inter-channel profile similarities refinement scheme that was presented in Section 6.2. For this purpose we experimented with the content-based (fair) policy using different levels of novelty filtering thresholds (β). For β > 0, the contentbased (fair) policy dominates the content-based (greedy) policy, and therefore, we would like to improve its performance furthermore by utilizing inter-channel profile similarities. Figure 12 reports on the average quality obtained by using the policy without refinement (serving as a baseline) and with refinement for three different monitoring budget levels (M = 4, 6, 8). The profile window size was fixed to W = 20. The upper part of Figure 12 has the results for β = 0.2 which corresponds to mild filtering, and the lower part of Figure 12 has the results for β = 0 which corresponds to more filtering. We observe, that in general, the refinement scheme manages to improve the baseline performance of the policy for all budget levels, where the highest improvement is by 15%. Furthermore, we observe that the improvement is much better when mild novelty filtering is used (β = 0.2). To explain, a more aggressive novelty filtering may result in lower inter-channel profile similarities, and therefore, a channel’s monitoring rate is less effected by the other channels’ monitoring rates. We conclude, that indeed, inter-channel profile similarities can
161
Figure 12: The average quality obtained by the content-based (fair) policy with and without applying the inter-channel profile similarities refinement scheme. The upper and lower figures correspond to usage of novelty filtering threshold β = 0.2 (mild filtering) and β = 0 (more filtering) respectively. be efficiently utilized to further refine the channel monitoring rates and improve the overall performance.
7.
SUMMARY
We presented a novel problem of maintaining channel profiles on the Web. We discussed the benefit of maintaining such profiles for new emerging Web 2.0 applications and current existing applications such as feed readers and personalized search services. We described existing Web monitoring solutions and discussed their main differences from our work and the new challenges involved in monitoring channel profiles. We then introduced some new measures of profile monitoring quality. Using these measures, we demonstrated the necessity for new methods for maintaining channel profiles. We discussed both off-line and on-line monitoring cases and the challenges in monitoring profiles on-line. For the on-line case, we proposed a novel monitoring scheme based on reinforcement learning for the derivation of channel monitoring rates. We further presented an extension of this monitoring scheme by considering the content that is published on the channel. We suggested a novelty detection filter that refines the monitoring rate according to the rate at which novelty content is expected to be produced on the channel. We also demonstrated how inter-channel profile similarities can be utilized to refine more the monitoring rates. Using real-world data of Web feeds, we studied the performance of the on-line monitoring scheme for single and multi-channel monitoring. Our empirical study showed that the monitoring rates learning, combined with the on-line novelty detection, can guarantee high quality channel profiles, while significantly cutting down the monitoring budget which in turn improve the overall performance. Finally, we further showed that inter-channel profile similarities can be utilized to improve more the performance.
8.
FUTURE WORK
For future work we consider the following directions. Initially we plan to improve the derivation of channel monitoring rates using additional machine learning techniques. For example, we wish to construct an automatic learning scheme for the filtering rule threshold. Learning a threshold adaptively for each channel can result in even better quality-budget trade-off performance. A second direction is to extend the current channel profile model to consider the dynamic information requirements of the different applications that access the Web channels. This can be achieved, for example, using the application user profiles. Using such dynamic user profiles will enable further adjustment of the channel profile to adapt to the user needs by considering parameters such as topic popularity and user data access patterns. A third future direction involves the exploration of new techniques, possibly based on utility based models, to automatically select and discover relevant Web channels for a given client profile. For this purpose we plan to utilize other reinforcement learning techniques. We also plan to integrate the proposed solutions of this work in a real server-side Web feed aggregation system. In general, we plan to expose advanced search capabilities over Web feeds and Web channels. We further plan to add Web channel recommendation capabilities to this system so it can recommend relevant Web channels given a client profile.
9.
REFERENCES
[1] T. Brants and F. Chen. A system for new event detection. In SIGIR ’03: Proceedings of the 26th annual international ACM SIGIR conference on Research and development in informaion retrieval, pages 330–337, New York, NY, USA, 2003. ACM. [2] L. Brenna, A. Demers, J. Gehrke, M. Hong, J. Ossher, B. Panda, M. Riedewald, M. Thatte, and W. White. Cayuga: a high-performance event processing engine. In SIGMOD ’07: Proceedings of the 2007 ACM SIGMOD international conference on Management of data, pages 1100–1102, New York, NY, USA, 2007. ACM. [3] L. Bright, A. Gal, and L. Raschid. Adaptive pull-based policies for wide area data delivery. ACM Transactions on Database Systems (TODS), 31(2):631–671, 2006. [4] D. Carmel and E. Amitay. Juru at TREC 2006: TAAT versus DAAT in the terabyte track. In Proceedings of the 15th Text REtrieval Conference (TREC2006). National Institute of Standards and Technology. NIST, 2006. [5] D. Carmel, E. Farchi, Y. Petruschka, and A. Soffer. Automatic query refinement using lexical affinities with maximal information gain. In SIGIR ’02: Proceedings of the 25th annual international ACM SIGIR conference on Research and development in information retrieval, pages 283–290. ACM Press, 2002. [6] J. Cho and H. Garcia-Molina. Synchronizing a database to improve freshness. In SIGMOD ’00: Proceedings of the 2000 ACM SIGMOD international conference on Management of data, pages 117–128, New York, NY, USA, 2000. ACM. [7] J. Cho and H. Garcia-Molina. Effective page refresh policies for web crawlers. ACM Transactions on Database Systems (TODS), 28(4):390–426, 2003. [8] J. Cho and H. Garcia-Molina. Estimating frequency of change. ACM Transactions on Internet Technology, 3(3):256–290, 2003. [9] J. Eckstein, A. Gal, and S. Reiner. Monitoring an information source under a politeness constraint. INFORMS Journal on Computing, 2007. [10] E. Gabrilovich, S. Dumais, and E. Horvitz. Newsjunkie: providing personalized newsfeeds via analysis of information novelty. In WWW ’04: Proceedings of the 13th international conference on World Wide Web, pages 482–490, New York, NY, USA, 2004. ACM. [11] A. Gal and J. Eckstein. Managing periodically updated data in relational databases: a stochastic modeling approach. Journal of the ACM (JACM), 48(6):1141–1183, 2001.
162
[12] S. Garg, K. Ramamritham, and S. Chakrabarti. Web-cam: monitoring the dynamic web to respond to continual queries. In SIGMOD ’04: Proceedings of the 2004 ACM SIGMOD international conference on Management of data, pages 927–928, New York, NY, USA, 2004. ACM. [13] L. P. Kaelbling, M. L. Littman, and A. W. Moore. Reinforcement learning: A survey. Journal of Artificial Intelligence Research (JAIR), cs.AI/9605103, 1996. [14] R. kr. Majumdar, K. M. Moudgalya, and K. Ramamritham. Adaptive coherency maintenance techniques for time-varying data. In RTSS ’03: Proceedings of the 24th IEEE International Real-Time Systems Symposium, page 98, Washington, DC, USA, 2003. IEEE Computer Society. [15] H. Liu, V. Ramasubramanian, and E. G. Sirer. Client behavior and feed characteristics of RSS, a publish-subscribe system for web micronews. In IMC’05: Proceedings of the Internet Measurement Conference 2005 on Internet Measurement Conference, pages 3–3, Berkeley, CA, USA, 2005. USENIX Association. [16] G. Luo, C. Tang, and P. S. Yu. Resource-adaptive real-time new event detection. In SIGMOD ’07: Proceedings of the 2007 ACM SIGMOD international conference on Management of data, pages 497–508, New York, NY, USA, 2007. ACM. [17] A. Ntoulas, J. Cho, and C. Olston. What’s new on the web?: the evolution of the web from a search engine perspective. In Proceedings of the 13th international conference on World Wide Web (WWW), pages 1–12, 2004. [18] S. Pandey, K. Dhamdhere, and C. Olston. WIC: A general-purpose algorithm for monitoring web information sources. In Proceedings of the 30th International Conference on Very Large Data Bases (VLDB), pages 360–371, 2004. [19] S. Pandey and C. Olston. User-centric web crawling. In Proceedings of the 14th international conference on World Wide Web (WWW), pages 401–411, New York, NY, USA, 2005. ACM. [20] R. K. Pon, A. F. Cardenas, D. Buttler, and T. Critchlow. Tracking multiple topics for finding interesting articles. In KDD ’07: Proceedings of the 13th ACM SIGKDD international conference on Knowledge discovery and data mining, pages 560–569, New York, NY, USA, 2007. ACM. [21] D. Radev, J. Otterbacher, A. Winkel, and S. Blair-Goldensohn. Newsinessence: summarizing online news topics. Communications of the ACM, 48(10):95–98, 2005. [22] H. Roitman, A. Gal, and L. Raschid. Profile based online data delivery. In Proceedings of the VLDB ’06 Phd Workshop, Seoul, Rep. of Korea, 2006. [23] H. Roitman, A. Gal, and L. Raschid. Capturing approximated data delivery tradeoffs. In ICDE’08: Proceedings of the 24th International Conference on Data Engineering, pages 1471–1473, 2008. [24] H. Roitman, A. Gal, and L. Raschid. Satisfying complex data needs using pull-based online monitoring of volatile data sources. In ICDE’08: Proceedings of the 24th International Conference on Data Engineering, pages 1465–1467, 2008. [25] G. Salton and C. Buckley. Term weighting approaches in automatic text retrieval. Information Processing and Management, 24(5):513–523, 1988. [26] K. C. Sia, J. Cho, and H.-K. Cho. Efficient monitoring algorithm for fast news alerts. IEEE Transactions on Knowledge and Data Engineering, 19(7):950–961, 2007. [27] K. C. Sia, J. Cho, K. Hino, Y. Chi, S. Zhu, and B. L. Tseng. Monitoring rss feeds based on user browsing pattern search. In Proceedings of the International Conference on Weblogs and Social Media, 2007. [28] Y.-C. Tu, S. Liu, S. Prabhakar, and B. Yao. Load shedding in stream databases: a control-based approach. In VLDB ’06: Proceedings of the 32nd international conference on Very large data bases, pages 787–798. VLDB Endowment, 2006. [29] Y. Zhang, J. Callan, and T. Minka. Novelty and redundancy detection in adaptive filtering. In SIGIR ’02: Proceedings of the 25th annual international ACM SIGIR conference on Research and development in information retrieval, pages 81–88, New York, NY, USA, 2002. ACM.