likelihood framework can be applied, data sequences must be aligned. During alignment, one of many known algorithms (see [Pevzner, 2000], pp123-132 for an.
MAXIMUM LIKELIHOOD FRAMEWORK FOR GENETIC SEQUENCE ANALYSIS.. SERGEI L. KOSAKOVSKY POND ANTIVIRAL RESEARCH CENTER UNIVERSITY OF CALIFORNIA, SAN DIEGO
We begin by describing a methodology (first introduced in [Felsenstein, 1981]) for stochastic modeling of evolutionary processes which give rise to N extant genetic sequences from a single unknown ancestral sequence. Two types of biological events are explicitly modeled: (i) speciation, i.e. divergence of two or more distinct lineages from an ancestor, and (ii) point substitutions, i.e. replacement of genetic character data with other characters over time. There are other biological events which lead to evolutionary change, such as recombination, translocation, gene duplication, creation of introns and many others, which, while not directly modeled here, may be investigated - to varying degrees - by an application of the maximum likelihood framework. We assume that observed data D consist of N strings (sequences) over a finite alphabet C. Three most frequently used alphabets are the following: (1) Nucleotides: A (adenine), C (cytosine), G (guanine) and T/U (thymine or uracil for RNA). This alphabet is used when studying DNA or RNA sequences directly. (2) Aminoacid: The alphabet of 20 residues found on protein polypeptide chains, applicable to analysis of primary protein structures. (3) Codon: The alphabet of 61 (for most organisms) codons, i.e. triplets of nucleotides with certain combinations (stop codons) omitted, appropriate when investigating the evolution of coding regions of DNA sequences, i.e. the regions which are translated into proteins by the machinery of the cell. For a current listing of genetic codes refer to [NCBI, 2000]. The process of speciation/divergence is represented by a phylogenetic tree T - an acyclic directed graph - whose leaves correspond to extant sequences, and internal nodes represent (typically) unknown intermediate ancestral sequences. The root node of the tree corresponds the the ultimate ancestral sequence, and branching describes divergence of two or more species. We do not place restrictions on the maximum degree of internal tree nodes, although it is customary to consider binary trees, because multiple speciation events are rare. Each position in a present-day sequence represents a physical location (site) on the genome of the corresponding organism. It is possible that over the course of evolutionary history, the physical location of a given site changed from organism to organism, and that certain sites are only present in a subset of N sequences, due to insertion and deletion of subsequences. Typically, the sequences that we wish to analyze are homologous, i.e. such that all sites share a common evolutionary path and sequences as a whole serve similar functions in extant species. A good 1
2
SERGEI L. KOSAKOVSKY POND
b1
A b2
T b8
C b3
T b7
T b4
T b6
T
b5
T T
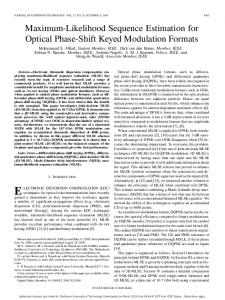
Figure 1. Example of a phylogenetic tree with known ancestral states. example would be a gene present in all organisms in the data set. Before maximum likelihood framework can be applied, data sequences must be aligned. During alignment, one of many known algorithms (see [Pevzner, 2000], pp123-132 for an overview) is used to identify the sites which were derived from a common ancestral state, and subsequent insertion/deletion events are accounted S for. All sequences in an alignment have the same length - M characters from C {0 −0 }, where ’-’ denotes a deletion (or insertion). 1. General remarks on likelihood function evaluation. We label branches of the tree T by bi , where i ranges from 1 to the total number of branches in the tree. When we consider a rooted binary tree with N leaves, the total number of branches is 2N − 2. Each branch is associated with the node it is incident upon and has an associated transition probability function (1)
Qix,y (t; θ) = P rθ {x is replaced with y in time t : x, y ∈ C} ,
where the superscript i denotes the index of the branch that the transition function is associated with. The transition probability function depends on the branch length ti , and, possibly, other parameters, referred to cumulatively by θ. We further assume that substitution processes along each branch operate independently of one another. If characters at the internal nodes of the trees, i.e. ancestral sequences, were known, then evaluating the likelihood of a particular alignment site Ds , given the tree T , a vector of parameter values and branch lengths, would be a simple matter of multiplying all the relevant transition probabilities. For instance, the likelihood of observing the nucleotide data given the tree and branch lengths in Figure 1 can be evaluated as follows: L(Ds ; T , θ)
= Q1T,A (t1 ; θ)Q8T,T (t8 ; θ)Q2T,C (t2 ; θ)Q7T,T (t7 ; θ) × Q3T,T (t3 ; θ)Q6T,T (t6 ; θ)Q4T,T (t4 ; θ)Q5T,T (t5 ; θ)
MAXIMUM LIKELIHOOD FRAMEWORK FOR GENETIC SEQUENCE ANALYSIS..
b1
A b2
c9 b8
C b3
c8 b7
3
T b4
c7 b6
c6
b5
T T
Figure 2. Example of a phylogenetic tree with unknown ancestral states. Ds refers to the s-th column in a multiple sequence alignment (ACTTT in this case). Clearly, it is unreasonable to demand that ancestral sequences be known. Most often, all that can be observed are leaf sequences, which correspond to modern day organisms. Therefore, we need to be able to evaluate the likelihood of the data knowing only leaf characters. To do so, we compute the sum over all possible character assignments to internal nodes of the tree. Using Figure 2 as a reference, such an evaluation would proceed as follows: X X X X L(Ds ; T , θ) = π(c9 )Q1c9 ,A (t1 ; θ)Q8c9 ,c8 (t8 ; θ)Q2c8 ,C (t2 ; θ) × (2) c9 ∈C c8 ∈C c7 ∈C c6 ∈C
Q7c8 ,c7 (t7 ; θ)Q3c7 ,T (t3 ; θ)Q6c7 ,c6 (t6 ; θ)Q4c6 ,T (t4 ; θ)Q5c6 ,T (t5 ; θ), where π(c) denotes the probability of observing character c ∈ C at the root of the tree. While this calculation is straightforward, it is clearly not computationally feasible, because for a tree on N sequences, there will be |C|N −2 terms in the sum. However, recalling that transition probabilities along a branch are independent of other branches, it is possible to rearrange the sum in a computationally efficient manner. 2. Recursive nature of the likelihood function. Upon closer examination, Eq. (2), can be rewritten in a more computationally efficient way by grouping the terms according to their hierarchical arrangement in the tree: X X L(Ds ; T , θ) = π(c9 )Q1c9 ,A (t1 ; θ) Q8c9 ,c8 (t8 ; θ)Q2c8 ,C (t2 ; θ) × c9 ∈C
c8 ∈C
! X c7 ∈C
Q7c8 ,c7 (t7 ; θ)Q3c7 ,T (t3 ; θ)
X
Q6c7 ,c6 (t6 ; θ)Q4c6 ,T (t4 ; θ)Q5c6 ,T (t5 ; θ)
c6 ∈C
The sum, as just written, can be evaluated with O(|C|2 N ) operations, which is eminently feasible. This observation was first made by Felsenstein in [Felsenstein, 1981], and he referred to it as the pruning algorithm.
�
4
SERGEI L. KOSAKOVSKY POND
Formally, we introduce the partial likelihood Li (n), which is the likelihood for the subtree below node n given that the character at node n is i. The following properties of partial likelihood hold: (1) If n is a leaf node, then Li (n) = 0 if i is not the observed character, and Li (n) = 1 otherwise. (Sequence data often contain ambiguities or gaps. The definition of the likelihood at a leaf can be extended to accommodate these as well, and we will address it in section 3). (2) If nodes ld , d = 1 . . . D are the immediate descendants of an internal node QD P d (tld ; θ)Lj (ld ). n then Li (n) = d=1 j∈C Qli,j (3) If r is the rootPnode of the tree, then the likelihood for the entire tree is L(Ds ; T , θ) = i∈C π(i)Li (r). The pruning algorithm offered the first substantial computational improvement for evaluating the likelihood function, taking advantage of the recursive nature of the function. The likelihood for an alignment column is computed by calculating the partial likelihoods starting at the leaves and working up to the root. For the tree in Figure 3, the partial likelihoods are computed in the following order: 1, 2, 8, 3, 10, 4, 5, 6, 9, 7, 11, 12, consistent with the post-order tree traversal order.
12 uXX �A XXXX � A XXX XXX � A XXX � A Xu11 10 � u A �A � �A A � � A A A � A � A A A � 9 �u A A A � 8 u �A A A A � A �A A A � A A A � A A A � A A � A A A � u Au Au � Au Au Au �u 5 6 7 1 2 3 4 Figure 3. Example tree for recursive likelihood evaluation. The internal nodes are emphasized in bold, and partial likelihood computations at these nodes involve summations. Finally, to compute the likelihood of the entire alignment, we recall the assumption that every site in the sequence evolves independently other sites, and thus: (3)
L(D; T , θ) =
M Y
L(Ds ; T , θ).
s=1
Clearly, if two alignment columns are the same, then likelihoods for those columns are equal. If there are 1 ≤ U ≤ M unique data columns in the alignment, and nu is the number of the same columns of type u, then, by numbering the unique columns,
MAXIMUM LIKELIHOOD FRAMEWORK FOR GENETIC SEQUENCE ANALYSIS..
b1
b1
A b2
b8
A
– b8
b3 b7
5
b3
T b4
b6 b5
T
b7 –
b6 b5
T
T
Figure 4. Phylogenetic tree with ambiguous data and its simplification. 1, 2, . . . U , L(D; T , θ) =
u Y
Lnu (Ds ; T , θ).
s=1
The technique of combining equal data columns in the same class is called aliasing. Clearly, in an N sequence alignment there can be at most O(|C|N ) unique column types. Therefore, for fixed N , computational complexity of likelihood evaluations has an upper bound independent of the number of columns (M ) present in the alignment. In other words, when M is small, each new column type is likely to be unique and hence increase computational complexity linearly. However, as M becomes larger, it is more likely that a new column is equal to another alignment column, and thus complexity remains the same. 3. Handling ambiguities in the data. Sequence alignments often contain ambiguities, i.e. characters which indicate the presence of one character from a class, for example ‘Y‘ means a pyrimidine (‘C‘ or ‘T‘) in nucleotide data and is a 2-fold ambiguity. Such characters arise due to sequencing issues or presence of deletions/insertions. We agree to treat a deletion/insertion as a |C|-fold ambiguity. Our substitution models do not include ambiguous states explicitly, but it is desirable to extract as much information as possible from an alignment column. One approach would be to eliminate all columns with ambiguities from analysis, but it seems wasteful, because often only a few sequences contain such characters in a particular column, and other sequences should not be discarded without thought. We propose the following technique to extend the definition of partial likelihoods from section 2: if n is a leaf node, then Li (n) = 1 if i is in the class of characters referred to by the character labeling n, and Li (n) = 0 otherwise for i in the alphabet C. For instance: if n is labeled by Y, then LA (n) = LG (n) = 0 and LC (n) = LT (n) = 1. As an another example, if n is labeled by a deletion/insertion ‘-‘, then Li (n) = 1 for all i. As an example of the intuition leading to the above definition consider the trees in Figure 4. As we will see next, the likelihoods of both trees are the same, and
6
SERGEI L. KOSAKOVSKY POND
hence it makes good sense to treat a deletion/insertion simply as a missing species. Consider, for example, the partial likelihood at node 6, at the end of branch b6 X Li (6) = Q5i,T (t5 ; θ) Q4i,j (t4 ; θ). j∈C 4
Since Q is a transition probability function, the sum evaluates to 1 and Li (6) = Q5i,T (t5 ; θ), which is precisely the partial likelihood of node 6 in the simplified tree. Thus, the presence of a deletion/insertion in a sequence at an alignment site is treated as if that sequence were not present at all, while all sequences with informative characters are still included in the analysis. For ambiguities which are not completely uninformative, the extended definition of partial likelihoods is equivalent to summing over all possible assignments of characters to ambiguous leaves. 4. Column sorting: Rapid calculation of the phylogenetic likelihood function. When likelihood functions for data sets are computed, the same tree and trann sition probabilities Qn i,j (t , θ) are used at each column. The same series of partial likelihood calculations are performed in the same order, differing only in the values at the leaves (i.e., different columns in the multiple sequence alignment). The total likelihood is then found by taking the product of all the individual site likelihoods, as in Eq. (3). Suppose the tree in Figure 3 is used to compute the likelihood using the following data: 123456 (Sites) leaf 1 CAACCA leaf 2 TGGCTG leaf 3 TGACTA leaf 4 CGGCCG leaf 5 CGACCA leaf 6 CAACCG leaf 7 GGACAA In a na¨ıve implementation, six pruning algorithm passes are needed to evaluate the likelihood function, one for each alignment column, resulting in a total of 30 partial likelihood calculations at the internal nodes. Notice that the total likelihood does not depend on the order in which the likelihoods of sites were computed. However, site ordering does affect the number of partial likelihood evaluations. When the likelihood for the first site is found, all of the partial likelihoods need to be computed; when we move to the next site, it would be desirable to reuse some of the partial likelihoods from the previous step if possible. The partial likelihood for node n can be reused (i.e., its value is unchanged from that of the previously computed column) whenever all the leaves that are descendants of node n are identical to the corresponding leaves at the prior site. For example, in moving from site 1 to site 2 in the sample data, all the leaves are changed except for leaf 7. Thus, partial likelihoods for all internal nodes must be reevaluated. The transition from site 2 to site 3 preserves leaves 1,2,4,6, thus the values for one internal node (8)
MAXIMUM LIKELIHOOD FRAMEWORK FOR GENETIC SEQUENCE ANALYSIS..
7
can be kept from the previous step. The next three steps entail the reevaluation of partial likelihoods for all internal nodes except at node 9 for the transition from site 4 to site 5. Consequently, for the entire data set we perform 28 partial likelihood evaluations for internal nodes, a savings of two partial likelihood evaluations. It is clear from the data that sites 1 and 5 are quite similar, and the number of partial likelihood evaluations could be decreased by rearranging the sites as 1,5,2,3,6,4. Following this reordering, in going from column 1 to column 5 the partial likelihoods at only two internal nodes (11 and 12) must be recomputed, and only three (9,11 and 12) are updated upon going from column 3 to column 6. The total number of internal node computations for the entire data set is now 25. Real data sets may consist of hundreds of sites and the trees can easily grow to have tens or even hundreds of leaves. For a large data set it would clearly be quite beneficial to arrange the sites in such a way as to maximize the number of reusable partial likelihoods, if such an arrangement can be found without excess computation. 4.1. Suboptimal Column Sorting. Consider a fixed tree and a transition probability function for each branch, with the transition probabilities assumed equal across all M alignment columns (i.e., no site-to- site rate heterogeneity. Site-to-site heterogeneity [Yang, 1993] (used in models of Chapter 2), and spatial rate correlation [Feslenstein and Churchill, 1996] models compute a series of conditional likelihoods and for each such evaluation and our column ordering approach applies directly). Denote the set of characters at alignment position c as sc : 1 ≤ c ≤ M . The question of optimal ordering of the columns can now be rephrased as: find the permutation of indices c, so that the number of partial likelihood evaluations for the internal nodes is minimized. As we will show, this question is reducible to finding the shortest Hamiltonian path in a complete Euclidean graph (i.e. the Traveling Salesman Problem). C 4.1.1. A metric for state vectors. Define SN to be the set of vectors of length N with integer entries taking values between 1 and C. This set can also be thought of as the set of strings of length N over an alphabet with C characters. In the current context, N is the number of sequences in the alignment, while C is the number of alphabet characters (C = 4 for nucleotide sequences). For a given tree T with N leaves and two observed state vectors s1 and s2 from C SN , we agree to call an internal node n of the tree T tainted with respect to (s1 , s2 ) if at least one of the leaves descendant from n is different in s1 and s2 . In other words, if we consider the subtree rooted at the internal node n, the leaves in columns s1 and s2 are not identical in the subtree. The distance function dT (s1 , s2 ) is defined for any two state vectors of length N as X dT (s1 , s2 ) = number of children of n. tainted nodes n
Note that for strictly bifurcating trees dT (s1 , s2 ) = 2 × (number of tainted nodes), and for unrooted bifurcating trees, which are typical in phylogenetic analyses, when time reversible models are used - see section 5.3 for more details (4)
dT (s1 , s2 ) = 2 × (number of tainted nodes) + 1.
8
SERGEI L. KOSAKOVSKY POND
Indeed, an unrooted bifurcating tree can be viewed as a rooted tree, where all internal nodes except for the root have two children and the root has three, as in Figure 3 - thus the extra term. Intuitively, the metric is simply the number of branches in the tree for which partial likelihoods from s1 cannot be reused when evaluating the likelihood of s2 . To show that the function dT (s1 , s2 ) defines a metric on the set of state vectors C C SN , we verify that it satisfies the three metric axioms. For every s1 , s2 , s3 ∈ SN (1) dT (s1 , s2 ) = 0 ⇔ s1 = s2 - this property is obvious, (2) dT (s1 , s2 ) = dT (s2 , s1 ) - clearly true, (3) dT (s1 , s2 ) ≤ dT (s1 , s3 ) + dT (s3 , s2 ). This property follows from the fact that for any 3 state vectors s1 , s2 , s3 , the number of differences between s1 and s2 is not greater than the sum of the number of differences between s1 and s3 and s2 and s3 . Clearly, the calculation of dT (s1 , s2 ) can be accomplished by one post-order traversal of the tree and thus in time O(N ), recalling that N is the number of aligned sequences. Assuming that sites i and j differ in at least one position, one way to compute dT (si , sj ) is as follows: // Leaf labels are characters from the appropriate column of the // alignment distance := 0; treeNode := first node in post-order traversal; WHILE (treeNode is not the root) DO IF treeNode is a leaf THEN IF leaf label at site i is different from label at site j THEN mark parent of treeNode as tainted END IF ELSE IF treeNode is marked as tainted THEN distance := distance + number of children of treeNode mark parent of treeNode as tainted END IF END IF treeNode := next node in post-order traversal END WHILE distance := distance + number of children of the root
4.1.2. Reduction to a graph traversal problem. Let us return to the example of the opening section and rephrase the problem of optimal column ordering in graph theoretical terms. Construct the complete graph G (which has a graph-theoretical name: K6 ), with vertices corresponding to the columns (state vectors) in the sequence alignment and the length of the edge between two vertices si and sj given by dτ (si , sj ). The distances between vertices (columns of data) are collected in the following triangular matrix:
MAXIMUM LIKELIHOOD FRAMEWORK FOR GENETIC SEQUENCE ANALYSIS..
9
5 4 u u H � ���A �SSHH � � A S H� � H� � A H � S � H � � A � S � HH A � �� H S � H u� � Au H 6 � H � 3 �S � � AHH � � A HH � S �� � A S� H� � A � HH �� S � H A � S � HH �� u � A� Su � H 1 2 Figure 5. Graph G. dτ (s1 , s2 ) s1 s2 s3 s4 s5 s6 s1 − 11 11 9 5 11 s2 − 9 11 11 9 s3 − 11 11 7 s4 − 9 11 s5 − 11 s6 − The distances from this table can be easily related to the ‘costs‘ used in the opening example by means of Eq. (4). The task of computing the likelihood of all columns can be thought of as the task of traversing the graph G in Figure 5, visiting each vertex exactly once (i.e. traversing a Hamiltonian path). The total length of the path indicates the total number of partial likelihood calculations, and we seek to minimize it. Any permutation of column indices defines a new path in the graph in an obvious way. For example, the lengths of the trivial path s1 7→ s2 7→ s3 7→ s4 7→ s5 7→ s6 is dτ (s1 , s2 ) + dτ (s2 , s3 ) + dτ (s3 , s4 ) + dτ (s4 , s5 ) + d(s5 , s6 ) = 11 + 9 + 11 + 9 + 11 = 51. On the other hand, the path s1 7→ s5 7→ s4 7→ s3 7→ s6 7→ s2 has length 5 + 9 + 11 + 7 + 9 = 41. 4.1.3. An algorithm for finding a suboptimal Hamiltonian path. The traveling salesman problem (TSP) is solved by finding the minimal Hamiltonian cycle in the graph. TSP has a history of interest to researchers working in combinatorial optimization. Unlike other problems whose general solutions were developed in the theory of linear programming during the early 1950’s, the TSP was stubborn in its worst-case
10
SERGEI L. KOSAKOVSKY POND
5 u
4 u ��A A � A � A � A � Au3 6 u H � HH � H HH � � HH HH � H Hu � u 1(root)
2
Figure 6. A MST for the graph G. difficulty, and was thought to be fundamentally hard. This suspicion was confirmed shortly after the definition of an equivalence class of NP-hard problems known as NP-complete in the early 1970’s and the subsequent identification of the TSP as an NP-complete problem [Karp, 1972]. Fortunately, many approximating methods and techniques for ’good’ suboptimal solutions to the TSP have been identified. A well known approximation technique uses the Minimal Spanning Tree (MST) and the triangle inequality to construct a cycle which is within a factor of two to the minimal Hamiltonian cycle. The proof of this assertion can be found in many graph theory books. An accessible presentation may be found, for instance, in [Gibbons, 1985]. 4.1.4. Algorithm for constructing a suboptimal Hamiltonian path. The algorithm proceeds in two stages: (1) Find a MST M of the graph G. (e.g using Prim’s algorithm; see below) (2) Conduct a pre-order traversal of M, outputting the vertices of the tree in the order they were traversed. The resulting ordering of vertices is the desired suboptimal path. 4.1.5. Algorithm for constructing a MST. Prim’s algorithm for constructing the MST is described in detail in [Gibbons, 1985]. The outline of the algorithm is as follows: (1) Choose the longest edge (breaking ties arbitrarily) in G and add both of its vertices to the set V . (2) Repeat the following three steps until all vertices of the graph are in V : (a) Choose the shortest edge e between a vertex in the set V and a vertex not in V (again, breaking ties arbitrarily). (b) Add the edge e to the MST (c) Add the vertex upon which e is incident to V . Prim’s algorithm has running time O(M 2 ), where M = |G| = number of columns in the data. There are several alternative algorithms for constructing a MST, however none of them offer a speed advantage over Prim’s algorithm when applied to
MAXIMUM LIKELIHOOD FRAMEWORK FOR GENETIC SEQUENCE ANALYSIS..
11
a complete graph [Cheriton and Tarjan, 1972]. Note that there is a well known approximate algorithm for solving TSP on graphs whose edge lengths the triangle inequality [Christofides, 1976] which gets within a factor of 32 of the optimal solution, and it can be used instead of the above heuristic. However, the overhead required of that method is O(M 3 ) and is prohibitive for data sets with many sequences. An application of Prim’s algorithm to the graph G in Figure 2 starting with vertex 1 yields the MST pictured in Figure 3. The suboptimal path constructed by using this tree is 1 7→ 5 7→ 4 7→ 3 7→ 6 7→ 2 of total length 41, a computational reduction of approximately 20% from the unsorted data value of 51. For this simple example, it can be shown by exhaustive search that this path is actually an optimal one. 4.1.6. The modified pruning algorithm. In order to make use of the column sorting process, a few slight modifications must be made to the pruning algorithm. First of all, all partial likelihoods of internal nodes must be stored between the evaluations of two successive columns. This requirement isn’t too stringent, since the pruning algorithm itself almost requires it. While it is possible to store only a fixed number of partial likelihoods for an evaluation at a given column (that number will depend on the maximal number of children at any given node, but not on the size of the tree), the memory requirement for storing conditional likelihoods is dwarfed by the amount of space needed to store transition matrices at each node. Additionally, each internal node must be equipped with a boolean flag, indicating whether the transition from one site to the next in the data set has tainted the node. There is a minimal amount of bookkeeping involved, and its cost is negligible relative to the cost of likelihood evaluation. The following pseudocode fragment illustrates the logic of the modifications that must be made to accommodate column sorting. The use of column aliasing is assumed, so the set of columns to be sorted consists only of one copy of each column type found in the data. // Assume that the columns have already been sorted // Leaf labels are characters from the appropriate column of the // alignment Use the standard pruning algorithm to compute all partial likelihoods for column i=1. FOR i:=2 to (number of columns) DO treeNode := first node in post-order traversal WHILE (treeNode is not the root) DO IF treeNode is a leaf THEN IF label at site i is different from label at site i-1 THEN relabel treeNode with the appropriate sequence character mark parent of treeNode as tainted END IF ELSE IF treeNode is marked tainted THEN compute the vector of partial likelihoods at treeNode
12
SERGEI L. KOSAKOVSKY POND
mark parent of treeNode tainted unmark treeNode END IF END IF treeNode := next node in post-order traversal END WHILE compute tree likelihood by weighting partial likelihoods at the root by equilibrium frequencies update likelihood for the entire data set END FOR
4.1.7. Time and memory requirements. In order to take advantage of the suboptimal column ordering it is necessary to obtain a heuristic solution to the TSP determined by the data and the tree being analyzed. Typical likelihood-based analyses involving phylogenetic trees require iterative optimization of the likelihood function and entail repeated evaluation of the likelihood for different model parameters, but leave the tree and the data unchanged. Thus, one suboptimal column ordering may be used to trim off computational costs in hundreds or even thousands likelihood function evaluations. The heuristic algorithm given above has computational complexity of O(N |G|2 ), where |G| is the number of vertices in the graph G (i.e., the number of distinct column types in the data) and N is the number of leaves in the tree. The factor N appears since each distance computation entails comparing values at each leaf of the tree, and if necessary, traversing the tree upwards from a leaf to the root. Storage requirements for the column sorting are of order O(|G|2 ), and the modified pruning algorithm only requires an extra boolean flag per in each internal node, and thus is O(N ). 4.1.8. Further time saving heuristics. A substantial portion of time in execution of the pruning algorithm is spent traversing the tree, and further time savings can be realized by trimming the number of nodes that must be traversed for each site. This is especially noticeable for bifurcating trees on nucleotide data, where each partial likelihood evaluation requires at most 15 floating point operations (23 at the root, if the tree was unrooted), but since the reduction in traversal time offered below takes very little effort and overhead, it is worthwhile to implement for all molecular data types. Consider our example data set with the columns ordered as s1 7→ s5 7→ s4 7→ s3 7→ s6 7→ s2 . Moving from site 1 to site 5, only the last leaf changes, so the traversal of the tree in the pruning algorithm can be started at that last leaf (because everything else in the tree is unchanged). Thus instead of spending time traversing all seven leaves and five internal nodes, we only need traverse leaf 7 and internal nodes 11 and 12, i.e. only 1/4 of the tree. The following simple heuristic takes advantage of the above observation. We precompute two vectors, Left and Right, of length M −1 where M is the number of columns in the data. The entries in the vectors are defined as follows: Left(i) is the first character in columns i and i + 1 where the columns differ when scanning from the left; Right(i) is the index of the first character that differs when scanning from the right. For instance, for columns s6 = (AGAGAGA), s2 = (AGGGGAG)
MAXIMUM LIKELIHOOD FRAMEWORK FOR GENETIC SEQUENCE ANALYSIS..
13
in our example data set (indexed 5 and 6, respectively, after column sorting), Left(5)=3, Right(5)=7. If the order of the columns is fixed, then computing vectors Left and Right is simply a matter of character comparison and can clearly be done in O(N M ) time (recall that N is number of sequences, i.e. the number of characters in each column, and this calculation only has to be done once per data set. It is clear that the pass of the pruning algorithm for column i + 1 only needs to look at the leaves between Left(i) and Right(i) and the internal nodes whose descendants include one of those leaves. Implementing this reduction is a matter of few simple modifications to the pruning algorithm described in section 2.4: \\ Change the body of the FOR loop as follows: treeNode := Leaf indexed by [Left(i-1)] WHILE (treeNode is not the root AND treeNode is not equal to Leaf indexed by [Right (i-1)+1] ) DO IF treeNode is a leaf THEN IF leaf label at site i is different from label at site i-1 THEN relabel treeNode with the appropriate sequence character mark parent of treeNode as tainted END IF ELSE IF treeNode is marked tainted THEN compute the vector of partial likelihoods at treeNode mark parent of treeNode tainted unmark treeNode END IF END IF lastNode = treeNode treeNode := next node in post-order traversal END WHILE lastNode = parent of lastNode IF lastNode is marked as tainted THEN unmark lastNode END IF WHILE (lastNode is not the root) DO compute the vector of partial likelihoods at lastNode lastNode = parent of lastNode END WHILE compute tree likelihood by weighing partial likelihoods at the root by equilibrium frequencies update likelihood for the entire data set Note that this heuristic doesn’t require that the columns be ordered in any particular way, but the ordering method of this chapter boosts the efficiency of tree traversals quite a bit. Refer to Table 3 for examples. 4.2. Results.
14
SERGEI L. KOSAKOVSKY POND
Type(N)
Sites
Seqs.
Time
Ref.
Improved
Speedup
BEP
Nuc(4) Nuc(4) Nuc(4) Nuc(4) Aa(20) Aa(20) Cod(60) Cod(61)
725 906 483 1264 155 98 1716 513
15 50 349 500 37 6 7 23
.35 1.75 6.4 77.15 0.05 < 0.01 2.35 0.67
293 85 12.5 3.3 42.1 331 3.5 2.55
423 160 64 8.1 72.9 363 4.59 3.9
1.44 1.88 5.12 2.46 1.73 1.097 1.31 1.53
3.80 1.53 0.12 0.26 0.03 0.37 0.75 0.04
Table 1. Effects of column sorting on computational speed.
4.2.1. Speed gains. We have tested the modified pruning algorithm on nucleotide, amino-acid, and codon data sets of various dimensions. You may download the files used for testing from: http://peppercat.stat.ncsu.edu/~hyphy/pubs/cs/data.tar.gz Table 1 includes the following information: Type. Type of the data, i.e. nucleotide, amino acid, or codon. This determines C (the number of character states): 4 for nucleotides, 20 for amino acids and 61 or 60 for codons (universal or mammalian mitochondrial genetic code). Sites. The number of distinct data columns (sites) in the data, i.e. the number of vertices in the graph G. Note that in real data this value is a function of the sequence length and the rates of evolution in different lineages. Seqs. The number N of sequences in the data file, which is the same as the number of leaves in the phylogenetic tree. Time. How long did it take to carry out column ordering (in seconds). Ref. Number of likelihood evaluations per second, not using the pseudo-optimal ordering, but using the tree traversal heuristic. Calculations were done on a PowerMac G4/533 using HY-PHY version .95beta for MacOS X. Likelihood calculations also involve computing transition probabilities, and thus reflect a real-world speed gain from column ordering. Improved. Number of likelihood evaluations per second using the pseudo-optimal ordering and the tree traversal heuristic. Speedup. The ratio between improved and reference speeds. BEP. Break-even point. The number of likelihood evaluations per branch required to recover the overhead of performing the pseudo-optimal ordering. For example, the first entry requires 0.35 seconds to perform the column ordering. In that same 0.35 seconds, 0.35 × 293 likelihood evaluations could be performed. In order to allow comparison over trees with different numbers of taxa, we scale by the number of branches. BEP = 0.35 × 293/27 = 3.80. There are two important observations in Table 1. First, the time reduction brought about by column sorting ranges from a minimum of near 10% to a maximum of over 80%, reflecting a five-fold improvement in speed. Trees with many sequences seem to benefit the most from the sorting procedure. Second, it is almost always worthwhile to sort the columns. Consider finding maximum likelihood estimates of the model parameters for a given tree/dataset combination. If a branch-bybranch optimization approach is used, at least one (and most likely many) likelihood evaluation per branch must be performed. In most cases, less than one evaluation per branch is needed to justify the time cost of sorting, and the worst case among
MAXIMUM LIKELIHOOD FRAMEWORK FOR GENETIC SEQUENCE ANALYSIS..
Dataset
Natural
Sorted
FC
TLB
1 2 3 4 5 6 7 8
4.23 5.84 13.12 6.50 4.77 1.94 2.82 2.92
2.52 3.00 2.56 2.82 2.40 1.41 1.61 1.71
1.29 1.33 1.26 1.22 1.62 1.28 1.22 1.30
1.00 1.00 1.00 1.00 1.00 1.00 1.00 1.00
15
Table 2. Quality of Improvement.
these datasets is only four evaluations per branch. Since this overhead is a one-time cost, column sorting can be recommended as a general implementation practice. 4.2.2. Quality of approximation. An ideal algorithm for likelihood calculations would reuse already computed partial likelihoods whenever possible, leading to no recalculations at all. The algorithm outlined in this chapter only reuses partial likelihoods from the single previous step, and relies on an approximate solution to the TSP to sort columns. One can easily imagine modifying the sorting algorithm to store the past two sites, for instance, or even to store the partial likelihoods for all previous sites. However, such modifications would require additional memory and bookkeeping. It is desirable, though, to explore how much of the available savings our current method is able to exploit. In Table 2 we examine how well this approach compares with two possible algorithmic improvements. Theoretical Lower Bound. [Larget and Simon, 1998] offer an alternative algorithm for reducing the cost of likelihood evaluations that achieves the theoretical lower bound (TLB). Their software package [Simon and Larget, 2001] implements this method in practice. This is the absolute minimum number of partial likelihood evaluations needed for a particular data set and tree. It is calculated predicated on the availability of every unique partial likelihood at any given time. Unfortunately, this method has a very large memory footprint (especially for amino acid and codon data), and requires extensive modifications to the pruning algorithm. While the amount of available memory of modern computers makes large memory requirements less of a concern, modern system architectures suffer a significant performance hit, when frequent memory accesses outside the fast cache memory are needed. Furthermore, as Table 2 shows, even discounting computational overhead involved in [Larget and Simon, 1998], column sorting achieves a factor of about 2 of the TLB with minimal overhead. Pseudo-optimal ordering with full caching (FC). A second approach for computational reduction would be to sort the columns optimally, and then save every partial likelihood computed, rather than caching only those for the previous column. While offering additional savings in likelihood calculations, this method will also require substantial additional memory and incur significant overhead for accessing and retrieving cached likelihoods. The entries in Table 2 indicate the relative amount of computation required by each of several improvement methods. For each of the eight data sets, the time for the Theoretical Lower Bound, TLB is defined to be one. The values for each
16
SERGEI L. KOSAKOVSKY POND
Dataset 1 2 3 4 5 6 7 8
Traversal Cost Reduction % Natural Sorted 7.60 23.82 8.46 28.92 8.47 35.45 4.19 13.64 3.88 35.48 2.27 40.14 1.26 43.37 0.65 33.14
Speedup 1.04 1.07 1.08 Negligible 1.05 1.06 Negligible Negligible
Table 3. Tree traversal cost reduction.
of the other methods reflect the amount of time needed to evaluate the likelihood function, relative to the TLB for that rows dataset. Natural shows the value for unsorted columns, Sorted - for columns sorted using the method outlined in this chapter and FC - for full caching, i.e. when columns are first sorted using the algorithm in this chapter, but all partial likelihoods are cached, rather than just those of the prior column. The values in Table 2 represent the cost of likelihood evaluations in terms of the metric of this chapter relative to the TLB (defined to be 1.0). It is clear that both alternative algorithms offer improved calculation times, but the improvement tends to be relatively small. In time-critical settings, the additional memory and programming complexity of these algorithms may be justified, but it is pleasing to see that the simple one-step column sorting method captures much of the available savings. 4.2.3. Tree Traversal Savings Heuristic. Table 3 shows by how much the heuristic of section 2.6. reduces the number of nodes traversed by the pruning algorithm for each tree likelihood evaluation. Traversal cost reduction shows what proportion of nodes will not be traversed at all. Both the cases of unsorted and sorted (by this chapter’s algorithm) columns are considered. The simple heuristic saves a startling amount of time, but only when used in conjunction with column sorting. Similar savings would be expected if the heuristic was used in conjunction with either the TLB or FC algorithms. Like column sorting, the use of the heuristic requires little overhead and only minor changes to the pruning algorithm, so it is recommended for typical likelihood implementations. The entries in Table 3 show relative reduction in the number of branches traversed when using the tree traversal heuristic to compute likelihoods of all data columns. Natural and Sorted refer to the ordering of data columns. Speedup reflects relative improvement of likelihood evaluations per second, when the tree traversal heuristic is applied to sorted data columns. 5. Markov models of substitution. In the previous section we have discussed construction and efficient evaluation of likelihood functions in the context of evolutionary sequence analysis. Our next goal is to model character substitution processes along branches in a phylogenetic tree.
MAXIMUM LIKELIHOOD FRAMEWORK FOR GENETIC SEQUENCE ANALYSIS..
17
Substitution operates in continuous time, which could be either geological time or some other uniform (across the entire tree) measure of time; and over a discrete of characters. To complete the definition of our evolutionary model, we must specify transition probability functions Qb x,y (tb ; θ) defined by Eq. (1) for every branch b (with length tb ) in the tree T . For brevity, we will no longer explicitly mention dependance on the parameter vector θ in the following discussion. There are several assumptions we are going to make explicit about the structure of the transition probability functions. (1) Substitution processes operate independently from branch to branch. In principle, a transition probability function of a branch could depend on the entire evolutionary history from the ultimate ancestor, but use of such models would render likelihood evaluations unfeasibly complex. While the independence assumption is almost certainly violated in population level data, when demographics and non-random mating should be taken into account, on a larger evolutionary scale, when the data comes from different species, separated by relatively lengthy time intervals, the assumption of independence is not unreasonable. Moreover, evolutionary processes are Markov, i.e. memoryless along each branch as well. (2) Along a fixed branch, the substitution process is time homogeneous. This property was implicitly used in Eq. (1). The most general transition probability function would specify, for every t > 0 and s ≥ 0 the probability Qij (t; s) = P r{state i at time s → state j at time s + t}. For a time-homogeneous process the transition probability does not depend on the starting point, thus Qij (t; s) = Qij (t; 0) ∀ t ≥ 0, s ≥ 0, i, j ∈ C. Biologically, this assumption states that during the lifespan of a given branch (species), the underlying evolutionary process doesnt change with time. There are models [Thorne et al, 1998] which relax this assumption at a great computational cost, but even in the present setting, it is possible to model some changing evolutionary conditions, by splitting a branch into several shorter ones, each equipped with its own, time-homogeneous model. This approach would enable us to investigate discrete changes in the evolutionary process, due to events such as migration, rapid environmental change etc. (3) All branch processes share the same equilibrium distributions and are stationary. Every finite state irreducible Markov process has a unique equilibrium distribution, i.e. a probability vector {π(k)}, 1 . . . k ∈ C, with the property that, for every t ≥ 0, the following matrix identity holds π{Qij (t)} = π. In other words, if we draw states randomly according to its relative weights in π, and then run the process for time t, then the resulting distribution of states is also going to be π. Biologically, the proportions of characters in the gene pool remain constant over time. It is certainly possible to relax this assumption, for instance, by allowing substitution processes along branches to have their own equilibrium frequencies. However then
18
SERGEI L. KOSAKOVSKY POND
the model will imply an instantaneous change is character frequencies at an internal node, which is not biologically reasonable, since any change in those frequencies would be gradual, due to accumulation of substitutions. (4) Sometimes we will also assume that substitution processes are time reversible. A time reversible process (in equilibrium) has the property that for every t > 0 and i, j ∈ C, P r0 {j → i in time t} = P r{j → i in time t}, where we use P r0 to refer to the transition probability back in time. We will discuss the implications of this assumption later on. A discrete state, continuous time Markov process is defined by its rate matrix: (5)
R(s) = lim t↓0
Q(t; s) − I , t
where Q(t; s) is the transition probability function, and I is the identify matrix. Since Q(t; s) is a transition probability function, for all times, entries of every row of the matrix Q should sum to 1. Therefore every row of the rate matrix R should sum to 0. To check that, observe if d = {1, . . . , 1}, then for every s, t (Q(t; s) − I)dT = 0, thus R(s)dT = 0. and hence, the rows of the rate matrix R each sum to 0. It is customary to define X Rii (s) = − Rik (s), ∀i, k6=i
and denote diagonal entries of the rate matrix by ?. Let d ∈ R|C| be a distribution vector over the state space C. Its evolution in time, under the Markov process is the solution to the system of ordinary differential equations ˙ = R(t)d(t), d(t) subject to the appropriate initial conditions d = d0 . This relation easily follows from Eq. (5). Indeed, ˙ = lim d(t + h) − d(t) = lim (Q(h; t) − I)d(t) = R(t)d(t). d(t) h↓0 h↓0 h h For a time homogeneous process, the rate matrix does not depend on time, and the solution to the system of ODEs is given by d(t) = eRt d0 . Therefore, the transition probability function for a time-homogeneous discrete state continuous time Markov process is a matrix exponential of its rate matrix, which can be computed as ∞ X R k tk Rt Q(t) = e = . k! k=0
There are a multitude of algorithms for numerical evaluation of matrix exponentials [Moler and Van Loan, 1978], and using a series representation proves to be an
MAXIMUM LIKELIHOOD FRAMEWORK FOR GENETIC SEQUENCE ANALYSIS..
19
efficient method, especially for sparse rate matrices, when sparsity can be utilized for faster matrix multiplications. The algorithm for numerical matrix exponentiation actually employed by the author first scales the matrix by 1/K, where K = 2−k , and k is chosen so that the largest modulus among the entries of the matrix is sufficiently small, then uses the series representation to evaluate exp(tR/K) with a small number of terms (usually less than 10), and finally employs the elementary identity exp(tR) = [exp(tR/K)]K to recover the desired exponential of tR by k repeated squarings of exp(tR/K). 5.1. Evolutionary distances. The ultimate objective of a maximum likelihood based analysis is to obtain estimates of branch length and substitution model parameters and interpret their values. The structure of the transition probability function in Eq. (5), implies that the likelihood function will depend on the products of functions of model parameters, and branch lengths tb . For example, consider the rate matrix for the nucleotide substitution model of [Hasegawa et al, 1985], commonly denoted as HKY85 ? απC βπG απT απA ? απG βπT , C = {A, C, G, T }, βπA απC ? απT απA βπC απG ? with (πA , πC , πG , πT ) referring to the equilibrium distribution vector. ‘?‘ is defined as the negative of the sum of all off-diagonal entries in the row. It has two substitution rates, for transitions - β - and transversions - α. Adenine and guanine are purines, while cytosine and thymine are pyrimidines. Transitions are substitutions of chemically similar nucleotides, while transversions are substitutions for a chemically different base, intuitively a less frequent event. It is clear that the transition probability function of the HKY85 model will depend on the products of αt and βt, and thus it is impossible to estimate evolutionary time and substitution rates separately, but rather only as products. Of course, if additional information, such as fossil records, is available, then it may be possible to resolve the time scale explicitly. Therefore, distances along a branch in a phylogenetic tree are best thought of not as physical time, but rather as evolutionary time. Two branches of similar lengths could represent rapid evolution over a short period of time, or slow change over extended periods of time. A commonly used measure of evolutionary distances is the expected number of substitutions per site per unit time, defined as: k=|C|
(6)
−
X
π(k)Rkk ,
k=1
which is simply the average rate of replacing a character with a different one. 5.2. Trivial lineages. Consider a phylogenetic tree which has an internal branch with a single child. Biologically, it represents a case when an evolutionary process changes (due to an environmental shift, migration, new species interaction, etc) but no speciation event occurs - see Figure 7.
20
SERGEI L. KOSAKOVSKY POND
D
D tA+tB
B tB
A tA
A
C
C
Figure 7. Tree with a trivial lineage. If the substitution processes on branches A and B are the same, then the trivial lineage D → B → A will collapse to a single branch as in the simplified tree on the right in Figure 7. Since the Markov process along both A and B is timehomogeneous, the Chapman-Kolmogorov equation ([Papoulis, 1984], p.531). X Qij (t + s) = Qik (t)Qkj (s), ∀t, s ≥ 0, k∈C
applies. Indeed, consider computing partial likelihoods for the internal node associated with the branch D, where A and C could either be leaves, or subtrees: X X Li (D) = QC QB i,j (tC )Lj (C) i,j (tB )Lj (B). j∈C
j∈C
But, Lj (B) =
X
QA j,k (tA )Lk (A),
k∈C
and hence Li (D) =
X
X X A QC QB i,j (tC )Lj (C) i,j (tB )Qj,k (tA ) Lk (A).
j∈C A
k∈C
j∈C
B
If Q = Q , then the Chapman-Kolmogorov equation applied to the expression in the brackets, simplifies the partial likelihood to: X X Li (D) = QC QA i,j (tC )Lj (C) i,j (tA + tB )Lk (A), j∈C
j∈C
which is precisely the expression for the simplified tree with the trivial internal node collapsed. If Markov processes along every branch in the tree are the same, it suffices to consider only evolutionary trees without trivial lineages. However, in a more general case, when each branch can possibly have its own evolutionary process, different from neighboring branches, internal branches with a single child must be kept.
MAXIMUM LIKELIHOOD FRAMEWORK FOR GENETIC SEQUENCE ANALYSIS..
21
5.3. Reversibility and unrooted trees. When maximum likelihood frameworkwas first introduced in [Felsenstein, 1981], each additional branch in the phylogenetic tree caused a significant strain on computing equipment of the day. As we will show next, assuming that all substitution processes operating along tree branches are reversible, allows one to collapse one branch in the tree - Felsenstein called this the ‘Pulley Principle‘. While modern computing equipment no longer requires this simplification, it remains in place for historical reasons, and because non-reversible models, while more parameter rich, often do not offer a significantly better fit than reversible models do. For a Markov process to be reversible, it must be stationary, i.e. be in an equilibrium distribution of states, and the following identity about transition rates must hold: P r0 {j → i backwards in time t} = P r{j → i in time t} However, it suffices that the following condition be satisfied, π(i)Rij = π(j)Rji , i, j ∈ C. Indeed, by Bayes’ rule: P r0 {j → i backwards in time t} =
P r{j → i in time t}π(i) = P r{j → i in time t}. π(j)
It follows that a similar identity holds for the transition probabilities, as well: π(i)Qij (t) = π(j)Qji (t), i, j ∈ C, t ≥ 0 Consider the tree in Figure 8, where A, B and C can be either leaves or subtrees. Also assume that the processes along branches D and C have the same transition probability functions. The likelihood of the the data column Ds given tree T is: X L(Ds ; T , θ) = π(i)Li (r) i∈C
=
X
=
XX X
π(i)
i∈C
X
QD i,j (tD )Lj (D)
j∈C
X
QC i,k (tC )Lk (C)
k∈C
! j∈C k∈C
D π(i)QC i,k (tC )Qi,j (tD ) Lj (D)Lk (C)
i∈C
By reversibility: C π(i)QC i,k (t) = π(k)Qk,i (t),
and hence, using Champan-Kolmogorov equation and the assumption QC = QD : X X D D C π(i)QC QC i,k (tC )Qi,j (tD ) = π(k) k,i (tC )Qi,j (tD ) = π(k)Qk,j (tC + tD ) i∈C
i∈C
Therefore: L(Ds ; T , θ) =
X k∈C
π(k)Lk (C)
X
QC k,j (tC + tD )Lj (D)
j∈C
This expression is exactly the likelihood of the ‘unrooted‘ tree in Figure 8. If we treat node C as the root, and add D to the the list of children of C, then the equivalence of both trees follows from our definition of the likelihood function, and the unrooted tree has one less branch, as promised.
22
SERGEI L. KOSAKOVSKY POND
Figure 8. A tree and its unrooted equivalent. Note that our argument allows us to place the root at any branch of the tree, splitting it into two arbitrary parts. This conclusion is rather intuitive: reversible models don’t provide the sense of the origin of time, because the past and the future are interchangeable. 5.4. A note on multinomial distributions. Any model of the type described in the previous sections will be a particular case of the multinomial model on data column types. Indeed, for N sequences there will be |C|N possible column types, if we ignore ambiguities in the data for the moment. The probability of observing a particular kind of column with our Markov models will be a function solely of observed data, given model parameter values. Moreover, the likelihoods of column types ct form a probability distribution on C N . The sum of likelihoods of all possible column types as defined in section 1 is always equal to 1 for any phylogenetic tree and transition probabilities. As an illustration, consider the tree in Figure 2, whose likelihood is shown in Eq. (2). If we sum over all possible |C|5 column types, using wi to denote the label of leaf i, we obtain the following expression: X X X X X
L (Ds ; T , θ) =
w1 ∈C w2 ∈C w3 ∈C w4 ∈C w5 ∈C
X X X X
X X X X X w1 ∈C w2 ∈C w3 ∈C w4 ∈C w5 ∈C
π(c9 )Q1c9 ,w1 (t1 ; θ)Q8c9 ,c8 (t8 ; θ)Q2c8 ,w2 (t2 ; θ)
×
c9 ∈C c8 ∈C c7 ∈C c6 ∈C
Q7c8 ,c7 (t7 ; θ)Q3c7 ,w3 (t3 ; θ)Q6c7 ,c6 (t6 ; θ)Q4c6 ,w4 (t4 ; θ)Q5c6 ,w5 (t5 ; θ) Rearranging the order of summations to sum over the leaves first we arrive at: X X X X X X π(c9 ) Q1c9 ,w1 (t1 ; θ)Q8c9 ,c8 (t8 ; θ) Q2c8 ,w2 (t2 ; θ) × c9 ∈C c8 ∈C c7 ∈C c6 ∈C
w1 ∈C
Q7c8 ,c7 (t7 ; θ)Q6c7 ,c6 (t6 ; θ)
X
w2 ∈C
Q3c7 ,w3 (t3 ; θ)
w3 ∈C
X
Q4c6 ,w4 (t4 ; θ)
w4 ∈C
Because Q5 is a transition probability function X Q5c6 ,w5 (t5 ; θ) = 1. w5 ∈C
X w5 ∈C
Q5c6 ,w5 (t5 ; θ)
MAXIMUM LIKELIHOOD FRAMEWORK FOR GENETIC SEQUENCE ANALYSIS..
23
Just like the innermost sum, all other sums collapse to 1, right to left, until all that remains is: X π(c9 ), c9 ∈C
which also evaluates to 1, because π is a probability distribution. Therefore, we can define the multinomial distribution generated by our evolutionary model as: P r{x = w} = L(w; T , θ), w ∈ C N . Therefore, for data without ambiguities, the upper bound on the likelihood function for any data set is given by the likelihood assigned to the same data set by the multinomial distribution with the maximum likelihood parameter values estimated by observed proportions of data column types. 5.5. Non-deterministic model parameters. As the models of the next chapter will illustrate, it is often beneficial to let some model parameters be random quantities, to account for variation in some evolutionary properties among alignment sites. We partition the vector of parameters θ into a deterministic θd and random θr , components, where θr drawn from the distribution function F (x, η) (η is the vector of distribution parameters), then the log likelihood of an alignment site is given by: Z L(Ds ; T , θd , η) = Eθr [L(Ds ; T , θd , η, θr )] = L(Ds ; T , θd , η|θr = x)F (dµ(x), η), with conditional likelihoods evaluated as described in section 1. µ is either the Lebesgue measure, for continuous distribution, or the counting measure for the discrete densities, i.e. for discrete random variables the expectation integral becomes a sum. 6. Hypothesis testing. One of the major advantages to using maximum likelihood frameworkfor sequence analysis is the ability to rigorously test statistical hypotheses. Hypotheses fall into two different classes: nested and non-nested. Two hypotheses are nested if the parameter space for the models used in the null hypothesis H0 is a subset of the parameter space for the models in the alternative hypothesis HA . Most commonly, the null hypothesis can be obtained by imposing a finite set of constraints on the model parameters in the alternative hypothesis, i.e. θ0 = g(θA ), where g is the constraint function. g reduces the n-dimensional space of alternative model parameters to an n − d dimensional space. Clearly, a more general model will yield a larger maximum likelihood value, and as it turns out the convenient quantity to characterize the significance in the likelihood score improvement is the likelihood ratio test statistic defined as: LRT = 2(log LHA − log LH0 ) If the likelihood function is sufficiently nice, i.e. has continuous second derivatives with finite means, maximum likelihood estimates of model parameters are consistent, and the constraints imposed by g do not lie on the boundary of the parameter space, then, under H0 , the LRT is distributed as χ2 with d degrees of
24
SERGEI L. KOSAKOVSKY POND
freedom when the sample size is large (see, for instance, [Schervish, 1997], pp. 459461). We can use this result to assess the probability that, given H0 , a random LRT value is greater than the observed value X: P rH0 {LRT ≥ X} = 1 − P r{χ2d < X} This probability is referred to as the p-value . A small p-value indicates that it is unlikely to have observed a LRT value as large or larger than X, and therefore H0 should be rejected in favor of HA . Another method to assess a likelihood score improvement, applicable even in the case of non-nested models, is the Akaike Information Criterion (AIC) [Akaike, 1974]. AIC rewards a model for good fit, but penalizes it for each additional independently adjusted parameter: AIC = −2(log L − # of estimated model parameters). A model with the lowest AIC score should be accepted. The logic behind using an information criterion is quite instructive. Let Y denote a random quantity whose true distribution is described by the density g(y) (in the discrete case, the density is understood as the Radon-Nykodim derivative of the distribution function with respect to the counting measure). Let f (y; θ) represent a parametric family of densities used to model the quantity Y . In many practical cases, the family f does not contain the true density g. There are many possible ways to measure how well f (y; θ) approximates g(y), and we shall use the Kullback-Leibler information defined by � � g(Y ) . IKL (f (·; θ); g) = EY log f (Y ; θ) It can be shown [Schervish, 1997] that IKL (f (·; θ); g) ≥ 0 and the equality is attained if and only if f (y; θ) = g(y) almost surely. Assuming the existence of all necessary expectations, we write: IKL (f (·; θ); g) = EY [log g(Y )] − EY [log f (Y ; θ)] . When comparing among different models, we wish to minimize the KullbackLiebler information. However it is often impossible obtain the first term of the above expression, because the true distribution is unknown. However, to compare two proposed parametric families f and h, we can utilize the difference in their respective KL information, which does not include the term with the unknown ‘true‘ distribution. For any fixed θ, by the law of large numbers: N 1 X log[f (Yi ; θ)] →a.s. EY [log f (Y ; θ)] , N i=1
if Yi are independent and identically distributed. However, if we use maximum likelihood to first estimate the parameters of the distribution θˆ and then use those to approximate the KL information, a bias is introduced (i.e. we overestimate the information term). It can be shown [Akaike, 1974], that under certain regularity conditions, the bias thus introduced amounts to: " # N X 1 ˆ g) − ˆ = k, E IKL (f (·; θ); log[f (Yi ; θ] N i=1 N where k is the number of independently adjusted parameter in θ.
MAXIMUM LIKELIHOOD FRAMEWORK FOR GENETIC SEQUENCE ANALYSIS..
25
If all else fails, one can always resort to bootstrap to generate empirical distributions of a test statistic and use those to accept or reject hypotheses. 7. Bootstrap. In order to assess statistical significance of a test it is often necessary to know the (approximate) distribution of a test statistic, most commonly - the likelihood ratio test statistic. Except for the asymptotic χ2 large sample distribution for nested hypotheses, the LRT distribution can not be obtained analytically. It is therefore common to utilize the general bootstrap procedure described by [Efron, 1979], adapted for phylogenetic setting in [Goldman, 1993]. One uses either parametric or non-parametric resampling procedures to generate i.i.d. samples of sequence data, and tabulates the distribution of the test statistic using those samples. We will now briefly describe the bootstrap procedures. 7.1. Non-parametric bootstrap. Given a data set of N sequences of length M , we use sampling with replacement to generate new data sets. Clearly, nonparametric is a misnomer, because the distribution that new sites are being sampled from is simply the multinomial distribution discussed in 5.4. Indeed, the probability of drawing a site Ds is the observed proportion of this type of sites in the original data set. The issue with non-parametric bootstrap in this setting is that unless the number of sequences M is quite large, an overwhelming majority of possible column types Ds do not appear in simulated data sets, because they are not present in the original sample. In other words, we are utilizing the multinomial distribution with |C|N − 1 parameters estimated with only M � |C|N − 1 observations, and the quality of such approximation is dubious. 7.2. Parametric bootstrap. With parametric bootstrap [Efron, 1979], the distribution function used to generate sites in simulated data sets is the one obtained from the Markov evolutionary models described earlier in this chapter. The algorithm for simulating a data set parametrically, using only a uniform on [0, 1] random number generator, proceeds as follows. (1) Repeat steps 2-5 M times (for each column in the alignment) (2) If some of the model parameters are random, we sample values for each such parameter from its distribution, using the probability transform F −1 (y), y ∼ U (0, 1), where F is the cumulative distribution function for the random parameter - to generate values from the appropriate distributions. (3) Draw a character state cr ∈ C at the root of the tree T from the equilibrium distribution π, by taking a random number z ∼ U (0, 1) and setting cr = i-th Pi element of C, where i is the smallest positive integer such that k=1 π(k) ≥ z. (4) For each internal node n, starting with the root and proceeding down the tree, and each branch b emanating from n determine the character at the end of branch b thus: (a) Draw a random number y ∼ U (0, 1). (b) Since the state at node n (denoted by cn ) is known, we use the probˆ (hats mean that we ˆ n (tˆn , θ) ability transition function at node n, Q evaluate transition probabilities using maximum likelihood estimates for parameter values) to set the character at the end of branch n to
26
SERGEI L. KOSAKOVSKY POND
the i-th element of C, where i is the smallest positive integer such that Pi ˆn ˆ ˆ k=1 Qcn ,k (tn , θ) ≥ y. (5) Simulated alignment column can now be constructed by reading off the values at tree leaves. The main issue with parametric bootstrap arises when the evolutionary model is poorly chosen, in which case resampled data may yield misleading statistical properties, because they don’t characterize true evolutionary properties well. References [Akaike, 1974] Akaike H. 1974. A new look at the statistical model identification. A IEEE Trans Autom Contr 119:716-723. [Cheriton and Tarjan, 1972] Cheriton, D. & Tarjan, R.E. 1972. Finding minimum spanningtrees. SIAM J. on Comput., 19(4), 724-42. [Christofides, 1976] Christofides, N. Worst-case analysis of a new heuristic for the traveling salesman problem. Technical report, GSIA, Carnegie-Mellon University, Pittsburgh, PA, 1976. [Efron, 1979] Efron, B. 1979. Bootstrap methods: Another look at the jackknife. Ann. Stat. 7:1-26. [Felsenstein, 1981] Felsenstein, J. 1981. Evolutionary trees from DNA sequences: a maximum likelihood approach. J. Mol. Evol., 17:368-376. [Felsenstein et al, 1986] Felsenstein, J. at al 1986. The Newick tree format. http://evolution.genetics.washington.edu/phylip/newicktree.html [Felsenstein, 1993] Felsenstein, J. PHYLIP: Phylogeny inference package. Version 3.52c. University of Washington, Seattle, Washington, 1993. http://evolution.genetics.washington.edu/phylip.html [Feslenstein and Churchill, 1996] Felsenstein, J., Churchill, G.A. 1996. A Hidden Markov Model Approach to Variation Among Sites in Rate of Evolution. Mol. Biol. Evol. 13(1):93104. [Gibbons, 1985] Gibbons, A. Algorithmic Graph Theory. Cambridge University Press (1985) [Goldman, 1993] Goldman, N. 1993. Statistical tests of models of DNA substitution. J. Mol. Evol., 36:182-198. [Goldman and Yang, 1994] Goldman, N., and Z. Yang. 1994. A codon-based model of nucleotide substitution for protein-coding DNA sequences. Molecular Biology and Evolution 11:725-736. [Hasegawa et al, 1985] Hasegawa, M., Kishino, H. and Yano, T. 1985. Dating of the humanape splitting by a molecular clock of mitochondrial DNA. J.Mol. Evol., 21:160-174. [Jukes and Cantor, 1969] Jukes,T.H, and Cantor C.R. Evolution of prorein molecules. In Mammalian Protein Metabolism (Ed: H.N. Munro) Academic Press, New York (1969). pp. 21-132. [Huelsenbeck and Crandall, 1997] Huelsenbeck, J.P. and Crandall, K.A. 1997. Phylogeny estimation and hypothesis testing using maximum likelihood. Annu. Rev. Ecol. Syst., 28:437466. [Karp, 1972] Karp, R.M. ”Reducibility among combinatorial problems”, in: Complexity of Computer Computations (R.E. Miller and J.W. Thatcher, eds.), Plenum Press, 1972, pp. 85-103. [Kimura, 1980] Kimura, M. 1980. A simple method for estimating evolutionary rates of base substitutions through comparative studies of nucleotide sequences. J Mol Evol. 16:111-120. [Kosakovsky Pond and Muse, 2000] Kosakovsky Pond, S; Muse, S. 2000. HYPHY Package Distribution and Documentation Site. http://www.hyphy.org/ [Larget and Simon, 1998] Larget, B. and Simon, D. 1998. Faster likelihood calculations on trees. Technical Report #98-02. Department of Mathematics and Computer Science, Duquesne University. [Maddison et al, 1997] Maddison, D.R., Swofford, D.L. and Maddison, W.P. 1997. NEXUS: An extensible file format for systematic information. Syst. Biol., 46(4):590-621. [Moler and Van Loan, 1978] Moler, C., and Van Loan, C., 1978. Nineteen dubious ways to compute the exponential of a matrix. SIAM Rev., 20:801-836.
MAXIMUM LIKELIHOOD FRAMEWORK FOR GENETIC SEQUENCE ANALYSIS..
27
[Muse 1995] Muse, S.V. 1995. Evolutionary analyses of DNA sequences subject to constraints on secondary structure. Genetics 139:1429-1439. [Muse et al 1997] Muse, S.V., A.G. Clark, and Thomas, G.H. 1997. Comparisons of the process of nucleotide substitution among repeated segments of the α- and β-spectrin genes. J. Mol. Evol. 44:492-500. [Muse and Gaut, 1994] Muse, S.V., and Gaut, B.S. 1994. A likelihood approach for comparing synonymous and nonsynonymous nucleotide substitution rates with application to the chloroplast genome. Mol. Biol. Evol. 11:715-724. [Muse and Weir, 1992] Muse, S.V., and Weir, B.S. 1992. Testing for equality of evolutionary rates. Genetics 132:269-276. [Nielsen and Yang, 1998] Nielsen, R. and Yang, Z. 1998. Likelihood Models for Detecting Positive Selected Amino Acid Sites and Applications to the HIV-1 Envelope Gene. Genetics 148:929-936. [NCBI, 2000] Elzanowski, A.and Ostell, J. 2000. The Genetic Codes. http://www.ncbi.nlm.nih.gov/Taxonomy/Utils/wprintgc.cgi?mode=c [Papoulis, 1984] Papoulis, A. Probability, Random Variables, and Stochastic Processes. 2nd ed. New York: McGraw-Hill, 1984. [Pevzner, 2000] Pevzner, P.A. Computational Molecular Biology. An Algorithmic Approach. The Cambridge:MIT Press, 2000. [Posada and Crandall, 1998] Posada, D. and Crandall, K.A. 1998. MODELTEST: testing the model of DNA substitution. Bioinformatics 14(9):817-818. [Press et al, 1999] Press, W.H., Teukolsky, S.A., Vetterling, W.T., Flannery. B.P. Numerical Recipes in C. Second Edition. Cambridge University Press (1999). [Rodrigues et all, 1990] Rodriquez, F.J., Oliver, J.L., Marin, A. and Medina, J.R. 1990. The general stochastic model of nucleotide substitution. J.Theor. Biol., 142:485-501. [Schervish, 1997] Schervish, M.J. Theory of Statistics. Springer Series in Statistics, 1997. [Schoniger and von Haeseler, 1993] Schoniger, M., and von Haeseler, A. 1993. A simple method to improve the reliability of tree reconstructions.Mol. Biol. Evol. 10:471-483. [Simon and Larget, 2001] Simon, D and Larget, B. 2001. BAMBE (Bayesian Analysis in Molecular Biology and Evolution) Version 2.03 beta. http://www.mathcs.duq.edu/larget/bambe.html [Swofford, 1998] Swofford, D.L. 1998. PAUP*: phylogenetic analysis using parsimony (and other methods). Version 4.0 (prerelease test version) Sinauer, Sunderland, Massachusetts [Takahata, 1987] Takahata, N. 1987. On the overdispersed molecular clock Genetics, 116:169179. [Thorne et al, 1998] Thorne, J.L., Kishino, H., Painter, I.S. 1998. Estimating the rate of evolution of the rate of molecular evolution. Mol. Bio. Evol., 15:1647-1657. [Uzzel and Corbin, 1971] Uzzel, T., and Corbin, K.W. 1971. Fitting discrete probability distributions to evolutionary events. Science, 172:1089-1096. [Yang, 1993] Yang, Z. 1993. Maximum likelihood estimation of phylogeny from DNA sequences when substitution rates differ over sites. J. Mol. Bio. Evol., 10:1396-1401. [Yang, 1994] Yang, Z. 1994. Maximum Likelihood Phylogenetic Estimation from DNA Sequences with Variable Rates over Sites: Approximate Methods J. Mol. Evol., 39:306-314 [Yang, 1997] Yang, Z. 1997. PAML: a program for package for phylogenetic analysis by maximum likelihood. CABIOS, 15:555-556. [Yang, 1998] Yang, Z. 1998. Likelihood Ratio Tests for Detecting Positive Selection and Application to Primate Lysozyme Evolution. Mol. Biol. Evol. 15(5):568-573. [Yang et al, 2000] Yang, Z, Nielsen, R, Goldman, N, Krabbe Pedersen A-M. 2000. Codon-Substitution Models for Heterogeneous Selection Pressure at Amino Acid Sites. Genetics, 155:431-449