World Academy of Science, Engineering and Technology 74 2011
Model Based Monitoring Using Integrated Data Validation, Simulation and Parameter Estimation Reza Hayati1, Maryam Sadi2, Saeid Shokri3 , Mehdi Ahmadi Marvast4,
Saeid Hassan Boroojerdi5 and Amin Hamzavi Abedi6 1
Reza Hayati is with Research Institute of Petroleum Industries, Tehran, Iran; (Corresponding author to provide phone: 98 2148252503; fax: 98 21- 44 73 97 13; e-mail:
[email protected]). 2 Maryam Sadi is with Research Institute of Petroleum Industries, Tehran, Iran; (e-mail:
[email protected]). 3 Saeid Shokri is with Research Institute of Petroleum Industries, Tehran, Iran; (e-mail:
[email protected]). 4 Mehdi Ahmadi Marvast is with Research Institute of Petroleum Industries, Tehran, Iran; (e-mail:
[email protected]). 5 Saeid Hassan Boroojerdi is with Research Institute of Petroleum Industries, Tehran, Iran; (e-mail:
[email protected]). 6 Amin Hamzavi Abedi is with Research Institute of Petroleum Industries, Tehran, Iran; (e-mail:
[email protected]).
nowadays routinely performed for steady state processes and commercial software is available to implement it online [3,4]. On the other hand, data mining uses large collections of historical data to seek the most favorable combination of operating parameters. Data clustering can reveal multiple ranges of operating conditions, and correlation analysis allows one to detect patterns in the data sets [5]. The challenge for maintenance departments is to apply their limited resources for the most effective return. The overall costs can be reduced by access to real-time information on under-performing assets and anticipating the need for maintenance. In this paper, we offer simultaneous rigorous data reconciliation and parameter estimation as a comprehensive solution for today’s plant performance monitoring challenges in the oil and gas processing, refining, petrochemical, and chemical industries. The applied method in this paper uses real-time plant data and rigorous simulation models to extract validated process and equipment performance information. This method employs firstprinciples simulation techniques with proven data reconciliation technology to provide plant operating data that is consistent, comprehensive, timely, and trustworthy. This paper is organized as follows. In section II, the problem formulation is described. In this section we combine data reconciliation and parameter estimation to eliminate random errors of measured data and update model parameters. In this work, we have used of rigorous process simulation for modeling and integrate it with data reconciliation and parameter estimation technique by Component Object Model (COM) technology. In this paper, we have supposed that there are no gross errors or they have been eliminated before implementation of this technique. In section III, we implement this technique on two case studies to determine model parameters and key performance indicator of process equipments for monitoring them. Thus we can plan predictive maintenance using process monitoring and prevent of unwanted events.
Abstract— Efficient and safe plant operation can only be achieved if the operators are able to monitor all key process parameters. Instrumentation is used to measure many process variables, like temperatures, pressures, flow rates, compositions or other product properties. Therefore Performance monitoring is a suitable tool for operators. In this paper, we integrate rigorous simulation model, data reconciliation and parameter estimation to monitor process equipments and determine key performance indicator (KPI) of them. The applied method here has been implemented in two case studies. Keywords— Data Reconciliation, Measurement, Optimization, Parameter Estimation, Performance Monitoring. I. INTRODUCTION Measurements are needed to monitor process efficiency and equipment condition, but also to take care that operating conditions remain within acceptable range to ensure good product quality, avoid equipment failure and any hazardous conditions. Recent progress in automatic data collection and archiving has solved part of the problem, at least for modern, well instrumented plants: operators are now faced with a lot of data, but they have little means to extract and fully exploit the relevant information it contains [1]. For these reasons the estimation of model parameters is an important tool for performance monitoring and predictive maintenance. After the feedstock supply and the energy consumption, process maintenances represent the largest voice in operative costs for refineries and petrochemical plants. Moreover, to further reduce profit margins, failure maintenances due to accidents or malfunctions can occur without notice, by influencing the overall production and the operational planning. Two strategies can be adopted for efficient process monitoring: one based on a first principle process model, used to reconcile measurements, and one based on feature extraction from a large historical data set. Data validation [1, 2] uses sensor redundancy and a plant model to reduce measurement uncertainty and to calculate all non measured state variables of the system. Data validation is
307
World Academy of Science, Engineering and Technology 74 2011
II. PROBLEM FORMULATION The nonlinear data reconciliation and parameter estimation problem is formulated in much the same way [7]: choose x and θ to Min [(y - x)TQ-1 (y - x)] Such that h(x, θ) = 0 and g(x, θ) ≥0
(1)
∑ (term1 + term2)
term2 =
( Xmrr − Xrr ) σ mrr m =1
∑
(5) 2
(6)
Subject to θmin ≤ θ ≤ θmax Xrilb ≤ Xri ≤ Xriub
(2) (3)
(7) (8)
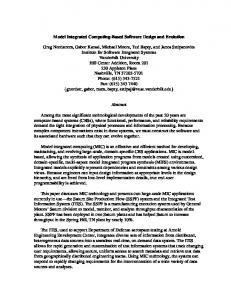
Where Nexpi is number of experiments in data set i, Nri is number of reconciled input variables, Nrr is number of measure results variables, θ is vector or varied parameters, Xmri is measured values of the reconciled input variables, Xri is calculated values of the reconciled input variables, Xmrr is measured values of the results variables, Xrr is calculated values of the results variables and σ is Standard deviation specified for the measured variables. III. CASE STUDIES Two case studies will be described below in which the pattern search algorithm is used as an optimization technique and is linked to simulation using COM Technology. A. Performance monitoring of Water-ethanol distillation column In this example, we reconcile measurements and fit column Murphree stage efficiency to operating data for a binary distillation column with one feed and two product streams. Also we have assumed that standard deviation for flow rates and temperatures are 5% and 1 oC respectively. Reflux ration is equal to 3 and pressure is 103.42 kPa and also it has been assumed that reflux ratio and pressure are fixed [9]. Figure 1 shows process flow diagram of water- ethanol distillation column.
DIST
FEED
COLUMN
BOTTOMS
Fig. 1 Water-ethanol distillation column
N exp i
θ , Xri
2
∑
Nrr
Where y is the vector of measured values, x is the vector of reconciled values , θ is the vector of parameters, Q is a weighting matrix, usually the inverse of the variance of the measured variables, h(x, θ) are the set of equality constraints representing the model and g(x, θ) are any inequality constraints present in the process. In the case of nonlinear data reconciliation both h(x, θ) and g(x, θ) are generally nonlinear functions. h(x, θ), representing the process model, could, in general, be a very complex nonlinear function involving heat and material balance equations, equilibrium, reaction equations and thermodynamics for a process involving multiple components, multiple phases, multiple units with recycle streams. In this work, we use of process simulators for modeling and handling of equality constraints, h(x, θ) = 0. The advantage of using a process simulator is that the simulator already has a library of process modules already available and satisfies the equality constraints, h(x, θ) = 0, automatically to a specified tolerance[8]. Commercial simulation packages allow one to formulate a data reconciliation problem with relative ease because the models (unit operation, thermodynamic and convergence) are already available in the simulation system. In this paper we applied pattern search algorithm as an optimization technique and joint it to process simulator using Component Object Model (COM) technology. In this technique mass and energy balance equations are solved using process simulator rigorously and optimization algorithm controls process simulator. Also optimization algorithm evaluates objective function in each iteration and provides new decision variables. Majority of commercial process simulators is based on sequential modular or closed form simulator in which the unit operation system models are solved one process unit at a time. If recycles exist, the solution becomes iterative and a convergence promotion method, Wegstein’s Method for example, is used to make the appropriate adjustments in order to satisfy mass and energy balances [8]. Therefore in sequential modular approach the variables of outlet streams of each block calculate and cannot be changed. Thus, we consider blocks specifications as input variables and transform above equations to bellow form [9].
min
( Xmri − Xri ) σ mri l =1 Nri
term1 =
( 4)
j =1
308
World Academy of Science, Engineering and Technology 74 2011
TABLE I DISTILLATION SYSTEM MEASUREMENT AND RECONCILED VALUES Standard TAG NAME Measured Validated Unit Deviation
9
3
201 E-4
R-1 4
202
1
F-1
Water Flow rate of Feed
55
5%
50.36
kmol/s
7 C-1
203
T-1 E-1
2
Ethanol Flow rate of
45
Feed
5%
43.93
W-2
kmol/s
204 8
W
205
B-1
W-1
F SP LIT
Temperature of Feed
25
1
25
o
C
E-3 W W-3 5
Total Flow rate of Distillate
45
5%
46.60
79.44
1
79.33
45
5%
47.69
82.22
1
82.74
Parameter
OFF
10.08%
kmol/s
206
Fig. 3 Flowsheet of cogeneration plant
Temperature of Distillate Total Flow rate of Bottoms Temperature of Bottoms Murphree stage efficiency
o
C
An air stream 1 is fed to compressor C1. Compressed air 2 reacts with natural gas 3 in combustion chamber R-1. Hot combustion gas 4 is expanded in T-1. Expansion work W-2 allows driving the compressor (work W-1) and the surplus W3 is available as net work. Turbine exhaust 5 is cooled down in a series of heat exchangers and rejected to the stack as stream 9. Boiler feed water in stream 201 is preheated in economizer E-4 and feeds drum F-1. A saturated liquid stream 203 is circulated to the vaporizer E-1 and returns to the drum as a vapor-liquid stream 204. Saturated steam 205 is further heated in E-3 to generate the superheated steam product 206. This model involves mass and energy balances, reactions and phase equilibria. Isentropic efficiency parameters are evaluated from the compressor and the turbine models. Overall heat transfer coefficients are estimated for all heat exchangers [10]. Table II lists the main variables in this example. All streams are described internally using standard state variables, namely partial molar flowrates for all components, pressure and molar enthalpy. Most of those state variables are not directly measured. In our example, some stream properties are supposed to be known exactly, such as the air and gas compositions. Some unit parameters are also given as exact numbers, such as the heat exchanger areas. Some extra variables need to be related to state variables because they are measured (temperatures, mole fractions) or because they should be estimated (heat transfer coefficients, compressor and turbine efficiency).
kmol/s o
C
------
Table I shows that the reconciled values match the measured values quite well. The reconciliation is quite substantial as indicated by the large reduction in the value of the objective function from 790.889 to 2.9585. The most significant result of this reconciliation is overall column efficiency. An efficiency of 10.08% is very low and indicative of severe fouling or nonstandard operation such as flooding. Figure 2 shows objective function value in each iteration of pattern search optimization algorithm. Best objective function value is 2.9585 that is corresponding to 10.08% in column efficiency. Best Function Value: 2.9585 60
Function value
50 40 30 20 10 0 0
20
40
60 Iteration
80
100
120
Fig. 2 Objective function value versus iteration
Best Function Value: 2.2188 80
Function value
60
B. Performance monitoring of cogeneration plant To illustrate simultaneous data validation and parameter estimation for performance monitoring, we consider flowsheet of a cogeneration plant, combining a gas turbine and a steam generator. Figure 3 shows flowsheet of cogeneration plant.
40
20
0 0
10
20
30
40 50 Iteration
60
70
80
90
Fig.4 Objective function value versus iteration
Table II shows that the reconciled values match the measured values quite well. The reconciliation is quite substantial as indicated by the large reduction in the value of
309
World Academy of Science, Engineering and Technology 74 2011
the objective function from 297.97 to 2.2188. The most significant results of this reconciliation are heat transfer coefficients, compressor and turbine efficiency. Figure 4 shows objective function value in each iteration of pattern search optimization algorithm. Best objective function value is 2.2188 that is corresponding to obtained results in table II. Table III shows comparison between obtained results and design case. We can implement this technique at other time steps and monitor key performance indicators of equipments and compare them together or with design case. Table III shows that heat transfer coefficients, compressor and turbine efficiency have decreased relative to design.
Mole Fraction CO2 in Stream 9 Mole Fraction O2 in Stream 9 Temperature of Stream 9 Power_W-3
Mass Flow of Stream 1 Temperature of Stream 1 Mass Flow of Stream 201 Temperature of Stream 201 Mass Flow of Stream 3 Temperature of Stream 3 Temperature of Stream 4 Compressor Efficiency_ C-1 UA_ E-1
UA_ E-3
UA_ E-4
Expander Efficiency_ T-1 Temperature of Stream 202 Mass Flow of Stream 206 Temperature of Stream 206 Temperature of Stream 2 Temperature of Stream 5
Measured
Standard Deviation
Validated
Unit
kg/s
12.9
5%
12.63
20
1
20
2.8
5%
2.67
o
Compressor Efficiency of
kg/s o
40.25
0.3
2%
0.3
19
1
19
o
c
1200
3
1199.25
o
c
-----
0.12
0.005
0.12278
-----
125
5%
117.62
3600
100
3696.4
o
c
kw
81.25%
85%
-----
UA_ E-1
54.5
55.5
kw/m2/k
UA_ E-3
4.3
4.8
kw/m2/k
UA_ E-4
25.5
26
kw/m2/k
81.5%
85%
-----
C-1 1
0.03752
TABLE III THE OBTAINED RESULTS OF PROCESS MONITORING AND DESIGN CASE Design TAG NAME Validated Unit case
c
40
0.003
Thus this technique can be very useful in process monitoring for scheduling maintenance of process equipment. It can be used to accurately estimate key performance parameters of process equipment. For example, heat transfer coefficient of heat exchangers can be estimated and used to determine whether the heat exchanger should be cleaned.
TABLE II DATA VALIDATION OF COGENERATION PLANT TAG NAME
0.038
c
kg/s
Expander Efficiency_ T-1
IV. CONCLUSIONS Parameter
OFF
81.25%
Parameter
OFF
54.5
Parameter
OFF
4.3
Parameter
OFF
25.5
Parameter
OFF
81.5%
180
2
179.01
2.7
2%
2.72
450
3
451.65
In this work, key performance indicators of process equipments were introduced as a suitable tool for process monitoring and predictive maintenance (for example overall heat transfer coefficient in heat exchangers or isentropic efficiency in compressors and turbines). For achieving these parameters, the integrated data validation, parameter estimation and rigorous process simulation was used and implemented on two case studies successfully. With monitoring the current performance of equipments relative to design or to previous times that this technique has been implemented, efficient and safe plant operation can be achieved. For example, heat transfer coefficient of heat exchangers can be estimated and used to determine whether the heat exchanger should be cleaned. The presented technique here can be developed and implemented as online.
----kw/m2/ k kw/m2/ k kw/m2/ k ----o
c
kg/s o
REFERENCES
c [1]
350
2
350.20
o
c [2]
700
3
700.36
o
c
310
G., Heyen and B., Kalitventzeff, Process monitoring and Data Reconciliation, in L. Puigjaner and G. Heyen (eds), Computer Aided Process Engineering, Wiley-VCH, 2006. N., Arora, L. T., Biegler and G., Heyen, Data Reconciliation Framework, in B. Braunschweig and R. Gani (eds) Software Architectures and Tools for Computer Aided Process Engineering, Elsevier, 2002.
World Academy of Science, Engineering and Technology 74 2011
[3]
B., Kalitventzeff, G., Heyen, M., Mateus Tavares, Data Validation, a Technology for intelligent Manufacturing, in L. Puigjaner and G. Heyen (eds), Computer Aided Process Engineering, Wiley-VCH, 2006.. [4] http://www.belsim.com/Vali.aspx, accessed November 25, 2006. [5] http://www.pepite.be/en/produits/PEPITo, accessed November 25, 2006. [6] S., Narasimhan and C., Jordache, Data reconciliation and gross error detection: an intelligent use of process data, Houston, TX, USA: Gulf Publishing Company, 2000. [7] J.A., Romagnoli and M.C., Sanchez, Data processing and reconciliation for chemical process operations, Academic Press, 2000. [8] M., Piccolo, P.L., Douglas and P.L., Lee, Data reconciliation using Aspen Plus, Developments in chemical engineering and mineral Processing, Volume 4, Issue 3-4, Pages 157-182, 1996. [9] Aspen Plus User Guide, AspenTech Co., 2008. [10] http://www.lassc.ulg.ac.be/webCheng00/meca0468-1, November 2006.
311