Test System Modeling
Modeling a Verification Test System for Mixed-Signal Circuits David San Segundo Bello Ronald Tangelder Hans Kerkhoff Mesa+ Research Institute, the Netherlands
Modeling a commercial verification test system enables simulated tests to be performed before actual testing with instruments and enhances communication between designers and test engineers. IN CONTRAST TO the large number of logic gates and storage circuits encountered in digital networks, purely analog networks usually have relatively few circuit primitives (operational amplifiers and so on). The complexity lies not in the number of building blocks but in the complexity of each block and the need to test a range of parameters—for example, gain, bandwidth, and signal-to-noise ratio. Degraded circuit performance as well as nonfunctional operation must be checked. Thus, circuit complexity rather than volume complexity is the dominant problem in analog test, and testing mixed-signal circuits entails more difficulties than testing purely digital circuits. In IC manufacturing, circuits traditionally move from design to test with little thought about how each department’s activities affect those of the other. This lack of foresight almost always results in iteration cycles between design and test to realize a testable design that also satisfies the specification. We need a bridge between design and test phases to enable a smooth transition. An
January–February 2001
integrated approach whereby both teams understand each other’s requirements is a big step in the right direction. Interaction between design and test databases significantly increases the degree to which design and test development can operate as concurrent processes; some work has already been done in this area.1-3 Our goal was to build Spice models for the instruments incorporated in the IntegraTest system4 so that we could simulate the tests this system conducts during design. The models are based on manufacturer specifications, and control parameters used in the models are as close as possible to those in the instruments. To make changes in the models transparent to users, entering of parameters is isolated from the models’ internal construction. After building the models, we compared the results of the simulated tests with results from actual tests performed with real instruments.
The IntegraTest system The IntegraTest system is a hardware and software platform for VXI (VME extension for instrumentation) -based measurement subsystems developed by Microlex Systems and Integrated Measurement Systems (IMS). The basic hardware architecture consists of three main blocks: the test controller, the VXI modules, and the high-speed tester. The test controller is typically a Unix-based workstation, but any computer with support for 0740-7475/01/$10.00 © 2001 IEEE
63
LabView and IntegraTest ATS1/200-MHz mainframe
Sun workstation
PC486-66 controller HPE1445A arbitrary waveform generator HPE1411B digital multimeter HPE1420B 200-MHz counter HPE1428A digitizer B&K3005 input module B&K3105 output module HPE1472A multiplexer HPE1465 matrix
Test System Modeling
VXI mainframe
ATS1/VXI mainframe synchronization module (fixture board)
Figure 1. Implementation of the IntegraTest system.
programming GPIB (general-purpose interface bus) and VXI instruments can be used. It includes the software needed to perform the tests—that is, a program to generate and visualize waveforms, the testing programming environment, and the drivers for the instruments. The VXI modules within the VXI mainframe include all the hardware instruments plus the so-called slot 0 controller. This controller has such special system resources as backplane clocks, configuration signals, and trigger signals, and it also houses the VXI mainframe host. The hardware instruments divide roughly into two categories: routing modules and instrument modules. The routing modules are the HPE1465 switch matrix module and the HPE1472A RF multiplexer. The instrument modules are the B&K3105 output module, the B&K3005 input module, the HPE1445A arbitrary waveform generator, the HPE1428A digitizer, the HPE1420B universal counter, and the HPE1411B digital multimeter. (All instruments referred to as HPExxxx are manufactured by
64
Hewlett-Packard, and all instruments referred to as B&Kxxxx are manufactured by Denmarkbased Bruel & Kjær.) The last part of the system is the ATS1 system.5 It is a 200-MHz high-speed tester consisting of the ATS mainframe, a controller module, a timing module, slots for up to 14 data modules, a fixture board, and several socket cards. The fixture board covers the top of the ATS mainframe and extends the I/O channels of the inserted modules to external terminals. A socket used to fix the device under test (DUT) and connect it to the modules can be mounted on the fixture board. Figure 1 shows the actual IntegraTest system implementation, including the interface between the VXI and the test mainframes. A GPIB handles the data exchange between the test controller and the VXI mainframe, and an Ethernet connection handles communication between the test controller and the ATS mainframe. The VXI bus6 controls and manages communication with the modules. IEEE Design & Test of Computers
dc
January–February 2001
Demultiplexer
Multiplexer
Our first goal was Sinusoidal Low-pass filter to build functional 250 kHz models of the instruSquare Low-pass filter ments in the test sys10 Mhz Triangular tem. We decided to develop simple modRamp els first, then check User their validity and determine whether there were any obstacles to achieving the Figure 2. The TRAN model for the HPE1445A waveform generator. best results. Also, we wanted to establish an easy way to build the files used in the test modeling the filters quite straightforward. Modeling the B&K3105, however, is not so simulations so that subsequent changes in the models wouldn’t affect the simulation files straightforward. Its manual9 indicates that the instrument has a low-pass reconstruction filter already written. We chose to work with Spice because of its with a bandwidth of 30 kHz but gives no clue widespread use in the field of analog and about the order or the approximation used to mixed-signal design. We used Avant!’s (for- build the filter. We solved this problem by meamerly Meta’s) hSpice implementation to make suring the filter’s frequency response and trying to build an appropriate model that matched the the models and the simulations.7 The instruments modeled are the waveform measurements. Both the B&K3105 and the generators and the digitizers, as well as the rout- B&K3005 have the same low-pass reconstrucing system. The counter and the multimeter use tion filter. This let us use two different setups to complex DSP (digital signal processing) algo- measure the filter response. We can measure rithms to calculate their results, and we chose the filter in the B&K3105 generator with the not to model them because a Spice implemen- HPE1428A digitizer or use the HPE1445A wavetation would be excessively complex. form generator to measure the filter in the B&K3005 digitizer. Because the B&K3005 digiWaveform generators tizer can measure with higher precision than the Modeling the signal generators in Spice did- HPE1428A, we decided to measure the fren’t present any special difficulty. The main char- quency response of the filter in the B&K3005. acteristics chosen for modeling the arbitrary From this measurement we found that the filter’s waveform generators were the types of signals cut-off frequency is actually 33 kHz, not 30 kHz. they generate (dc, sinusoidal, square, trianguWhile developing the first versions of the lar, ramp, and so on), the reconstruction filters, models, we experienced a problem when trying and the output impedance. to find the frequency response of a circuit with The HPE1445A waveform generator in- either of the two generators. The model has cludes two low-pass reconstruction filters, one been designed to work in transient-time simuwith a bandwidth of 250 kHz and the other with lations (TRAN in Spice). Hence, if we want to a bandwidth of 10 MHz (the maximum fre- make a frequency sweep, the appropriate wavequency allowed for a signal from the form must be externally produced and entered HPE1445A). Fortunately, the data sheet for the through the user input node provided in our instrument8 describes the type of filter used in model. This approach proved to be very ineffieach case. Both are Bessel-Thompson filters; cient because the simulation time increased the 250-kHz filter is of the fifth order, and the 10- dramatically. Our solution was to use the freMHz filter is of the seventh order. This makes quency sweep simulation (ac) in Spice. To do
Multiplexer
Modeling the instruments
Zo
Output
65
Test System Modeling
66
Multiplexer
Demultiplexer
frequency response, so we used a BesselHigh-pass filter 450 Hz Thompson approximation because of its Low-pass filter V_measure Input 30 MHz linear-phase characCin Rin teristics. The low-pass filter used in the B&K3005 is the same as that used in the Figure 3. The model for the HPE1428A digitizer. B&K3105, as mentioned earlier. Figure 3 represents the model used for the this, we devised an additional (and simpler) version of the model for the HPE1445A to be used HPE1428A digitizer. The model for the in ac simulations. This new model has only two B&K3005 is similar; the only differences are the generators, one for the frequency sweep and a high-pass and low-pass filters. dc generator for offset inclusion. Figure 2 represents the model used for the HPE1445A wave- Routing system The key factor in the IntegraTest system is form generator and transient-time analysis. the routing system. It comprises the HPE1465 matrix module, the HPE1472A RF multiplexer Digitizers The characteristics used to model the module, and the cables connecting them to the HPE1428A and the B&K3005 digitizers are the instruments and the DUT. Instead of trying to model the two routing input impedance and capacitance, the high-pass filters used for ac coupling, and the output low- modules separately, we combined them with pass filter. The input impedance and the input the cables in a generic routing model. The IMS capacitance appear in the manuals of both mod- system has 16 channels that can be used as either inputs to or outputs from the DUT.4 To ules, so this part presented no difficulty. Specifications for the HPE1428A module keep a correspondence between the model provide no data regarding the order or the and the actual system, we made sure that the approximation used to build the high-pass fil- routing model also consists of 16 channels. It ter; only the cut-off frequency (450 Hz) is men- follows the same connection scheme as the tioned.10 Also, it proved impossible to measure actual system: channels 1 to 14 are routed the filter’s frequency response because of prob- through the matrix, and channels 15 and 16 are lems with the software driver for the low-fre- routed through the multiplexer. In the model, quency-measurement instrument. every channel implements the following signal The B&K3005 digitizer’s high-pass filter has path. First there’s the input cable (from the a cut-off frequency of 10 Hz.11 As with the instruments’ or the DUT’s outputs to the routing HPE1428A, the instrument specifications pro- system). Then, depending on the channel numvide no data regarding the approximation used ber, there’s a model of the signal path through to build the filter. However, unlike the the matrix or the multiplexer. Finally, we have HPE1428A, measuring the filter’s frequency the output cable (from the routing system to the response presented no problems. The model instruments’ or the DUT’s inputs). that best fit the measurements was a first-order The cables used in the IntegraTest system to Butterworth high-pass filter. connect the instruments and the DUT to the The HPE1428A includes a low-pass filter with routing modules are 1-meter-long coaxial a 30-MHz cut-off frequency at its output. The cables of the RG-174/U type. We used the lossy instrument’s specifications give no additional transmission line model included in hSpice to data on the order and approximation used to model the cable, employing the parameters for build the filter. Additionally, neither of the gen- the specific cable model. erators in the system let us measure the filter’s The HPE1465 matrix module specifications IEEE Design & Test of Computers
TEST THE DUT: measuring the STEP RESPONSE give little useful data for modeling *GENERATOR:hpe1445aawg the signal path through the mod*DIGITIZER:hpe1428adig *DUT:comb_two_stage ule. The module’s data sheet indi*routing: includes cables cates that the switches in the matrix * Subcircuits are latched armatures; however, no .INCLUDE ‘../lib/filters.spi’ data regarding the physical con.INCLUDE ‘../lib/cables.spi’ .INCLUDE ‘../lib/comparator.spi’ struction of the armatures is avail.INCLUDE ‘../lib/mxers.spi’ able. So the main characteristics * The instruments used to model the matrix are the .INCLUDE ‘../lib/hpe1428adig.spi’ .INCLUDE ‘../lib/hpe1445aawg.spi’ 10-MHz bandwidth and the trans.INCLUDE ‘../lib/routingwc.spi’ mission line’s characteristic imped* The DUT .INCLUDE ‘../DUT/simple_excitation.spi’ ance. The very low series resistance value and the very high * The routing system Xrout 0 0 0 0 0 0 0 0 0 0 0 0 0 0 test_out_opamp v_gen insulation resistance value12 did not + oma1 oma2 oma3 oma4 oma5 oma6 oma7 oma8 oma9 oma10 oma11 oma12 oma13 affect the simulations. For simplicioma14 + v_dut_out test_in_opamp ty, we decided to eliminate them + routing from the model. * The 1445 AWG The problem encountered when X1445 0 v_gen hpe1445awg signal=3 amplit=1 offset=2.5 freq=2.5k infinity_load=1 * The 1428 digitizer modeling the matrix surfaced again X1411 v_dut_out v_meas hpe1428dig when we tried to model the multi* Calculations and post-processing plexer: insufficient data from the .OPTION POST=1 manufacturer. The switches in the .TRAN 2n 300u .PROBE TRAN V(v_gen) V(v_meas) multiplexer are nonlatched arma.END tures, but there is no data about their electrical characteristics or Figure 4. Example Spice simulation file using several instrument models. how they are constructed. The multiplexer also has a series and an insulation resistance, and a bandwidth of 1.3 simulation file, including the routing system, GHz. Its bandwidth is much higher than the max- the HPE1445A waveform generator, and the imum bandwidth of any instrument in the HPE1428A digitizer. The file is divided into IntegraTest system (250 MHz for the HPE1428A three parts (following the comments). The first digitizer), so we decided not to model it. The part includes the necessary circuit files, such as only characteristics modeled for the multiplex- the models for the instruments used and the er were the series and the insulation resistance. Spice description of the circuit to be simulated. The modules and their parameters appear in Verifying the models the second part. Finally, in the third part, we The next step was to determine whether the can see the calculation and postprocessing models could accurately simulate the results options. In this way, creation of the file for simobtained from a real test made with the actual ulating the measurement system can be easily instruments. First we show how the simulation automated from an existing description of the files were constructed, then we compare the test circuit and the test to be carried out. simulation results with the test results. For the first tests we measured the frequency One goal of the project was to allow easy and step responses of direct connections generation using software of the simulation files between the generator and digitizer pairs that use the instrument models. Hence, the (HPE1445A–HPE1428A and B&K3105–B&K3005). designer need not construct the test simulation These direct connections were made first withfiles. This makes the models suitable for inclu- out the routing system, then through the matrix, sion in systems such as the Cadence Design and finally through the multiplexer. In the second Framework or Mismatch.13 round of tests we measured the frequency and Figure 4 shows an example of a typical Spice step response of a simple RC (resistance-capaci-
January–February 2001
67
Test System Modeling
dB
1 0 −1 −2 −3 −4 −5 −6 −7 −8 −9 1.0
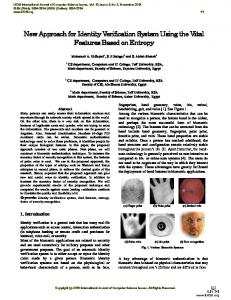
tance) low-pass filter. Finally, we measured the frequency and pulse responses of two circuits, including two different commercially available operational amplifiers, the LM324 and the OP27. All the programs (virtual instruments) necessary to perform the tests with the IntegraTest system were created in the LabView environment. Measurements made without the routing system closely resembled those achieved with the simulated tests. The only difference found in the frequency response was some noise. In the case of the HPE1445A–HPE1428A pair, we also found a difference of about 1 decibel (dB) at the highest frequencies. Figure 5 shows the simulation and test results using the matrix as the routing module. At the highest frequencies, a lot of noise is present. The simulated test for the step response (Figure 5b) doesn’t include the voltage overshoot found in the test results. Its absence results from the matrix model’s simplicity. Only one reactive element is present in the model, making it impossible to oscillate. The real matrix, however, presents some parasitic inductances and capacitances. Figure 6 shows the results of simulating and measuring the connection through the matrix of the B&K3105 and the B&K3005. The routing system doesn’t affect the measurements with the low-frequency modules, and the results are the same whether the matrix and the multiplexer are used or not. The simulation results
Simulated Measured 10
100 Frequency (kHz)
(a)
1,000
10,000
4 Simulated Measured
3
Voltage (V)
2 1 0 −1 −2 −3
0
(b)
50
100 150 200 250 300 350 400 450 500 Time (nanoseconds)
Figure 5. Frequency (a) and step (b) response of the connection through the matrix between the HPE1445A and the HPE1428A.
20 Simulated Measured
0
5 Simulated Measured
4 −20 Voltage (V)
3
dB
−40 −60
1 0
−80
−1
−100 −120 1.0 (a)
2
−2 −3 10 Frequency (kHz)
100 (b)
0
50
100
150 200 250 Time (microseconds)
300
Figure 6. Frequency (a) and step (b) response of the connection through the matrix between the B&K3105 and B&K3005.
68
IEEE Design & Test of Computers
January–February 2001
Simulated Measured
dB
5 0 −5 −10 −15 −20 −25 −30 −35 −40 −45 −50 1.0 (a)
10
100 Frequency (kHz)
1,000
10,000
3 Simulated Measured
2
Voltage (V)
1 0 −1 −2
−3 0 (b)
1,000
2,000 3,000 Time (nanoseconds)
4,000
5,000
Figure 7. Frequency (a) and step (b) response of the RC filter routing the signals through the matrix, measured using the HPE1445A and the HPE1428A.
5 0 −5 −10 dB
follow the real test results with great accuracy. The only difference appears at the highest frequencies, but the signal levels are very low (less than −60 dB). Step response (Figure 6b) revealed only a small difference in the oscillation frequency. In this case, as opposed to Figure 5, the test simulation presents some overshoot, owing to the nature of the low-pass filter. Figure 7 shows the results of tests made putting a simple RC filter between the instruments and routing the signals through the matrix. When using the multiplexer to route the signals, we expected the analysis results to be very similar to those involving no routing. However, this was not the case. The results of different tests performed with the same configuration at different times, or after changing a connection, show a random pattern, appearing in Figure 8. We found no plausible reason for this strange behavior. The last batch of tests involved two different commercially available operational amplifiers in two different configurations, and here we faced a practical problem. Although the HPE1445A waveform generator allows amplitudes as low as 0.163 V,8 the software driver for the instrument reported errors if we tried to output a signal with less than 0.5 V of amplitude (1 V peak to peak). This kept us from doing a small-signal analysis. The simulation results agree with the smallsignal characteristics as presented in the data sheets for the amplifiers.14,15 The test results, however, don’t. This is because the input to the amplifier was actually a large signal, owing to the problems with the software driver for the waveform generator. Looking at the large-signal frequency response in the amplifiers’ data sheets, we could see that the measurement results were as predicted by the manufacturer. The difference in results is a consequence of the Spice model for the amplifiers. These models are not the actual amplifier implementations but functional descriptions of them. This simplification assumes a small signal, so the effects of large signals are not taken into account. Fixing the software problem so that small signals could be used for the measurements or having better models for the devices that allow large signals to be used as input to the circuit model would solve this problem.
−15 −20 −25 −30 1.0
Multiplexer Multiplexer Multiplexer Multiplexer
at at at at
10
input and output input and output 2 input output
100 1,000 Frequency (kHz)
10,000
Figure 8. Frequency response of the RC filter for different multiplexer configurations.
69
Test System Modeling
While the models for the instruments were very simple, the results obtained from the simulations nearly equaled the test results in almost all the tests made. The only differences appeared when testing the operational amplifiers and when testing the RC filter using the multiplexer for the routing. In the first case, the simulations failed because the software driver for the HPE1445A generator didn’t work according to the instrument specifications. In the second case, the difference between the simulation and the measurement is due to the multiplexer model’s simplicity. No data was available regarding the characteristics of the switches in the matrix and the multiplexer. However, the results of the simulations with the matrix model were very accurate, with only second-order effects not being simulated.
erence. VXI instrument manufacturers should at least make sure the data sheet specifications pertain to the actual working environment and thus ensure that the modules’ performance is not limited by the driver software. ■
References 1. T. Austin, “Creating a Mixed-Signal Simulation Capability for Concurrent IC Design and Test Program Development,” Proc. IEEE Int’l Test Conf., IEEE Press, Piscataway, N.J., 1993, pp. 125-132. 2. S.C. Bateman and W.H. Kao, “Simulation of an Integrated Design and Test Environment for Mixed-Signal Integrated Circuits,” Proc. IEEE Int’l Test Conf., IEEE Press, Piscataway, N.J., 1992, pp. 405-414. 3. W. Kao, J. Xia, and T. Boydston, “Automatic Test Program Generation for Mixed Signal ICs via Design to Test Link,” Proc. IEEE Int’l Test Conf., IEEE Press, Piscataway, N.J., 1992, pp. 860-865.
WE HAVE SHOWN that it is possible to build
Spice models of test instruments and use those models to simulate the tests. The results of these simulations can mimic those of the real tests. Also, the files used for the simulations are built in a highly structured fashion. This allows test simulations to be easily automated from either the test or the simulation environment. Future improvements depend on data availability to model the switches in both the matrix and the multiplexer routing modules. Also, second-level models of the other instruments can be made, including the analog-to-digital and digital-to-analog blocks that can be found in all the instruments (which include analog-to-digital converters or digital-to-analog converters and amplifiers and attenuators). Inclusion of these models in higher level systems (such as Mismatch or Cadence’s Design Framework) is also an important future possibility. Building the simulation files is easy, and they are transparent to the user. As noted earlier, during the experiments we discovered quite a difference between the data sheet provided for the VXI module and its actual behavior. Much of the information in the data sheet is based on the VXI module’s hardware capabilities. In some cases, however, because of limitations in the driver software, performance falls below what the data sheet specifies, so the data sheet could not serve as a performance ref-
70
4. IntegraTEST Training Manual, MicroLEX Systems A/S, Hoersholm, Denmark, 1995. 5. Logic Master ATS Series System Operation Manual, Integrated Measurement Systems, Portland, Ore., 1996. 6. R. Wolfe, “Short Tutorial on VXI/MXI,” National Instruments Application Note 030, Austin, Tex., 1996. 7. HSPICE User’s Manual, Avant! (formerly Meta Software), Fremont, Calif., 1996. 8. HPE1445A Arbitrary Function Generator User’s Manual, Hewlett-Packard, Palo Alto, Calif., 1992. 9. 30 kHz Output Module Type 3105 Hardware User Guide, Bruel & Kjaer, Naerum, Denmark, 1994. 10. HPE1428 Digitizer User’s Manual, HewlettPackard, Palo Alto, Calif., 1992. 11. 30 kHz Input Module Type3005 Hardware User Guide, Bruel & Kjaer, June 1994. 12. HP75000 Family of VXI Products and Services 1995 Catalog, Hewlett-Packard, Palo Alto, Calif., 1995. 13. N. Engin, “Linking Mixed-Signal Design and Test: Generation and Evaluation of Specification-Based Tests,” doctoral thesis, Febodruk B.V., Enschede, the Netherlands, 2000. 14. LM124/LM224/LM324/LM2902 Low-Power Quad Operational Amplifiers Data Sheet, National Semiconductor, Santa Clara, Calif., 1994. 15. OP-27 Low-Noise, Precision Operational Amplifier Data Sheet, Analog Devices, Norwood, Mass.
IEEE Design & Test of Computers
David San Segundo Bello is a PhD candidate at the Dutch National Institute for Nuclear and High-Energy Physics and the University of Twente, the Netherlands. His research interests include data converters and analog and mixed-signal design. He received a BS in telecommunications engineering from the Ramon Llull University, Barcelona, Spain, and an MS in electronic engineering from the Autonomous University of Barcelona. He completed his master’s thesis in the Testable Design and Test of Microsystems Group at the University of Twente. This article is a result of that work.
Ronald Tangelder is an IC designer at National Semiconductors Hengelo (Ov), the Netherlands. His main research interests include design and test of asynchronous circuits and mixed hardware/software systems. He received an MSc in computing science and a PhD for his thesis on the design of chip architectures for accurate inner product computation, both from the Eindhoven University of Technology, the Netherlands.
Direct comments and questions about this article to David San Segundo Bello, Mesa+ Research Institute, IC Design Group, PO Box 217, 7500 AE Enschede, the Netherlands;
[email protected].
Moving? Please notify us four weeks in advance Name (Please print) New Address City
Hans Kerkhoff heads the Testable Design and Test of Microsystems Group at the Mesa+ Research Institute, Enschede, the Netherlands. He is also founder of the company TwenTest. His interests include testable design and testing of mixed-signal microsystems and embedded systems. He received an MSc in telecommunications at the Technical University of Delft, the Netherlands, and the Delft Hogeschool Award for his MSc thesis. He earned a PhD in technical science (microelectronics) at the University of Twente, the Netherlands.
January–February 2001
State/Country
Zip
Mail to: IEEE Computer Society Circulation Department PO Box 3014 10662 Los Vaqueros Circle Los Alamitos, CA 90720-1314
• •
•
List new address above. This notice of address change will apply to all IEEE publications to which you subscribe. If you have a question about your subscription, place label here and clip this form to your letter.
ATTACH LABEL HERE
71