Abstract. A new method for parametric defect modelling is developed for calculating the conditions for activating physical defects in the modules (for example, ...
Proc. Estonian Acad. Sci. Eng., 2001, 7, 4, 253–268
MODULE LEVEL DEFECT SIMULATION IN DIGITAL CIRCUITS Wieslaw KUZMICZa, Witold PLESKACZa, Jaan RAIKb, and Raimund UBARb a b
Warsaw University of Technology, Koszykowa 75, 00662 Warszawa, Poland; {W.Kuzmicz,W.Pleskacz}@imio.pw.edu.pl Computer Engineering Department, Tallinn Technical University, Raja 15, 12618 Tallinn, Estonia; {jaan,raiub}@pld.ttu.ee
Received 2 May 2001, in revised form 17 August 2001 Abstract. A new method for parametric defect modelling is developed for calculating the conditions for activating physical defects in the modules (for example, in library components) of digital circuits. The method affords for the first time the possibility to handle the defects which increase the number of states in the circuit. By using the concept of functional faults, the new method of defect modelling by logic conditions is generalized for hierarchical fault simulation. A method is proposed to find the types of faults that may occur in a real circuit, to determine their probabilities, and to find the input test patterns that detect these faults. A new hierarchical defectoriented fault simulation method is presented. At the higher (module) level simulation we use the functional fault model, at the lower level the defect/fault relationships in the form of defect coverage table and conditional defect probabilities. Experimental data of the hierarchical defectoriented simulation for ISCAS’85 benchmarks are presented, which show that classical stuck-at fault based simulation and the test coverage calculation, based on counting defects without considering defect probabilities, may lead to considerable overestimation of results. Key words: digital circuits, component libraries, physical defects, faults, stuck-at fault model, functional faults, defect/fault relationships, probabilistic defect analysis, defect-oriented fault simulation.
1. INTRODUCTION Testing and diagnosis of digital systems have faced a lot of problems, produced mainly by the complexity of systems. The efficiency of test generation (quality of tests, speed of test generation) depends highly on the system description and fault models. Since traditional low-level test generation methods 253
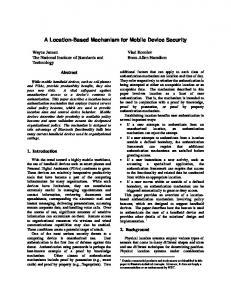
and tools for complex VLSI systems have lost their importance, other approaches based mainly on functional, behavioural, or hierarchical methods are gaining more and more popularity [1,2]. The advantage of hierarchical test generation approaches, compared to the functional ones, lies in the possibility of constructing test plans at higher functional levels and modelling faults at lower levels. Conventional low level fault modelling methods use logic gate level representations of digital circuits and stuck-at-0/stuck-at-1 fault (SAF) model. On the other hand, the SAF model which has been rather popular in estimating the test quality has not withstood the test of time. It has been shown that high SAF coverage cannot guarantee high quality of testing, for example, of CMOS integrated circuits [3–5]. The reason is that the SAF model ignores the actual behaviour of digital circuits implemented as CMOS integrated circuits, and does not adequately represent the majority of real IC defects and failure mechanisms which often do not manifest themselves as stuck-at faults. The types of faults that can be observed in a real gate depend not only on the logic function of the gate, but also on its physical design. These facts are well known [4–7], but usually ignored in engineering practice. In earlier works on layout-based test generation techniques [6,7], whole circuits, having hundreds of gates, were analysed as single blocks. Such an approach is computationally expensive and thus highly impractical as a method of generation of tests for real VLSI designs. In this study we do not follow the approaches of Nigh and Maly [6] and Jacomet and Guggenbuhl [7]. Our aim is to characterize faults in library cells, determine types of faults and their probabilities and then use this information for defect oriented fault simulation and test generation at higher levels of abstraction. This approach is based on the assumption that the majority of defects occur inside the cells and not in the routing between them. Such assumption would not be realistic in the case of older CMOS technologies with 2 levels of metal and very dense routing. However, in state-of-the-art deep submicron technologies still only 1 or 2 levels are used inside cells but 6 or more levels of metal are available for routing. More routing levels means lower sensitivity to defects. This is illustrated in Fig. 1 comparing two-level and multilevel routings in the presence of a defect which can short 2 metal lines. Routing between the cells is less dense and various nodes are routed at various metal levels. As a result, probability of shorts outside cells is significantly reduced.
a (a)
(b)b
Fig. 1. Two-level (a) vs multilevel (b) routing.
254
There are also other differences of our study from the earlier ones [6,7]. The paper by Nigh and Maly [6] concentrates on current testing. Jacomet and Guggenbuhl [7] consider traditional logic tests but assign fault types to physical defects in a rather arbitrary way. In this paper we verify functionality of analysed gates for all possible defects and find the actual functions performed, using transistor-level simulation. This characterization process may be computationally expensive, but it is performed only once for every library cell. In other words, we replace abstract fault models like SAF with realistic defect models. In [8] a new approach was introduced for hierarchical defect simulation based on defect preanalysis for components, using the results of preanalysis in higher level fault simulation. Developing these ideas, in this paper we present a new method for parametric defect modelling which enables us to handle easily also the defects which increase the number of states in the circuit. We show that the functional fault introduced in [8] can be regarded as a particular case in modelling faults (defects) by logical conditions. Then we propose a method which allows to find the types of logic faults that may occur in a real circuit, to determine their probabilities of occurrence, and to find the input test patterns that detect these faults. We compare the results obtained in this way with the results of testing the same circuits by the sequences of test patterns based on the conventional fault model. Experiments were carried out for the ISCAS’85 benchmark circuits. The paper is organized as follows. In Section 2 we present a new method of parametric fault modelling for carrying out defect analysis in digital circuits. In Section 3 we generalize this method for the purpose of bottom-up hierarchical fault simulation. Section 4 describes a differential fault simulation method, and in Section 5 the method is generalized for sequential faults. Section 6 presents the results of a probabilistic analysis of defects and relates the defects to the Functional Fault Model. In Section 7 we propose a new hierarchical defectoriented fault simulation method. Section 8 presents experimental results and gives a comparison of stuck-at fault coverage vs. defect coverages. Finally, we draw the conclusions of this research.
2. PARAMETRIC FAULT MODELLING In this section we present a new general fault model for components of digital circuits called parametric fault model which can be used for describing and modelling arbitrary physical defects that result in a violation of the logical function of a component in a digital circuit. Consider a Boolean function y = f ( x1 , x 2 , ..., x n ) implemented by an embedded component in a digital circuit. Introduce a Boolean variable d for representing a given defect in the component or in the neighbourhood of the lead y, which affects the value y by converting the Boolean function f into another function: 255
y = f d ( x1 , x 2 , ..., x n , x n +1 ... x p ).
(1)
The variables x n +1 ... x p belong to the neighbourhood function which will influence y in the presence of the defect d . For example, assume there is an AND-type short between leads x1 and x 5 in the circuit in Fig. 2. The faulty function y = f ( x1 , x 2 ) = ¬ ( x1 ∧ x 2 ) in the case of the defect d can be represented as y = f d ( x1 , x 2 , x3 , x 4 ) = ¬ ( x1 ∧ x5 ) ∨ ¬x 2 = ¬ ( x1¬ ( x3 ∧ x 4 )) ∨ ¬x 2 .
(2)
Introduce now a generalized parametric function y* = f * ( x1 , x2 , ..., xn , xn +1 , ... x p , d ) = ¬ d & f ∨ d & f d
(3)
as a function of a defect variable d , which describes the behaviour of the component simultaneously for both possible cases. For the erroneous case the value of the defect variable d as a parameter is equal to 1, and for the nonerroneous case d = 0. In other words, y* = f
d
if d = 1, and y* = f if d = 0.
(4)
The solution of the Boolean differential equation W d = ∂y * ∂d = 1
(5)
describes now the conditions (constraints) to be fulfilled for activating the fault d on a line y. For example, for the short in Fig. 2 we have y* = (¬ d ∧ f ) ∨ (d ∧ f d ) = (¬ d ∧ ¬ ( x1 ∧ x2 )) ∨ (d ∧ ¬ ( x1 ∧ ¬ ( x3 ∧ x4 )) ∨ ¬ x2 ), W d = ∂y * ∂d = x1 x 2 x3 x 4 .
x3 x4
&
(7)
x5 Short
x1 x2
&
y
Fig. 2. A short between two signal leads.
256
(6)
The parametric fault model enables us to calculate logical conditions W d by solving differential equations of the type ∂y * ∂d = 1 for arbitrary physical defects d which change the logical behaviour of the affected component. For doing that we have to create logical expressions for faulty functions f d either by logical reasoning or by carrying out directly defect simulation. The logical conditions W d for activating defects d can be used at the higher (logical or register transfer) level fault simulation or test pattern generation without paying attention to the physical reasons of defects.
3. FUNCTIONAL FAULT MODEL The method of defect modelling by logical conditions (Fig. 3) can be generalized for the purpose of bottom-up hierarchical fault simulation. A module (for example, a library component) in a circuit can be preprocessed by lower level fault simulation with the goal to generate a set of logical conditions W = {W d } for all possible lower level faults (physical defects) of the component. Each condition W d can be regarded as a higher level functional fault model for a given lower level fault (physical defect) d . To activate the defect d , we have to stimulate the module by the input pattern implied by the condition W d = 1. In the presence of the defect d , the functional behaviour of the component at the input stimuli implied by W d = 1 will be erroneous. Definition. Let us call a failed input pattern t i of a given module M (complex gate or component) a functional fault if it detects at the output of M at least one lower level fault d j in the module M . Functional fault model allows to reduce the complexity of fault modelling in the case when the number of higher level faults is less than the number of lower level faults. For example, for the ISCAS’85 benchmark circuit c17, it was possible to replace 78 lower level physical defects by only 4 functional faults. The complexity reduction in this case is 20 times. On the other hand, the functional fault model allows to process all the lower level faults by means of a higher level language. No disclosure of the internal structure of the component for modelling lower level faults is needed.
Component
Wd
F(x1,x2,…,xn)
y
Activated by Wd path
Defect Fig. 3. Functional fault model for a physical defect.
257
The input patterns t i for a given defect d j can be found either by traditional low level (for example, gate level) test generation or by parametric fault modelling and solving corresponding differential equations like in the case of physical defects as discussed in Section 2. Definition. Let us call a set of functional faults which cover all the lower level faults of the component a functional fault model of the component. In general, the functional fault model is not unique. The given set of low level faults can be covered by different high level functional faults (sets of input patterns of the module). This fact should be considered both in hierarchical fault simulation and in hierarchical test generation.
4. DIFFERENTIAL FAULT SIMULATION The method of modelling faults by logic conditions W d enables us to unify the functional level fault simulation for components of a circuit without going into structural details of the components and structural defects in the communication network between components. In both cases, the condition W d describes how a fault (either in a component or in a network) should be activated to a given node in a circuit. The conditions W d can be used both in fault simulation and in test generation. Consider a node k in a circuit as the output of a module M k and represented by a variable x k . Associate with the node k a set of faults Rk = RkF ∪ RkS , where RkF is a subset of faults in the module M k and RkS is a subset of structural faults (defects) in the “neighbourhood” of the component M k . Denote by W r the condition when the fault r ∈ R k will change the value of x k . An arbitrary erroneous change of the value of x k (denoted by dx k = 1) can be represented formally by implication dx k → ∨ (r ∧ W r ), r ∈ Rk .
(8)
All the suspected faults can now be determined by solving the equation
∨ (r ∧ W ) = 1, r ∈ R . r
k
(9)
Some examples of the conditions W r for different types of structural faults r ∈ R k (where SAF is a particular case) are given in Table 1 (here x k is the observable variable and x′ k is the variable at the previous time moment).
258
Table 1. Activating conditions for different faults Conditions W r
Fault (defect) r
No.
SAF xk ≡ 0 SAF xk ≡ 1 Short between xk and xl Exchange of lines xk and xl Delay fault on the line xk
1 2 3 4 5
xk = 1 xk = 0 xk = 1, xl = 0 xk = 1, xl = 0, or xk = 0, xl = 1 xk = 1, x′k = 0, or xk = 0, x′k = 1
For example, by using parametric fault modelling we get for the fault SAF xk ≡ 0 : x k * = ¬rf ∨ rf r = ¬rx k ∨ r & 0,
(10)
W r = ∂x k * ∂r = x k .
(11)
In such a way we should construct for each module M k of the circuit a list of faults Rk with logical conditions W r for each fault r ∈ Rk . The conditions for functional faults r ∈ RkF of the module can be found by low level test generation for the module, and the conditions for structural faults (or defects) in the neighbourhood of the module can be calculated by parametric fault modelling and solving corresponding differential equations. By the latter method, also the physical defects inside the module M k can be handled. Example. Consider the output variable y of the circuit in Fig. 2 as an output of the NAND module with the following sets of faults R F = {r1 , r2 , r3}, R S = {r4 }. The functional faults cover all SAF faults in the NAND module, and the fault r4 corresponds to the short between leads x1 and x 5 . The faults r are described in Table 2 by the following logical conditions W r : An erroneous change of the value of y can be represented formally by dy → r1¬ x1 x 2 ∨ r2 x1¬ x 2 ∨ r3 x1 x 2 ∨ r4 x1 x 2 x3 x 4 .
(12)
Table 2. Faults and their logical conditions in Fig. 2 R
R
F
RS
r
r1 r2 r3 r4
Wr
Detected SAF x1 ≡ 1 SAF x2 ≡ 1 SAF x1 ≡ 0, x2 ≡ 0 Short between x1 and x5
x1
x2
x3
x4
0 1 1 1
1 0 1 1
– – – 1
– – – 1
259
For the input vector 1010 we have dy → r2 which means that at this pattern a fault r2 is detected on the output y.
5. MODELLING SEQUENTIAL FAULTS Let us call the faults which increase the number of states in the circuit sequential faults. The method for modelling faults by logical conditions W r enables us to attack the problem of testing faults which convert combinational circuits into sequential ones or which increase the number of states in sequential circuits. To the knowledge of the authors, test generators or fault simulators which are able to work with such faults are missing. Let us consider an example of calculating the activation conditions W r for the case when a short r between two leads in a combinational circuit converts the circuit into a sequential one (Fig. 4). A generalized function for the initial circuit with a potential short r between lines x 2 and y is as follows: y* = ¬ r ( x1 x 2 ∨ ¬ r3 ) ∨ r ( x1 x 2 y′ ∨ ¬x3 ) = x1 x 2 (¬ r ∨ y′) ∨ ¬x3 .
(13)
The conditions to be fulfilled for activating the fault r can be calculated by solving the Boolean differential equation W r = ∂y * ∂r = x1x2 x3¬y′ = 1,
x1
&
x2
&
(14)
y
x3 x1 x2
&
&
&
y
x3
Fig. 4. A short converts a combinational circuit into a sequential one.
260
which gives x1 = x2 = x3 = 1 and y′ = 0 , where y′ means the value of y that belongs to the previous time moment. This example shows that the conditions for activating a fault may be spread over different time moments. The same we can notice also for the conditions for activating delay faults in Table 1.
6. PROBABILISTIC FAULT MODEL FOR CMOS GATES In the following we consider one kind of physical defects in CMOS gates – shorts between conducting regions. This is one of the most important sources of faults in CMOS digital circuits. However, the method can be extended to other types of physical defects as well (for example, to breaks). A short is a piece of extra conducting material that connects a pair of separate conducting regions in the integrated circuit [9]. This affects the connectivity of the circuit – two separate electrical nodes become connected. It is obvious that probabilities of shorts depend on the layout of the circuit. Conducting regions that are adjacent to one another are more susceptible to shorts than regions that are separated by a large distance. We assume that every defect that results in a short can be approximated by a circle. To estimate the probabilities of shorts between pairs of nodes, we use the concept of critical area for shorts [5,9]. The critical region for shorts is such a region in the circuit that if the centre of a defect of a given radius R is located anywhere inside the critical region, a short between two adjacent conducting regions occurs. The critical area is the area of the critical region. It depends on the shapes and locations of the conducting regions that can be shorted and is a function of the defect radius R. The radii of defects are random and can be characterized by a probability density function Pdf (R ) which is specific for a given manufacturing process and given conducting layer. We assume that the probability of a short between a pair of conducting regions, that correspond to a pair of electrical nodes, is proportional to the critical area for these two regions. The critical area for shorts is a function PS (R ) of the defect radius R. Since the defect radii exhibit a random distribution, the product Pdf ( R ) × PS ( R ), integrated over the range of R where PS ( R ) > 0, can be taken as the measure of the total probability of shorts between a given pair of nodes Pt = ∫ PS ( R ) Pdf ( R ) dR.
(15)
The first step in the identification of logic faults and their probabilities is to calculate Pt for all pairs of conducting regions representing electrical nodes. If for a given pair Pt = 0, this pair of nodes cannot be shorted and is not taken into account. For the pairs that can be shorted, the logic faults are determined. In simple cases this can be done by inspection of the circuit. For example, it is obvious that a short between an output node and VDD results in “stuck-at-1”
261
fault at this node. In more complex cases it may be necessary to simulate operation of the faulty circuit at the transistor level by SPICE. In our simulations shorts were represented by resistors. We tried several resistance values in the range from 0.01 to 200 Ω. The gate behaviour at the logic level did not depend on this resistance. The waveforms obtained from the simulation enables us to determine the actual logic function performed by the faulty circuit. In this way, the functional faults that result from shorts are identified and their probabilities are determined. This procedure and the software developed for this purpose are described in greater detail elsewhere [10]. Table 3 shows the distribution of the probabilities of various types of functional faults for a complex 4 input gate AN1 performing the NOR(AND(A,B),AND(C,D)) function. This gate is from an industrial standard cell library in 0.8 µm CMOS technology. Table 3. Probabilities of AND-type shorts in the complex gate AN1 and the fault table i
Fault di
Erroneous function f
1 2 3 4 5 6 7 8 9 10 11 12 13 14 15 16 17 18 19 20 21 22 23 24 25 26 27 28
262
Pi
di
3,1215E-07 not detected not(A*C*(B+D)) 3,1100E-07 not(A*D*(B+C)) 1,1940E-07 not(B*(not(A)+ 4,9059E-08 C+D)+C*D) A/Q not(not(A)+C*D) 6,9159E-08 A/gnd not(C*D) 2,6895E-08 A/vdd not(B+C*D) 1,9847E-08 B/C not(B*C*(A+D)) 1,0477E-07 B/D not(B*D*(A+C)) 5,7931E-08 B/N1 not(A+C*D) 5,2930E-08 B/Q not(not(B)+C*D) 3,3912E-08 B/gnd not(C*D) 4,6466E-08 B/vdd not(A+C*D) 1,8972E-08 C/D 3,7309E-07 not detected C/N1 not((A+B+D)* 3,9147E-08 (A*B+not(C)+D)) C/Q not(not(C)+A*B) 9,1480E-08 C/gnd not(A*B) 1,9862E-08 C/vdd not(D+A*B) 1,4727E-08 D/N1 not((A+B+C)* 2,7604E-08 (A*B+C+not(D))) D/Q not(not(D)+A*B) 2,0036E-07 D/gnd not(A*B) 2,1443E-08 D/vdd not(C+A*B) 9,9504E-09 N1/Q not(A+B) 1,3697E-07 N1/gnd SA0 for Q 8,4883E-09 N1/vdd not(C*D) 2,1532E-07 Q/gnd SA0 for Q 1,0145E-07 Q/vdd SA1 for Q 3,5661E-08 gnd/vdd not detected 4,2536E-09
Input patterns tj 0 1 2 3 4 5 6 7 8 9 10 11 12 13 14 15
A/B A/C A/D A/N1
none 1 1
1 1 1 1 1
1
1 1
1 1 1
1 1 1
1
1 1
1 1
1 1
1
1 1
1 1
1 1
1
1
1
1
1
1
1
1 1
1 1 1 1 1 1
1 1
1 1
1 1 1 1 1 1
1
1 1 1 none 1 1
1 1
1
1
1 1 1 1 1 1 1 1 1 1 1 1 1 1 1 1
1 1
1
1 1
1
1 1 1 1 1 1 1 1 1 1 1 1 1 1 1 1 1 1 1 1 1 1
1
1 1
1 1 1 1
1
1
1 1 1 1
1 none
1
Usually the most time-consuming part of the characterization process is the identification of the logical faults that correspond to shorts. If the number of possible shorts is large and operation of the faulty cell is not obvious for most of them, it is necessary to perform many circuit simulations. This is time-consuming and difficult to automate. Hence, the complexity of the characterization process depends mainly on the number of physically possible shorts in the characterized cell and the complexity of the cell function. In practice it may take from several hours to several days to characterize a single cell. However, this process is performed only once for every library cell.
7. MULTI-LEVEL FUNCTIONAL FAULT SIMULATION To reduce the amount of work for calculating the defect coverage by fault simulation, we present a system on three levels: defect, logical, and register transfer levels. The multilevel functional fault simulation is carried out as follows (Fig. 5): – on the defect level we relate the physical defects of complex gates to the functional fault model by fixing which defects are detected by which input pattern of the gate; this information is stored in the library fault tables; – on the logical level we check if the functional faults of the given gate are activated and propagated to the output of the given module; – on the RTL level we check if the erroneous signals caused by defects are propagated from the outputs of modules to an observable point of the system. Formally, if Y is the system variable representing an observable point of the system, yM is an output variable of a gate level module, and yG is the output of a complex gate with a physical defect d , then the condition to detect the defect d on the observable test point Y of the system is Wd ,Y = ∂Y ∂yM ∧ ∂yM ∂yG ∧ Wd = 1,
Functional fault detected
Functional fault activated
High-level simulation
d
Q Physical defect analysis
Defect
yG
Q
(16)
Q yM
Complex gate
Y
High-level fault analysis
Gate-level simulation
Module
Gate-level fault analysis
System Fig. 5. Hierarchical defect-oriented fault simulation.
263
where ∂Y ∂yM is the Boolean difference calculated by the high-level simulation, ∂yM ∂yG is the Boolean difference calculated by the gate-level simulation, and Wd is the functional fault condition found by the complex gate preanalysis. The relationships between the functional faults ti and the defects d j for all the gates g in the library L are given by defect tables DTg = || dij || , g ∈ L, where an entry d ij = 1 means that the input pattern t i of the gate detects the defect d j , otherwise d ij = 0. Let D g be a set of defects in the gate g ∈ L. Then for each gate g ∈ L we create a set of probabilities Pg where each entry p j ∈ Pg means the conditional probability of a defect d j ∈ Dg in the condition that a defect is present in the system. A hierarchical two-level defect oriented fault simulation technique is proposed which consists of the following two steps: – gate-level stuck-at fault simulation with the goal of creating a fault table for stuck-at faults of a gate-level circuit, – defect-oriented functional fault simulation with the goal of fixing the subsets of defects detected in all the gates of the given circuit. On the first step, for a given module a fault table FT = || tij || is created for the stuck-at faults x j ≡ e, e ∈{0,1} at the outputs of complex gates g j , where an entry tij = e means that a test pattern Ti of the circuit detects the fault x j ≡ e, otherwise tij = X , where X means don’t care. On the other hand, each entry tij ∈ {0,1} in FT means that a functional fault t i of the gate g j is detected on its output x j . On the second step, for each tij in the fault table FT , a subset of defects Dg , j (ti ) ⊂ Dg , j will be fixed for the gate g j , detected by the test pattern Ti by the following operation: Dg , j (ti ) = {d k (dik = 1) & (ti ⊂ Ti )},
(17)
where ti ⊂ Ti means that the test pattern Ti includes the input pattern t i of the gate g j . This operation defines a subset of defects, where for each defect d k the following two conditions should be fulfilled: d ik = 1 and ti ⊂ Ti . In other words, the defect d k is detected at the output of the gate g j only if the condition t i activates the defect (d ik = 1), and the current pattern Ti covers the condition ti (ti ⊂ Ti ). The described multilevel functional fault simulation was used for estimating the quality of 100% stuck-at test patterns in detecting physical defects in CMOS gates.
264
8. EXPERIMENTAL RESULTS The purpose of the experiments was to compare the quality of 100% stuck-at test sets in relation to physical CMOS defects for the family of ISCAS’85 benchmark circuits. For carrying out the experiments we used the data produced by probabilistic analysis of the physical defects of the AN1 = NOR(AND(A,B),AND(C,D)) gate, and resynthesized the ISCAS’85 circuits trying to use as much as possible this complex gate. Let D be a set of physical defects under consideration. The 25 defects d ∈ D of the complex gate AN1 are listed in Table 3 together with the erroneous functions f d . A, B, C, and D are the inputs of the gate, Q is the output, and N1 is an internal node of the gate. All the defects covered by each input pattern of the gate are marked by 1. For every defect d i the probability Pi is given. To calculate the probabilistic defect coverage we use the conditional defect probabilities p i for every defect d i (the probability of a particular defect d i on condition that a defect from D is present), which are calculated as pi =
Pi 20
∑ Pj
(18)
.
j =1
To investigate the correlation between fault coverages for stuck-at faults and the defects in D, we generated at first test patterns with 100% stuck-at fault coverage (Table 4). Defect-oriented fault simulation was carried out hierarchically in two steps. At first, at the higher level, for each complex gate the functional fault coverage was calculated. Then, at the lower level, the real defect coverage for the whole circuit, based on functional fault coverages for components and on the data in Table 3, was calculated. The computed fault coverages for the parts of circuits consisted only of the complex gates AN1 and are depicted in Table 5.
Table 4. Data of the resynthesis and test generation Circuit c17 c432 c499 c880 c1355 c1908 c3540 c5315 c6288
Total No. of gates
No. of complex gates
No. of test patterns
6 152 356 293 318 245 613 1035 2547
1 12 108 53 108 70 124 353 11
6 67 96 60 104 69 228 127 62
265
Table 5. Data of defect-oriented fault simulation Circuit
Defect cover, % OR-type shorts
c17 c432 c499 c880 c1355 c1908 c3540 c5315 c6288
AND-type shorts
Denumerated defects
Probabilistic defects
Denumerated defects
Probabilistic defects
92.59 99.38 92.80 95.95 93.42 92.91 94.21 94.71 92.59
91.10 98.78 85.76 91.98 87.83 85.98 89.98 91.14 85.35
100.0 99.33 100.0 100.0 100.0 99.94 99.68 100.0 100.0
100.0 98.97 100.0 100.0 100.0 99.94 99.60 100.0 100.0
It was not surprising that the 100% stuck-at fault tests could not achieve the 100% defect coverage. The main goal of the paper is to present a tool for efficient calculation of the defect coverage for given test sets. By this tool it was possible to show quantitatively the real quality of given test sets expected to have 100% quality. A new result is also demonstration that the difference between stuck-at fault and physical defect coverages is higher when the defect probabilities are taken into consideration, compared to the traditional method where all faults are assumed to have the same probability. 9. CONCLUSIONS A new hierarchical defect modelling method has been developed and implemented as a tool which combines a parametric low-level defect modelling and higher level differential fault simulation. In this method, we use the new functional fault model developed for representing defects on the higher level, and the fault-to-defect mapping in the form of the defect coverage table. In this method, the conditional probabilities of defects can be also used in the probabilistic defect coverage calculation. A probabilistic analysis of CMOS physical defects has been carried out for generating input data for stuck-at-fault test quality estimation. Based on these data, it has been shown that the classical test coverage calculation, based on simple counting of the detected and not detected defects without taking into account the defect probabilities, may lead to considerable overestimation of the real quality of test sets for CMOS circuits.
266
ACKNOWLEDGEMENTS This work was supported by EC Copernicus project VILAB, Estonian Science Foundation grants No. 3658 and 4003, and Polish State Committee for Scientific Research, project No. 8 T11B 006 16.
REFERENCES 1. Rao, S. R., Pan, B. Y., and Armstrong, J. R. Hierarchical test generation for VHDL behavioral models. In Proc. European Design Automation Conference. Paris, 1993, 175–183. 2. Rudnick, E. M., Vietti, R., Ellis, A., Corno, F., Prinetto, P., and Sonza, Reorda M. Fast sequential circuit test generation using high-level and gate-level techniques. In Proc. Design Automation and Test in Europe Conference. Paris, 1998, 570–576. 3. Soden, J. M. and Hawkins, C. F. Quality testing requires quality thinking. In Proc. International Test Conference. Baltimore, 1993, 596. 4. Maly, W., Shen, J. P., and Ferguson, J. Systematic characterization of physical defects for fault analysis of MOS IC cells. In Proc. International Test Conference. Philadelphia, 1984, 390– 399. 5. Shen, J. P., Maly, W., and Ferguson, J. Inductive fault analysis of MOS ICs. IEEE J. Design Test., 1985, Dec, 13–26. 6. Nigh, P. and Maly, W. Layout-driven test generation. In Proc. International Conference on Computer-Aided Design. Santa Clara, 1989, 154–157. 7. Jacomet, M. and Guggenbuhl, W. Layout-dependent fault analysis and test synthesis for CMOS circuits. IEEE Trans. CAD, 1993, 12, 888–899. 8. Blyzniuk, M., Cibakova, F. T., Gramatova, E., Kuzmicz, W., Lobur, M., Pleskacz, W., Raik, J., and Ubar, R. Hierarchical defect-oriented fault simulation for digital circuits. In IEEE European Test Workshop. Cascais, Portugal, 2000, 151–156. 9. Maly, W. Modeling of litography-related yield losses for CAD in VLSI circuits. IEEE Trans. CAD, 1985, 4, 166–177. 10. Blyzniuk, M., Pleskacz, W., Lobur, M., and Kuzmicz, W. Estimation of probability of different functional faults caused by spot defects in VLSI circuits. In Proc. International Conference on Modern Problems of Telecommunications, Computer Science and Engineers Training. Lviv-Slavsko, Ukraine, 2000, 47–49.
DIGITAALSKEEMIDE DEFEKTIDE SIMULEERIMINE MOODULTASANDIL Wieslaw KUZMICZ, Witold PLESKACZ, Jaan RAIK ja Raimund UBAR On välja töötatud uus parameetriline defektide modelleerimise meetod füüsikaliste defektide aktiviseerimistingimuste arvutamiseks digitaalskeemides. See võimaldab esmakordselt käsitleda defekte, mis suurendavad skeemi olekute arvu. Uue meetodi üldistusena on loodud hierarhiline rikete simuleerimise kontseptsioon. Elektronskeemide füüsikaliste defektide defineerimiseks ja modelleerimiseks, nende tõenäosuste arvutamiseks ja vajalike loogikatingimuste leidmiseks defektide testimise ja avastamise eesmärgil on esitatud simuleerimisel põhinev meetod. Moodulite (skeemikomponentide) tasemel on kirjeldatud ja realiseeritud 267
uus hierarhiline defektide simuleerimise meetod. Kõrgematel simuleerimistasanditel (moodulite simuleerimisel) on kasutatud funktsionaalset defektide mudelit, madalamal (elektrilisel) tasandil aga füüsikaliste defektide projektsiooni loogikarikete hulgale (defektide tabeli kujul) ning defektide tingimuslikke tõenäosusi. Eksperimentide tulemused rahvusvaheliste ISCAS’85 standardsete katseskeemide defektide hierarhilise simuleerimise kohta näitavad, et klassikaline loogikakonstantidel põhinev rikete simuleerimise meetod ja traditsiooniline defektide tõenäosuste ignoreerimine ehk lihtsustav võrdsustamine põhjustavad simuleerimistulemuste süstemaatilist ülehindamist.
268