IEEE SENSORS JOURNAL, VOL. 15, NO. 11, NOVEMBER 2015
6255
Monitoring the Fermentation Process and Detection of Optimum Fermentation Time of Black Tea Using an Electronic Tongue Arunangshu Ghosh, Anil Kumar Bag, Prolay Sharma, Bipan Tudu, Santanu Sabhapondit, Binoti Devi Baruah, Pradip Tamuly, Nabarun Bhattacharyya, and Rajib Bandyopadhyay
Abstract— This paper presents a new methodology to monitor the fermentation process and detect the optimum fermentation time of crush tear curl black tea with a voltammetric electronic tongue. An electronic tongue with an array of five noble metal working electrodes has been developed for this purpose. A suitable large amplitude pulse voltammetric waveform has been employed for probing the chemical changes in tea samples under fermentation. Good correlation between the electronic tongue responses and the biochemical changes has been obtained by principal component analysis (PCA) during various stages of fermentation. The electronic tongue fermentation profile has been derived from PCA analysis and it is observed that such a profile enables detection of optimum fermentation times. Finally, a model based on partial least squares regression technique has been developed for real-time indication of fermentation level. The optimum fermentation times observed from the electronic tongue fermentation profiles derived from PCA and partial least squares regression correlate by a factor of 0.97 and 0.96, respectively, with the reference values obtained from an ultraviolet-visible spectrophotometer-based instrumental analysis. Index Terms— Black tea, voltammetric electronic tongue, principal component analysis, partial least squares regression.
I. I NTRODUCTION
T
HE production of finished black tea from freshly plucked green leaves involves several crucial time dependent stages such as withering, rolling, crush-tear-curl (CTC), fermentation, drying and sorting. Out of these stages, fermentation is one of the most important stages of tea processing; the duration of which significantly affects the quality of
Manuscript received June 23, 2015; revised June 23, 2015; accepted June 26, 2015. Date of publication July 13, 2015; date of current version August 26, 2015. This work was supported in part by the University Grants Commission and in part by the Department of Science and Technology, Government of India. The associate editor coordinating the review of this paper and approving it for publication was Prof. Julian C. C. Chan. A. Ghosh, P. Sharma, B. Tudu, and R. Bandyopadhyay are with the Department of Instrumentation and Electronics Engineering, Jadavpur University, Kolkata 700098, India (e-mail:
[email protected];
[email protected];
[email protected];
[email protected]). A. K. Bag is with the Department of Applied Electronics and Instrumentation Engineering, Heritage Institute of Technology at Kolkata, Kolkata 700107, India (e-mail:
[email protected]). S. Sabhapondit, B. D. Baruah, and P. Tamuly are with the Department of Biochemistry, Tocklai Tea Research Institute, Jorhat 785008, India (e-mail:
[email protected];
[email protected]). N. Bhattacharyya is with the Centre for Development of Advanced Computing, Kolkata 700091, India (e-mail:
[email protected]). Color versions of one or more of the figures in this paper are available online at http://ieeexplore.ieee.org. Digital Object Identifier 10.1109/JSEN.2015.2455535
finished tea [1]. The fermentation of black tea is an endogenous phenomenon of enzyme-mediated oxidation of polyphenolic substances present in tea leaves [2]. The chemical changes pertaining to fermentation commences as soon as the leaf is macerated during rolling/rotor-vane stages and proceed rapidly during the exhaustive leaf maceration brought about by the CTC process. The precursors for quality attributes, i.e. the polyphenolic substances, are contained within the vacuoles of the intact cells of the tea shoots, while the important oxidative enzymes - polyphenol oxidase (PPO) and peroxidase (PO) remain associated with the chloroplast. The rupture of fragile vacuolar membranes caused by rolling and CTC results the diffusion of polyphenols into the cytoplasm for subsequent oxidation aided by the enzyme PPO. The process of enzymatic oxidation is initiated with the primary oxidation of phenolic substances to quinones. The quinones being subsequently converted to a number of new phenolic compounds result in considerable qualitative and quantitative changes in the biochemical constituents of the processed tea leaves. Polyphenolic substances especially Catechins, undergo significant chemical transformations of condensation and polymerization, lead to the formation of pigmenting compounds, the theaflavins (TF) and thearubigins (TR) [3]. These compounds are responsible for the desirable taste and colour of the black tea liquor. The extent of fermentation thus bears a profound impact on the quality of finished tea. In fact, it is established that under-fermented tea produces harsh and raw liquor while an over fermented tea is mostly dull with very little briskness [4]. Hence it is essential that the tea fermentation process be monitored and that the termination of tea fermentation process occurs at an optimum level for maximizing the taste of tea liquor. Tea industries rely on the human perceptions of vision and olfaction to monitor the fermentation process of tea. In this approach, evolution of colour and aroma of tea samples are repeatedly monitored by experts to assess the degree of fermentation. It is observed that the colour of tea leaves changes distinctively from green to coppery brown as the fermentation proceeds, while the aroma changes from grassy to sweet floral. However, such distinctness of colour and aroma decreases while the fermentation approaches optimum point, making organoleptic evaluations more difficult. Hence, the human sensory approach has obvious limitations in terms of accuracy and reproducibility. Moreover, the organoleptic
1530-437X © 2015 IEEE. Personal use is permitted, but republication/redistribution requires IEEE permission. See http://www.ieee.org/publications_standards/publications/rights/index.html for more information.
6256
methods require stringent measures of quality control. Tea scientists apply modern and expensive instrumental techniques like colorimetry, spectrophotometry, gas-chromatography, liquid chromatography, etc for the insights of the chemical composition of tea extracts to estimate the optimum fermentation duration. Though instrumental methods produce more reliable results but, they require long analysis time and critically elaborate operating procedures those limit their use when quick analysis is desirable. So far, few research reports describe the use of analytical instrumental methods for monitoring the tea fermentation process. Real time tea fermentation monitoring was carried out using mass-spectrometry [5]. Gas chromatography-mass spectrometry (GC-MS) analysis of fermented oolong tea samples was reported in [6]. The applicability of rapid measurement instruments like an electronic nose was also explored for this purpose. The electronic nose revealed its potential for monitoring tea fermentation process in real time. Recently, classification of finished tea samples with different degrees of fermentation was reported with an odour imaging sensor array [7]. The onset of optimum fermentation was predicted by an electronic nose for preemptive termination of tea fermentation process [8]. The feasibility of using an electronic nose for tea fermentation monitoring was established in [9]. Electronic tongue (E-Tongue), an instrument used extensively for rapid detection of physical and chemical characteristics of many samples, had been successfully employed in numerous applications like, classification of beers [10], evaluation of fish freshness [11], classification of wines [12], detection of storage times of pasteurized milk [13], classification of yogurts [14], estimation of polyphenol content in beer [15] and monitoring the quality of water [16]. Reports of researches are available regarding the application of electronic tongue for tea samples. A voltammetric electronic tongue was used for the detection of key compounds in tea liquor [17], [18] and classification of tea samples [19]–[21]. Electronic tongue was used to monitor the degree of fermentation in various kinds of food. A hybrid electronic tongue based on the principles of potentiometry, voltammetry and conductivity was used to classify various grades of fermented milk [22]. A potentiometric tongue was used for off-line monitoring of batch Escherichia coli fermentations [23]. It was reported that the electronic tongue responded towards increasing the amount of biomass and also followed the evolution of organic acids in the growth media. A potentiometric tongue was used to monitor the extent of fermentation of the starting culture for light cheese production process. Both qualitative as well as quantitative detections were possible with the use of a potentiometric electronic tongue [24]. An electronic tongue was shown to be effective for quantitative and multi-component analysis of fermented media in presence of interfering chemicals [25]. The fermentation degree of beer was detected by an electronic tongue and the response of electronic tongue correlated with the actual degree of fermentation [26]. It was demonstrated in [27] that electronic tongue was suitable for monitoring the must-wine fermentation process. The response of electronic tongue was reported to have generated crucial information
IEEE SENSORS JOURNAL, VOL. 15, NO. 11, NOVEMBER 2015
about the quality of final product and had correlated well with the results of chemical analyses. A hybrid electronic tongue with polymeric elements and thin film deposited voltammetric electrodes was used to monitor the extent of fermentation in beer [28] and the responses of this electronic tongue had been observed to be well differentiated according to the degree of fermentation. The above literature survey indicates that different types of electronic tongues have been used to monitor the chemical changes pertaining to the fermentation of samples from natural sources. This paper reports a study regarding the applicability of a voltammetric electronic tongue to monitor the fermentation process of black CTC tea and subsequently reports the optimum fermentation time (OFT) observed from the detected fermentation profiles. The significance of such a study lies in the fact that it will not only lead to an alternative technique for monitoring the chemical changes taking place in a tea sample but will also help to ascertain the quality of finished tea during the processing stage itself. The electronic tongue has been employed to study the chemical changes in the extracts of twenty two different tea samples under fermentation. The reference method for the detection of optimum fermentation time entails the study of theaflavins produced during the fermentation process, as the theaflavins are most important compounds contributing to the taste of tea. The multivariate electronic tongue response was subjected to principal component analysis (PCA) to derive the electronic tongue fermentation profile (ET-ferm. profile). The reference OFT values were observed from the TF profile and compared with those obtained from ET-ferm. profile. Partial least squares regression (PLSR) model was then developed to predict the ET-ferm. profiles of unknown tea samples for subsequent monitoring and estimation of OFT from those samples for real time applications. The paper is organized as follows. The experimental procedures are presented in section II. Data analysis methods are described in section III and the results are presented in section IV. II. E XPERIMENTAL A. Sample Preparation Twenty two CTC tea samples were collected from experimental gardens of Tocklai Tea Research Institute, Tea Research Association, Assam, India. The samples were selected based on the parameters that significantly affect the OFT of tea samples i.e. the catechin content and the activities of enzyme PPO. The nomenclature of sample name has been presented as clone name_plucking date. The chosen tea samples were then subjected to tea processing stages. First, the freshly plucked green tea leaves were withered for 12-14 hours at 25-28 °C. The withered tea leaves were then passed through rotorvane stage followed by maceration in CTC machine. After that, finely cut tea leaves were kept in trays in an environment controlled chamber for 80-90 minutes for fermentation. The environment of the chamber was maintained at a temperature of 30±1 °C and a relative humidity of 93±2%. Collection of tea samples
GHOSH et al.: MONITORING THE FERMENTATION PROCESS AND DETECTION OF OPTIMUM FERMENTATION TIME
for biochemical and electronic tongue analysis started after 30 min from the commencement of fermentation process and continued beyond the OFT. Sample collections were carried out initially at an interval of 10 min and later reduced to 5 min when the degree of fermentation approaches the optimum value. The number of samples collected from each batch thus varied with the OFT.
6257
total current response. A stainless steel counter electrode along with an Ag/AgCl reference electrode (saturated KCL, Gamry Instruments Inc., USA) was used. A multi-electrode potentiostat based on three electrode principle was developed for applications with tea samples. The pulse parameters i.e. pulse amplitude sequence and pulse width, circuit parameters i.e. gain and time constant of input filters were systematically optimized after extensive experiments with tea samples.
B. Detection of Optimal Fermentation Time by the Reference Method Based on TF Concentrations
D. The Electronic Tongue Experimental Procedure
Monitoring the concentration of quality compounds in tea, which evolve during the process of fermentation, had been used by the tea scientists to estimate the degree of oxidation. As discussed earlier, the desirable cup characteristics of tea are brought about by a series of reactions leading to the formation of pigmenting chemicals, TF and TR. This work considers theaflavins as a chemical marker of fermentation level, since these are the major contributors of desirable qualities to tea. As a reference method, the progress of fermentation had been monitored by observing the formation of total TF using an Ultra-Violet-Visible spectrophotometer [29]. Eighteen grams of fermented CTC tea leaves were taken in a thermo flask and 250 ml boiling water was added to it. The tea was allowed to infuse for 10 minutes with intermittent shaking. It was then filtered through cotton into a conical flask to obtain the water extract of tea or tea infusion and allowed to cool at room temperature. Six ml water extract of tea infusion was then taken into a separating funnel and an equal amount of 1% (w/v) di-sodium hydrogen phosphate along with 10 ml ethyl acetate was added to it. The mixture was shaken vigorously for 1 minute. On separation of two phases, the bottom layer was drained off and the ethyl acetate extract containing the TF fractions was diluted to 15 ml with ethyl acetate. 10 ml of ethyl acetate extract was taken in a 25 ml volumetric flask and made up to the volume with methanol. A reference solution for setting the reference point of the instrument was then prepared by mixing 10 ml ethyl acetate with 15 ml methanol. The absorbance optical density (OD) of the sample solution was then recorded using a spectrophotometer model “Cary 50 UV-VIS Spectrophotometer” at 380 nm to estimate TF [29]. It is known that, while the fermentation continues, the concentration of TF increases until it reaches an optimum value and decreases thereafter. The time at which peaking of TF occurs; is associated with the OFT [30]. In this paper, reference values of OFT were assessed from the instrumental estimations of TF at each fermentation instant and subsequently observation of TF-peaks led to the identification of reference OFTs.
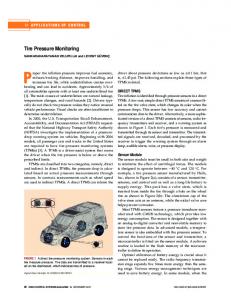
Eighty ml water extract of fermented tea leaves was considered for analysis with the electronic tongue. The tea liquor was divided into four equal portions of 20 ml. Each 20 ml portion was presented to the electronic tongue and 5 replicated readings were collected. Samplings at each fermentation instants thus yielded 20 data points. The number of observations collected for each tea sample also depended on the number of fermentation points for that sample (For example, if the sampling instants had been 40 min, 45 min, 50 min, 55 min, 60 min, 65 min, 70 min, 80 min and 90 min relative to start of fermentation process, then the number of observations collected for those nine instants should be 9 × 20 = 180). In order to minimize the electrode drift, the electrodes were polished with a grade 1500 emery paper and cleaned between sample replacements in an ultrasonic bath for 4 min at room temperature. In this experiment, large amplitude pulse voltammetry (LAPV) was used. The choice of LAPV was motivated by the fact that it produced better discrimination among tea samples [20]. LAPV voltage ranging from −0.9 to +0.9 V was applied at an increment of 0.1 V. This voltage range was decided depending upon the results of cyclic voltammetry on tea samples. A wider voltage range was adopted to ensure that the redox peaks of all the electrodes were accommodated. All the experiments were performed at room temperature. 1480 data points were collected from the current response of each of the five electrodes and thus 7400 points constituted a complete waveform. The size of data matrix for the above mentioned tea sample considered as an example should be 7400 × 180. The LAPV waveform used and the current response obtained from the electronic tongue are presented in Fig. 1(a) and 1(b). Three features extracted from each response pulse i.e. current at the end of response pulse, maximum value of current within a pulse and the time constant of pulse roll-off were recorded from each of the 36 LAPV response pulses per electrode. The extracted features set thus consisted of 540 (3 features × 36 response pulses × 5 electrodes = 540) features per waveform.
C. The Voltammetric Electronic Tongue A working electrode array of five different noble metals - gold, iridium, palladium, platinum, and rhodium was used in this study. The electrodes were circularly arranged around the reference electrode with a radius of 12 mm. This was done to reduce the effect of solution resistance as compared to the currents due to redox reactions on the
III. DATA A NALYSIS A. Principal Component Analysis (PCA) The PCA on electronic tongue dataset transforms the data into information rich features arranged in decreasing order of variance out of which two or three dominant features may be selected for operation in lower dimensions. The PCA involves projecting the input data set on the orthogonal axes, which are
6258
IEEE SENSORS JOURNAL, VOL. 15, NO. 11, NOVEMBER 2015
Fig. 2.
Fig. 1. (a) The applied LAPV waveform. (b) The current response obtained from different electrodes.
aligned along the direction of increasing variance in the input data set. The data obtained from the multiple electrode array of the voltammetric electronic tongue had been subjected to PCA after the feature extraction step. The PCA step is the most crucial as it had been used to derive the ET-ferm. profile from the multivariate response dataset obtained from electronic tongue analysis. B. Partial Least Squares Regression (PLSR) The batch information processing nature of PCA that was used to derive the ET-ferm. profile of tea samples became prohibitive when real time indications were desired. PLSR technique was then used to model the ET-profiles of unknown tea samples to assess the real time applicability of the method described in this work. The features extracted from electronic tongue response and the ET-ferm. profile values derived from PCA analysis was used to develop a model that predicted scalar values, bearing close association with the fermentation profile obtained from the PCA, at each fermentation instant for independent samples. Such a model was expected to facilitate real-time visualization of the electronic tongue response at each fermentation time and subsequent identification of the optimum fermentation point from the profile plot itself. In this work, a PLS model had been developed to predict the ET-ferm. profile of independent tea samples. Leave one out cross-validation procedure had been adopted to test the efficacy of the developed model. IV. R ESULTS AND D ISCUSSIONS A. Principal Component Analysis (PCA) The objective of PCA analysis has been to check whether the developed electrode system could sense the evolution of
PCA plot for sample Tinali_18072013.
reactive species during fermentation process while generating response clusters. Subsequently, it is also intended to observe the variations among responses to realize detection of optimum fermentation time. Towards the first objective, PCA score plot of a sample, Tinali_18072013 is presented in Fig. 2. The feature values were range normalized before being subjected to PCA analysis in order to normalize the effects of high valued features like maximum current as compared to subtler ones like the time constants of pulse roll-off. It may be noted from the PCA plot that the first two principal components, PC1 and PC2 cumulatively contribute to 89% of the total variance. The response clusters are noticeable at different fermentation instants. The data points in the PCA plot follow a definite trend; it may be observed that the clusters corresponding to 40 – 60 min of fermentation have larger separations among themselves. Such a behavior corresponded with the observation that the rate of reaction was higher at the initial part of fermentation process and became slower once the OFT passed. B. Derivation of the Electronic Tongue Fermentation Profile for Detection of OFT In order to observe the variation in electronic tongue response with respect to the concentration of TF estimated (by the reference method) at different instants of fermentation, the PC1 projection values corresponding to a given fermentation instant were averaged over replicated trials and plotted, after being normalized between 0 to 1, with respect to fermentation time along with the estimated TF values. Such a profile plot has been presented for sample Tinali_18072013 in Fig. 3. It may be observed that there is a covariance between the TF profile (red-boxes) and the electronic tongue fermentation profile (blue-circles) values. The high value of TF at 60 min corresponds to the optimum colour and taste formation indicating the optimum fermentation point. The concentration of TF steadily declined after 60 min due to its conversion into other compounds, indicating over-fermentation and loss of desirable properties of tea. On the other hand, electronic tongue fermentation profile also displays high values at the initial stages of fermentation as it sensed some intermediate orthoquinones in green tea leaves those lead to TF formation at later stages. While the concentration of these intermediate
GHOSH et al.: MONITORING THE FERMENTATION PROCESS AND DETECTION OF OPTIMUM FERMENTATION TIME
6259
Fig. 3. A typical electronic tongue fermentation profile of sample Tinali_18072013 derived from PCA analysis. The fermentation profile of most of the other samples was observed to retain such a nature.
compounds decreased due to their conversion into TF and the concentration of newly formed TF increased, the crest at 55 min (point A in Fig. 3) corroborates with the instant when the opposing effects of these two processes on working electrode currents reached equilibrium. It is after this crest at 55 min that the ET-ferm. profile follows the variation in TF concentrations. The characteristic peak at 60 min (point B) is markedly apparent in the ET-ferm. profile indicating optimal formation of TF and quality. The rapid degradation in feature values (point C) due to the conversion of TF into other compounds leading to poor quality of tea is also notable after the optimum fermentation instant at 60 min. The PCA analysis thus indicates that the variations obtained in the electronic tongue responses were determined by the physico-chemical changes taking place in the tea sample during fermentation. The electronic tongue fermentation profiles had been derived for other samples from PCA analysis and the profiles of all the samples exhibited a characteristic peak around the optimum fermentation time. The peak near OFT was observed to be characterized by the following properties: 1) Was preceded by a crest in electronic tongue fermentation profile corresponding to the conversion of intermediate orthoquinones into TF. 2) Was followed by a rapid decline in feature values corresponding to decrease in TF due to its conversion into other compounds. It has been observed that the feature values decline at a highest rate after the OFT. It was observed that the second property of ET-ferm. profile bears higher significance with the reference OFT values and provides authentic information about the same during the occurrence of multiple peaks. It was also noted that the greenish appearance of tea leaves changed to characteristic coppery-brown colour of fermentation after the crest point. The PCA based ET-ferm. profile of two other samples are also presented in Fig. 4 (a & b). It may be observed from the fermentation profiles of the samples that the TF peaks associated with OFT are clearly identifiable and that there is a correlation between the TF values and electronic tongue features. The characteristics
Fig. 4. (a) Electronic tongue fermentation and TF profile for Kharijan_31072013 (ET-OFT: 60 min TF-OFT: 55 min). (b) Electronic tongue fermentation and TF profile for ST673_01082013 (ET-OFT: 65 min, TF-OFT: 65 min).
drops in profile values may also be observed after the OFT. The OFTs observed from the PCA based ET-ferm. profile of all samples are listed along with reference OFT values declared from TF profile in Table I. The detected time points were checked against those estimated by the spectrophotometric reference method. It may be observed that the detections of electronic tongue corroborate with the reference evaluations. The optimum times for samples TV2_22072013, TV23_23072013 and Kharijan_31072013 deviate by 5 min from reference OFT. It may be observed from Table I that the OFTs detected by the electronic tongue and the corresponding reference estimations correlate by a factor of 0.97. It may thus be inferred that the electronic tongue fermentation profile bears enough information for offline monitoring of the fermentation process of tea and also allows for the detection of optimum fermentation time. C. Model Development of Electronic Tongue Fermentation Profile for Monitoring Applications by Partial Least Squares Regression (PLSR) The extraction of electronic tongue fermentation profile by PCA requires the responses to be collected over the whole fermentation period. This necessity stipulates the real
6260
IEEE SENSORS JOURNAL, VOL. 15, NO. 11, NOVEMBER 2015
TABLE I O PTIMUM F ERMENTATION T IMES O BSERVED F ROM E LECTRONIC T ONGUE F ERMENTATION P ROFILE D ERIVED F ROM PCA
TABLE II T HE L EAVE O NE O UT C ROSS VALIDATION P ERFORMANCE OF THE
D EVELOPED PLS M ODEL FOR M ONITORING AND D ETECTION OF O PTIMUM F ERMENTATION
time applicability of this method for e.g. during real time monitoring. For real-time applications, it is desirable that a scalar value that reflects fermentation behavior of the sample at each process instant be predicted from the multivariate input response of electronic tongue. In this regard, a model of electronic tongue fermentation profile was developed using the PLSR technique (ET_ferm_PLS profile). The model was calibrated by the electronic tongue response for a given fermentation time as an input and the corresponding ET-ferm. profile value obtained from PCA as an output. It is already demonstrated that PCA generated ET-ferm. profiles reflect the chemical changes in a tea sample during fermentation, hence a data model developed to identify the PCA directions from the combination of input features shall be feasible and useful as it may simulate the PCA score value at a given instant of fermentation. The PLS models were tested by the leave one out cross validation procedure (LOOCV), where the ET_ferm_PLS profile of an unknown tea sample was obtained from the PLSR model calibrated by the response data sets and the corresponding ET-ferm. profiles of the remaining samples. In other words, the independent response data sets for each sample have been used to carry out the LOOCV process. The predicted ET_ferm_PLS profile of test samples were compared with the PCA generated fermentation profile (ET-ferm. profile) and prediction performance was assessed in terms of Pearson correlation coefficient. The OFTs observed from the fermentation profiles predicted by the PLS model were also compared with those estimated by the reference method. Large number of
trials confirmed that a model with 18 PLS components produce optimum results. Cross validation results of all samples are presented in Table II. It may be observed from Table II that the correlation coefficient between the OFTs observed from the predicted ET-ferm. profiles and those obtained from reference analysis is 0.96. The average prediction performance for the fermentation profiles considering all samples is 0.85. The models predicted fermentation profiles of five samples above a correlation value of 0.95. Even for samples with correlation less that 0.6 the predicted OFTs do not vary beyond ±5 min. V. C ONCLUSION The application of a voltammetric electronic tongue to monitor the fermentation process of black tea has been explored. It is found that the electrode currents yield useful information about the degree of fermentation. PCA analysis reveals that the variances along PCA directions are explained by the changes in chemical compositions during the fermentation process. The electronic tongue fermentation profile derived from PCA analysis display a trend to co-vary with the spectrophotometrically estimated reference TF fermentation profile. It was found that the optimum fermentation time
GHOSH et al.: MONITORING THE FERMENTATION PROCESS AND DETECTION OF OPTIMUM FERMENTATION TIME
obtained from electronic tongue analysis enabled detection over different tea samples at a correlation of 0.97 with respect to the reference estimations. The standard deviation of error is obtained below 2 min and the maximum deviation from reference OFT values is ±5 min. This indicates that the current fingerprints obtained from electronic tongue are suitable for rapid detection of optimum fermentation time. A PLSR model was developed and tested with LOOCV technique to predict the fermentation profile from the multivariate response of electrode array in order to facilitate real time monitoring applications. It is demonstrated that the PLSR predicted electronic tongue fermentation profiles are very identical to the PCA determined fermentation profiles at an average correlation of 0.85 over all the tea samples. The observed OFTs of the predicted profiles also produced a correlation of 0.96 with the actual OFTs. This indicates that the real time prediction model works at a sufficient accuracy towards monitoring and detection tasks. It may also be mentioned that the application of advanced data processing methods, like neural networks, as well as unsupervised model development techniques may be explored to capture the temporal patterns of variation among the features enabling accurate and robust detection of optimum fermentation duration over larger number of samples. The results signify that a voltammetric electronic tongue can be used to monitor the fermentation process of tea and an indication about optimum fermentation is also be obtained. ACKNOWLEDGMENT The research work has been carried out in collaboration with Tea Research Association Tocklai, Jorhat, Assam and National Tea Research Foundation, Tea Board, India. R EFERENCES [1] M. Obanda, P. O. Owuor, and R. Mang’oka, “Changes in the chemical and sensory quality parameters of black tea due to variations of fermentation time and temperature,” Food Chem., vol. 75, no. 4, pp. 395–404, Dec. 2001. [2] D. J. Wood and E. A. H. Roberts, “The chemical basis of quality in tea. III. Correlations of analytical results with tea tasters’ reports and valuations,” J. Sci. Food Agricult., vol. 15, no. 1, pp. 19–25, Jan. 1964. [3] M. G. Hampton, “Production of black tea,” in Tea: Cultivation to Consumption, K. C. Wilson and M. N. Clifford, Eds. London, U.K.: Chapman & Hall, 1992, pp. 459–511. [4] E. A. H. Roberts, “Economic importance of flavonoid substances: Tea fermentation,” in The Chemistry of Flavonoid Compounds, T. A. Geissmann, Ed. Oxford, U.K.: Pergamon Press, 1962, pp. 468–512. [5] K. Fraser et al., “Monitoring tea fermentation/manufacturing by direct analysis in real time (DART) mass spectrometry,” Food Chem., vol. 141, no. 3, pp. 2060–2065, Dec. 2013. [6] S. Y. Lin, Y. L. Chen, C. L. Lee, C. Y. Cheng, S. F. Roan, and I. Z. Chen, “Monitoring volatile compound profiles and chemical compositions during the process of manufacturing semi-fermented oolong tea,” J. Horticultural Sci. Biotechnol., vol. 88, no. 2, pp. 159–164, 2013. [7] Q. Chen, A. Liu, J. Zhao, and Q. Ouyang, “Classification of tea category using a portable electronic nose based on an odor imaging sensor array,” J. Pharmaceutical Biomed. Anal., vol. 84, pp. 77–83, Oct. 2013. [8] N. Bhattacharya, B. Tudu, A. Jana, D. Ghosh, R. Bandhopadhyaya, and M. Bhuyan, “Preemptive identification of optimum fermentation time for black tea using electronic nose,” Sens. Actuators B, Chem., vol. 131, no. 1, pp. 110–116, Apr. 2008. [9] N. Bhattacharyya et al., “Detection of optimum fermentation time for black tea manufacturing using electronic nose,” Sens. Actuators B, Chem., vol. 122, no. 2, pp. 627–634, Mar. 2007. [10] J. M. Gutiérrez et al., “Hybrid electronic tongue based on multisensor data fusion for discrimination of beers,” Sens. Actuators B, Chem., vol. 177, pp. 989–996, Feb. 2013.
6261
[11] I. M. Apetrei, M. L. Rodriguez-Mendez, C. Apetrei, and J. A. de Saja, “Fish freshness monitoring using an E-tongue based on polypyrrole modified screen-printed electrodes,” IEEE Sensors J., vol. 13, no. 7, pp. 2548–2554, Jul. 2013. [12] N. Prieto et al., “Application of a GA–PLS strategy for variable reduction of electronic tongue signals,” Sens. Actuators. B, Chem., vol. 183, pp. 52–57, Jul. 2013. [13] Z. Wei, J. Wang, and X. Zhang, “Monitoring of quality and storage time of unsealed pasteurized milk by voltammetric electronic tongue,” Electrochim. Acta, vol. 88, pp. 231–239, Jan. 2013. [14] Z. Wei, J. Wang, and W. Jin, “Evaluation of varieties of set yogurts and their physical properties using a voltammetric electronic tongue based on various potential waveforms,” Sens. Actuators B, Chem., vol. 177, pp. 684–694, Feb. 2013. [15] X. Cetó, F. Céspedes, and M. D. Valle, “Assessment of individual polyphenol content in beer by means of a voltammetric bioelectronic tongue,” Electroanalysis, vol. 25, no. 1, pp. 68–76, Jan. 2013. [16] I. Campos et al., “A voltammetric electronic tongue as tool for water quality monitoring in wastewater treatment plants,” Water Res., vol. 46, no. 8, pp. 2605–2614, May 2012. [17] A. Ghosh, B. Tudu, P. Tamuly, N. Bhattacharyya, and R. Bandyopadhyay, “Prediction of theaflavin and thearubigin content in black tea using a voltammetric electronic tongue,” Chemometrics Intell. Lab. Syst., vol. 116, pp. 57–66, Jul. 2012. [18] A. Ghosh, P. Tamuly, N. Bhattacharyya, B. Tudu, N. Gogoi, and R. Bandyopadhyay, “Estimation of theaflavin content in black tea using electronic tongue,” J. Food Eng., vol. 110, no. 1, pp. 71–79, May 2012. [19] H. Men, Y. Guo, C. Zhang, and R. Wen, “An electronic tongue based on differential pulse voltammetry and its application in the classification of green tea,” Adv. Sci. Lett., vol. 11, no. 1, pp. 189–193, May 2012. [20] M. Palit et al., “Classification of black tea taste and correlation with tea taster’s mark using voltammetric electronic tongue,” IEEE Instrum. Meas. Mag., vol. 59, no. 8, pp. 2230–2239, Aug. 2010. [21] P. Ivarsson, S. Holmin, N. Höjer, C. Krantz-Rülcker, and F. Winquist, “Discrimination of tea by means of a voltammetric electronic tongue and different applied waveforms,” Sens. Actuators B, Chem., vol. 76, nos. 1–3, pp. 449–454, Jun. 2001. [22] F. Winquist, S. Holmin, C. Krantz-Rülcker, P. Wide, and I. Lundström, “A hybrid electronic tongue,” Anal. Chim. Acta, vol. 406, no. 2, pp. 147–157, Feb. 2000. [23] C. Turner, A. Rudnitskaya, and A. Legin, “Monitoring batch fermentations with an electronic tongue,” J. Biotechnol., vol. 103, no. 1, pp. 87–91, Jun. 2003. [24] K. Esbensen et al., “Fermentation monitoring using multisensor systems: Feasibility study of the electronic tongue,” Anal. Bioanal. Chem., vol. 378, no. 2, pp. 391–395, 2004. [25] A. Legin et al., “Multicomponent analysis of fermentation growth media using the electronic tongue (ET),” Talanta, vol. 64, no. 3, pp. 766–772, Oct. 2004. [26] E. Polshin et al., “Electronic tongue as a screening tool for rapid analysis of beer,” Talanta, vol. 81, nos. 1–2, pp. 88–94, Apr. 2010. [27] S. Buratti et al., “Monitoring of alcoholic fermentation using near infrared and mid infrared spectroscopies combined with electronic nose and electronic tongue,” Anal. Chim. Acta, vol. 697, nos. 1–2, pp. 67–74, Jul. 2011. [28] A. Kutyła-Olesiuk, M. Zaborowski, P. Prokaryn, and P. Ciosek, “Monitoring of beer fermentation based on hybrid electronic tongue,” Bioelectrochemistry, vol. 87, pp. 104–113, Oct. 2012. [29] M. R. Ullah, N. Gogoi, and D. Baruah, “The effect of withering on fermentation of tea leaf and development of liquor characters of black teas,” J. Sci. Food Agricult., vol. 35, no. 10, pp. 1142–1147, Oct. 1984. [30] T. Muthumani and R. S. Senthil Kumar, “Influence of fermentation time on the development of compounds responsible for quality in black tea,” Food Chem., vol. 101, no. 1, pp. 98–102, 2007.
Arunangshu Ghosh received the Ph.D. degree from Jadavpur University, Kolkata, India, in 2015. He was a Research Scholar with the Department of Instrumentation and Electronics Engineering. His current research interests include electronic tongue, machine olfaction, quartz crystal microbalance sensors, and pattern recognition.
6262
Anil Kumar Bag received the M.Tech. degree in instrumentation and control engineering from the University of Calcutta, Kolkata, India, in 2004, and the Ph.D. degree from Jadavpur University, Kolkata, in 2015. He is currently an Assistant Professor with the Department of Applied Electronics and Instrumentation Engineering, Heritage Institute of Technology, Kolkata. His research interest includes pattern recognition, artificial intelligence, machine olfaction, and analytical instrumentation.
Prolay Sharma received the M.Tech. degree in instrumentation and electronics engineering from Jadavpur University, Kolkata, India, in 2006, where he is currently pursuing the Ph.D. degree with the Department of Instrumentation and Electronics Engineering. His current research interests include quartz crystal microbalance sensor and array-based signal processing.
IEEE SENSORS JOURNAL, VOL. 15, NO. 11, NOVEMBER 2015
Binoti Devi Baruah received the M.Sc. degree from North Eastern Hill University, Shillong, India, in 1984. She is currently a Scientist with the Tocklai Tea Research Institute, Jorhat, India. Her current research interests include science of tea manufacturing and tea biochemistry.
Pradip Tamuly received the Ph.D. degree from Dibrugarh University, Dibrugarh, India, in 1993. He is currently the Head of Biochemistry with the Tocklai Tea Research Institute, Jorhat, India. His current research interests include tea biochemistry, flavor chemistry, and tea processing science.
Bipan Tudu received the Ph.D. degree from Jadavpur University, Kolkata, India, in 2011. He is currently an Associate Professor with the Department of Instrumentation and Electronics Engineering, Jadavpur University. His current research interests include pattern recognition, artificial intelligence, machine olfaction, and electronic tongue.
Nabarun Bhattacharyya received the Ph.D. degree from Jadavpur University, Kolkata, India, in 2008. He is currently the Associate Director with the Centre for the Development of Advanced Computing, Kolkata. His current research interests include agrielectronics, machine olfaction, soft computing, and pattern recognition.
Santanu Sabhapondit received the Ph.D. degree from Gauhati University, Guwahati, India, in 2014. He is currently a Scientist with the Tocklai Tea Research Institute, Jorhat, India. His current research interests include science of tea manufacturing and tea biochemistry.
Rajib Bandyopadhyay received the Ph.D. degree from Jadavpur University, Kolkata, India, in 2001. He is currently a Professor with the Department of Instrumentation and Electronics Engineering, Jadavpur University. His current research interests include machine olfaction, electronic tongue, and intelligent systems.