CIRED
20th International Conference on Electricity Distribution
Prague, 8-11 June 2009 Paper 0486
MULTI-OBJECTIVE PROGRAMMING TO MAXIMIZE THE PENETRATION OF DISTRIBUTED GENERATION IN DISTRIBUTION NETWORKS Gianni CELLI
Emilio GHIANI Susanna MOCCI University of Cagliari - Italy
[email protected]
Fabrizio PILO
ABSTRACT
PROBLEM FORMULATION
Distributed generation allows achieving large savings or causing technical problems, depending on the generation size, type and location. The optimal location and sizing of DG is a challenging problem and requires a multiobjective programming approach. In this paper the aspects of the DG siting and sizing problem are highlighted considering the simultaneous optimization of several objective functions from the point of view of different stakeholders of the distribution system. A procedure able to identify the maximum allowable penetration level of DG in a given distribution network, considering the possibility of a non-optimal location of the DG units, is presented.
The main goal of the proposed planning algorithm is to find the maximum allowable penetration level of DG in a given distribution network considering the possibility of a nonoptimal allocation of the DG units. This feature is introduced to allow the planner to manage the risks arising from the fact that there are really few chances that DG appears in the most suitable sites. In the search of the optimal deployment of DG in an existing distribution system, the network topology is usually assumed not flexible in the planning period, whereas some lines may be refurbished to meet the growing customer demand. Simultaneously, the need of revamping of the protection devices and the addition of new devices to permit the safe connection of new generation has to be taken into account. In the planning procedure the contrasting views of the Regulator and the distribution system operator (DSO) should be considered. In fact, the Regulator, under the pressure of political institutions, has the goal of maximizing the penetration of DG, particularly of the renewable type (wind turbine, PV unit, Biomass CHP plant) and/or minimize the losses in the distribution system; on the other side the DSO has to tackle with the safety and security of network operation and, in some cases, DSO poses barriers on the connection of large quantities of distributed generation when high upgrading costs are necessary. For these reasons in the paper the authors consider the following main objectives to be simultaneously accomplished: 1. to favorite DG integration and RES exploitation (Regulator goal) 2. increasing the energy efficiency of power delivery, by penalizing high energy losses to reduce CO2 emissions and decrease energy tariffs to final consumers (Regulator goal), and 3. identifying the network planning that maximizes power delivery profits complying with mandatory technical and regulatory constraints (DSO goal). These objectives in the proposed problem can be incorporated into three different evaluation functions, namely: the DG penetration Level %DG, the energy losses EL, and a Technical Impact Index TIDG.
INTRODUCTION The optimal location and sizing of distributed generation (DG) is a challenging problem which requires a multiobjective programming approach [1-2]. As frequently reported in the technical literature, DG may allow achieving great savings (e.g. deferment of investments and reduction of power losses) or causing technical problems (e.g. overvoltages and overloads), depending on the DG sizing and siting. Despite these well known benefits that DG interconnection can provide, numerous technical and economic barriers still exist. A typical obstacle that prevent the widespread adoption of DG are the technical problems argued by distribution system operators. They assert the inability of existing networks to receive high levels of DG for several technical reasons. They claim that the networks are not capable of handling the increase in short-circuit currents resulting from the connection of DG, and/or DG causes overvoltage problems or thermal violations in distribution circuits whether the penetration level is higher than certain values. This paper has the goal to propose a methodology able to evaluate the critical value of DG penetration level and, at the same time, by showing the multiobjective feature of the DG siting and sizing problem, to provide a criteria for maximizing the benefits of the presence of generators in a distribution network taking into account the network performance deterioration for DG not connected in optimal locations. In fact, power producers seeking interconnection under open access rules may dictate the location [3-4]. A case study is presented to demonstrate the effectiveness of the proposed procedure.
CIRED2009 Session 5
Paper No 0486
DG Penetration Level The DG penetration level in the system is defined as in (1):
CIRED
20th International Conference on Electricity Distribution
Prague, 8-11 June 2009 Paper 0486
% DG =
PDG ⋅100 (1) PL
I jk =
Where:
PDG is the total capacity of DG installed; PL is the total load in the network. The impact of DG on the network strictly depends on the generation size, type and location. The penetration level is an index that provides information on the capacity of local generation compared with the demand of a given distribution network. There is not an exact correlation between the DG penetration level and, for example, losses or upgrading costs of the network. In fact, DG is usually claimed as an option for reducing losses but, if the DG level is high and DG is concentrated in few installations, the losses can increase. As for the upgrading costs, DG may permit the deferment of those costs, but if the level of DG is very high, it may require to replace the overloaded feeders and the switchgears with not sufficient short circuit breaking capacity.
Energy Losses The objective on energy efficiency is incorporated in the problem formulation by evaluating the Joule energy losses in the network. In particular, for the jth branch in the kth subperiod, expressed in kWh, the losses can be calculated as in (2): ⎛ Nk ⎞ E Ljk = 8760 ⋅ ( 3 ⋅ r j ⋅ L j ) ⋅ ⎜ ∫ I 2jk dy ⎟ ⋅ 10 − 3 = ⎜ ⎟ (2) ⎝ 0 ⎠ = 8.76 ⋅ ( 3 ⋅ r j ⋅ L j ) ⋅ ⎡⎣ N k ⋅ ( I 2fjk + I 02 jk + I fjk ⋅ I 0 jk ) ⎤⎦
where rj is the resistance per kilometer, Lj is the branch length in kilometers, and 8760 is the number of hours per year. The total energy losses, EL, is then obtained as the sum of the contributions for each branch in each sub-period (3): EL =
N branches m
∑ ∑E j =1
= 8.76 ⋅
k =1
Ljk
N branches
∑ j =1
=
⎤ ⎡m 3 ⋅ rj ⋅ L j ⋅ ⎢ ∑ N k ⋅ ( I 2fjk + I 02 jk + I fjk ⋅ I 0 jk ) ⎥ ⎣ k =1 ⎦ (3)
The losses of the HV/MV substation transformer are also considered. It is important to notice that the Joule losses are estimated by using the average value of the branch current by considering the customer’s demand curve modeled with a piecewise linear curve, with the load growth rate that may be different in each one of the m sub-periods of the whole planning period of N years. The higher the number of subperiods is, the finer the real load growth model becomes. Due to the linear model of demand growth vs. time, it is acceptable for planning studies to assume that the branch current grows linearly into each sub-periods, as shown in (3) for the jth branch in the kth sub-period:
CIRED2009 Session 5
Paper No 0486
I fjk − I 0 jk Nk
⋅ y + I 0 jk
(4)
where I0jk and Ifjk are respectively the branch current at the beginning and at the end of the sub-period, Nk is the subperiod duration in years, and y is the generic year of the sub-period.
Technical Impact Index In order to assess the maximum DG capacity which can be accommodated in a given MV network without sustain excessive costs, the technical index TIDG (5) has been introduced. This index takes into account several technical issues related to the interconnection of DG sources. In particular the impacts associated to voltage constraints on bus voltages, the increased fault levels on buses, and the overload of cables and overhead feeders are considered. m (V − V n max ) |Vi >V max + TI DG = ∑ i i =1 Vn (5) q I − I scni I Ti − I Tni ) | I Ti > I Tni + ∑ ( sc i ) | I sc i > I scni i =1 i =1 I Tni I scni where: m is the number of upper voltage violations; p the number of thermal rating violations; q is the number of fault level violations; Vi = voltage at node i, Vn = nominal voltage; Vnmax = 1.05 p.u., Vnmin = 0.95 p.u.; Isci = short circuit level at node i-th; Iscni = swithgear short circuit rating at node i-th; ITI = overcurrent on the branch i-th; ITni = thermal rating for the branch i-th; During normal operation all voltages at customer busbars have to be maintained as close as possible to the nominal value, within the upper and lower voltage limits. It should be noticed that DG may improve the voltage profile, thanks to the reduction of active power flows in the lines and the consequent compensation of the resistive voltage drop but, in some other cases, namely during low load conditions or for the absence of coordination with the On Line Tap Changer (OLTC), it can cause not acceptable voltage drop and overvoltage. The maximum allowable voltage drop is normally 5% of nominal voltage, the maximum tolerable overvoltage is 10%. Those constraints are frequently the most limiting factors in determining how much DG can be connected to a given network without significant changes in the system operation. For example, on 15 kV rural feeders the maximum amount of generation lies between 1-3 MW depending on the DG position; anyway such limit can be even bigger if load and generation curves are homothetic. When generation is located close to the substation or lines have bigger cross sections, as it might be in an urban area, the amount of DG that can be connected may increase. Overloads of circuits may occur with DG operating at full capacity whilst local load is at a minimum or vice versa p
+ ∑(
CIRED
20th International Conference on Electricity Distribution
Prague, 8-11 June 2009 Paper 0486
(e.g., maximum DG production in off-peak hours or, low DG production in peak hours). 10% overload or greater have been considered as constraint violations and they contribute to the TI index value. Normally, the maximum power flow in urban networks with 240 mm2 buried cables is 5 MW; this values is increased during emergency temporary reconfigurations caused by line faults. The suitable integration of DG and loads can help maintain the power within that limit even if the nominal capacity of both is bigger. Finally, DG increases fault levels. Fault level increasing is critical in urban areas and affects protection devices and protection coordination.
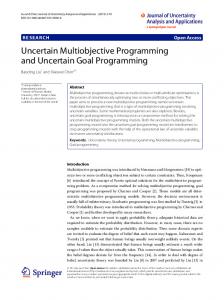
Legend HV/MV substation MV trunk node MV lateral node
MULTI-OBJECTIVE PROGRAMMING Conventional single optimization techniques are not suitable in studies of DG integration within existing distribution networks whereas multi-objective methods can be naturally applied [1-3]. In the paper, multi-objective programming is used to deal with the DG integration by considering the three objective functions described in the previous paragraph. Given a network configuration with size, type, and location of DG randomly arranged, those functions are assessed to find the most acceptable trade-off solutions. The random allocation is important to take into account that distribution companies are not allowed to own generators, whereas they have to guarantee the network accessibility to any producer. Thus, in the proposed procedure, a set of generators is obtained by randomly choosing number, size and connection point of DG. By so doing, a set of 5000 possible configurations has been created and assessed. For each configuration obtained with the algorithm, network calculations are performed. In particular, nodal voltages and branch currents are evaluated by means of a probabilistic load flow (PLF) that takes into account the probability density function (pdf) associated with load demand and DG power generation. Once the current flowing in each branch and the voltage of each node with their pdf have been calculated, all technical constraints are checked and the Objective Functions (OFs) are assessed. The family of network solutions has been analyzed according to the multi-objective programming. The first study aims at identifying the best compromise solutions in the Pareto front. Best solutions may have too good features to be true because they may be obtained only if DG suitable size, with a proper production curve is connected at suitable nodes. That is difficult to achieve without a direct control of investments. For this reason, in the paper a second analysis is proposed that is based on the analysis average solutions falling within a prefixed %DG range. For instance, the family of solutions falling in the range between 10-20 %DG is represented by a single solutions with 15 %DG and the mean value of TIDG and EL. The preliminary assessment of the OF allows extracting the
CIRED2009 Session 5
Paper No 0486
Fig. 1. Existing MV distribution network.
Pareto front of non dominated solutions from the set of network configurations randomly generated. According to the multiobjective paradigm each point of the Pareto set represents a compromise solution. Then, starting from this optimal set is possible to choose the best trade-off solutions.
CASE STUDY The proposed methodology has been applied to the portion of Italian 20 kV distribution network depicted in Fig. 2.The 2 HV/MV substations have a power capacity of 40 MVA. The operation of the network is radial and the nodes in the main feeder can be supplied during faults by isolating the faulted branch thanks to the redundancy of paths achieved with the emergency connections. The network supplies 142 MV/LV nodes, divided in 25 trunk nodes and 117 lateral nodes. Overhead distribution lines and underground cable feeders are used, for a total length of 69.5 km of power lines. The total demand is about 7 MVA. In the study, it has been assumed that the load demand and the network topology are constant during the planning period. That implies optimizing the DG allocation for a given configuration, without considering the increasing of the load. However, the methodology may be adapted to provide the optimal allocation considering different load scenarios. Several sizes of generators, ranging from 500 kVA to 6 MVA have been considered for a possible allocation in the network according to the Italian Authority for Energy and Gas (AEEG) resolution [5]. According to [5, 6], generators with capacity up to 6 MVA can be connected to the MV distribution network or may be connected directly to the HV/MV substation depending on the situation. In the case
CIRED
20th International Conference on Electricity Distribution
Prague, 8-11 June 2009 Paper 0486
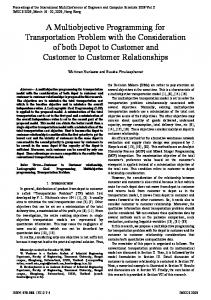
TIDG 0,9 0,8 0,7 0,6 0,5 0,4 0,3 0,2 0,1 0 0
10%
20%
30%
40%
50%
60%
70%
80%
90% 100% 110% 120%
%DG
Fig. 2. TIDG vs. %DG
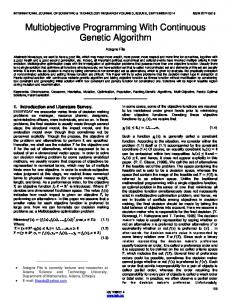
EL (MWh)
technical constraints. Building new lines normally reduces losses, but in the paper network upgrade is not considered. The application of MO programming to the whole set of random DG integration allows extracting the following Pareto front solutions (Tab. I). The objectives are maximizing the %DG and minimizing energy losses and constraint violations. As well known, the solutions of the Pareto set are the ones that cannot be improved in one term of the objectives functions without deteriorate the other ones. It emerges from Tab. I that solutions with good energy efficiency capable to lead DG integration at very high values exist, and that they do not require capital expenditures for network upgrade. Unfortunately, those solutions are too much favorable to be considered, and DSO or Regulator have no ways to guide the system developing in that way.
30000
Table I – Pareto Front from the 5000 random solutions examined. EL(MWh) %DG TIDG 120.0 % 14242.2 0.0 120.0 % 10313.1 0.0 119.3 % 6416.7 0.0 119.6 % 8767.4 0.0 119.8 % 9980.5 0.0 107.8% 5992.3 0.0
25000
20000
15000
10000
5000
0 0
10%
20%
30%
40%
50%
60%
70%
80%
90% 100% 110% 120%
%DG
Fig. 3. Energy Losses vs. %DG
study, a maximum size of 6 MVA is considered, assuming always the connection to the nodes of the distribution circuits. The emphasis of this article is the assessment of the penetration level of DG that could be connected to the distribution network without any active operation of the system. In Figs. 2 and 3 the average values of EL and TIDG are calculated for all the configurations falling into intervals of a certain %DG. The results of the simulations, depicted in Fig. 2, permit observing that below a lower limit of %DG, roughly 40%, the performance of the network is not deteriorated by the presence of DG, meaning that neither thermal limits or voltage limits nor short circuit limits are violated. Above the 40% of DG penetration the TIDG is greater than zero, that means that the network cannot be operated because of the not complied with constraints. Network upgrade and refurbishment is necessary to accommodate DG with no active network management. In Fig. 3 the behavior of energy losses vs. %DG is showed. Energy losses decrease as %DG increases up to roughly 30%. Between 30-70%, the energy losses remain approximately constant and they start increasing above 70% of DG penetration. Above the penetration level of 100% the energy losses overcome the value corresponding to the network without DG. These results are only preliminary because for %DG greater than 40% capital expenditures for network upgrades are requested due to CIRED2009 Session 5
Paper No 0486
In Tab. II the decision matrix is showed when average solutions are used. Si represents a solution falling in a %DG range characterized by the average value of OFs of all the network configurations comprised in the range. The definition of Pareto set allows identifying the non dominated solutions (Table II). From S4 to S12 the improvement of one OF (e.g., increasing the %DG) cause a worsening in the other two OFs (i.e., losses and/or the number of violated technical constraints increase). Table II - Decision Matrix for average solutions extracted from the 5000 randomly generated solutions EL(MWh)
TIDG
10%
20486.3
0
20%
18215.72
0
S3
30%
16143.92
0
S4
40%
15840.02
0.01
S5
50%
16130.34
0.05
S6
60%
16230.00
0.09
S7
70%
16335.29
0.10
S8
80%
17015.02
0.22
S9
90%
18600,4
0.24
S10
100%
20544.7
0.40
S11
110%
22402.26
0.57
S12
120%
24096.58
0.78
Solution
%DG
S1 S2
It clearly emerges that passive networks DG can accommodate at reasonable costs, only if the penetration level remains lower than 60%; greater penetration gives an exponential growth of technical constraint violations that
CIRED
20th International Conference on Electricity Distribution
Prague, 8-11 June 2009 Paper 0486
means high investments. Whether those investments were paid by DG owners they pose insurmountable barriers to DG and renewable exploitation. On the contrary, whether those costs were paid in advance by DSOs (shallow connections costs) and then reimbursed by Regulator, they pose financial problem to DSO and are a significant burden on the society. High %DG in the passive network also cause losses increase. DSOs often receive a flat rate as energy loss reimbursement (in Italy, 2% of the delivered energy) and they will lose money each time real losses are greater. Furthermore, DSOs are often committed to reduce losses but this goal may be achieved only with huge network investments if %DG is above 60%. S4 and S5 may be reasonable compromises, because they give low energy losses and need no or few network investments. If environmental constraints as in [7] are taken into account, solutions with higher %DG may be preferable but they are too much expensive with passive networks. In conclusion, the general remark is that renewable exploitation, even if favored by economic incentives, will be stopped by network barriers whether the passive operation practice will be used. Indeed, high DG penetration will reduce energy efficiency, by vanishing or reducing the benefits of less CO2 emissions. Furthermore, high DG penetration requires capital expenditures for network upgrades.
CONCLUSIONS The EU and many developed states in the world are trying to reduce pollution and improve energy efficiency because they are concerned about the climate change. DG and RES are considered an useful way to achieve that goal but passive distribution systems are still a barrier. The paper proposes a multi-objective formulation of the problem by identifying two players, Regulator, and DSOs having contrasting goals. The main conclusions of the study are: 1. A good compromise solution with high DG penetration can be found only if DG connection can be exactly controlled, and 2. Whether DG is free to ask for connection anywhere in the system, the passive operation of the distribution system limits to 40-50% the DG penetration level.
CIRED2009 Session 5
Paper No 0486
The general conclusion is that Active Distribution Networks are necessary to favorite the integration of Renewable Energy Sources in the system at reasonable costs but more favorable regulatory environments are necessary not only to establish a fair market of energy and services but also to define the sharing of responsibilities among all players. REFERENCES [1] G. Celli, F. Pilo, 2001, “Optimal distributed generation allocation in MV distribution networks”. Proceedings of IEEE PES conference on power industry computer applications. PICA 2001, Australia; 2001, p. 81–86. [2] G. Celli, E. Ghiani, S. Mocci, F. Pilo, 2005 “A multiobjective evolutionary algorithm for the sizing and siting of distributed generation”, IEEE Trans. Power Systems, vol. 20, pp. 750-757, May 2005. [3] R.C. Dugan, T.E. McDermott, G. J. Ball, 2001, “Planning for distributed generation”, Industry Applications Magazine, IEEE, Mar/Apr 2001.Volume 7, Issue: 2, pp. 80-88. [4] R.C. Dugan and T.E. McDermott, 2002, “Distributed generation”, IEEE Industry Applications Magazine, vol. 8, pp. 19-25, March-April 2002. [5] Resolution AEEG ARG/elt 99/08, “Testo integrato delle condizioni tecniche ed economiche per la connessione alle reti elettriche con obbligo di connessione di terzi degli impianti di produzione di energia elettrica (Testo integrato delle connessioni attive – TICA)”, 2008; in Italian, available on: www.autorita.energia.it. [6] CEI 0-16, “Reference technical rules for the connection of active and passive consumers to the HV and MV electrical networks of distribution Company”, II edition, 2008, in Italian, available on: www.ceiweb.it. [7] G. Celli, S. Mocci, F. Pilo, G.G. Soma, “A MultiObjective Approach for the Optimal Distributed Generation Allocation with Environmental Constraints”, in Proc. of PMAPS 2008, Rincon, Puerto Rico, May 2529, 2008.