Multi-Temperature Testing for Core-based System-on-Chip. Zhiyuan He, Zebo Peng, Petru Eles. Department of Computer and Information Science. Linköping ...
Multi-Temperature Testing for Core-based System-on-Chip Zhiyuan He, Zebo Peng, Petru Eles Department of Computer and Information Science Linköping University Linköping SE-58183, Sweden {zhihe, zebpe, petel}@ida.liu.se
Abstract—Recent research has shown that different defects can manifest themselves as failures at different temperature spectra. Therefore, we need multi-temperature testing which applies tests at different temperature levels. In this paper, we discuss the need and problems for testing core-based systems-on-chip at different temperatures. To address the long test time problem for multitemperature test, we propose a test scheduling technique that generates the shortest test schedules while keeping the cores under test within a temperature interval. Experimental results show the efficiency of the proposed technique. Keywords: multi-temperature testing; system-on-chip test; test scheduling; thermal-aware test
I. INTRODUCTION Environment-sensitive defects often cause parametric failures that are more and more observed in very large scale integrated (VLSI) circuits manufactured with nanometer technologies. These environmental parameters include power supply voltage, clock frequency, temperature, radiation, etc. In recent years, concerns regarding parametric failures are rapidly rising due to widely distributed process variations and the wide spectrum of subtle defects introduced by new manufacturing processes and materials [18], [13], [14], [12]. Some defects are sensitive to a certain temperature level. For example, metal interconnect defects may pass a delay test at nominal temperature but fail the same test at a high temperature. This indicates that speed tests, such as maximum frequency (Fmax) tests and transition delay tests, should usually be applied at a high temperature in order to detect these temperaturedependent defects. In [19], a closer investigation on the correlation between the maximum frequency and temperature was performed for integrated circuits (ICs) powered by ultra-low supply voltages. It shows that there exists a turnaround temperature point above which the maximum frequency no longer decreases but rather increases. This means that applying a speed test at a high temperature may not screen the defective chips because of the improper temperature setting for the test. Therefore, for those types of ICs, Fmax tests or transition delay tests should be applied at a critical temperature which can be obtained by characterization. Parametric failures induced by subtle defects, such as resistive vias/contacts and weak opens, are hard to detect even when the circuit operates with the lowest performance under the worst environmental condition. In these cases, a speed test needs to be applied at two temperatures (hot/cold) and at a particular frequency [13]. The defective chips can be screened as outliers by comparing the test results at the two different temperatures.
978-3-9810801-6-2/DATE10 © 2010 EDAA
The existence of complicated temperature dependences and defect-induced parametric failures indicates that we need to test a chip at multiple temperatures. Multi-temperature testing aims to screen chips having various defects that can only be efficiently sensitized at different temperatures. Different tests may be needed and applied at different temperatures, and each test targets a particular type of defects that can be detected at a certain temperature interval. Alternatively, the same test can also be applied at different temperature intervals so that outliers can be screened through a comparison of the test results, like in the case of speed tests against parametric failures induced by subtle defects. A multi-temperature test is expected to have a substantially long test application time (TAT), since a mono-temperature test is already time consuming. The long TAT problem is further exacerbated when multi-temperature testing is combined with SoC testing. Therefore, we need efficient test scheduling methods to reduce the TAT of multi-temperature SoC tests. In this paper, we demonstrate the need for multi-temperature testing and we propose a test scheduling technique for SoC tests to be applied within a temperature interval. Aiming at minimizing the TAT, the proposed technique generates test schedules such that the temperatures of the cores under test (CUTs) are within a certain temperature interval and the test bus width limit is satisfied. We employ a test set partitioning and interleaving technique as well as heating patterns in order to keep the temperatures of CUTs within the imposed interval. The generated test schedules guarantee that any test is scheduled for application when and only when the temperature of the core is within the given temperature interval. The scheduling algorithm uses a finite state machine to manage the temperatures of cores and a thermal simulator to obtain instantaneous temperatures of all individual cores. To the best of our knowledge, this is the first work that addresses the multi-temperature testing issue for system-on-chip and provides an efficient technique to minimize the test time of a multi-temperature SoC test. The rest of this paper is organized as follows. The next section demonstrates the need for temperature-dependent testing for SoC. Section III presents the proposed technique for SoC testing within a temperature interval. Experimental results are described in Section IV and the paper is concluded in Section V. II.
TEMPERATURE-DEPENDENT TESTING FOR SOC
A. Temperature Effects in CMOS Circuits As one of the environmental parameters, operating temperature has a large impact on the electrical properties of transistors and their interconnects [18]. Carrier mobility usually decreases at high temperature since the carriers collide with the Si-crystal lattice more frequently. Similar effects occur in the
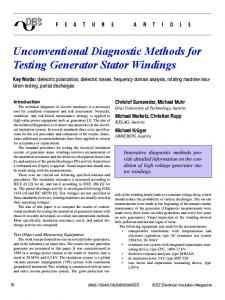
thin metal lines connecting the transistors, increasing the interconnect resistance. Thus, performance degradation is often encountered at a high operating temperature, leading design and test efforts focusing on the high-temperature scenarios. In practice, an IC is often tested at high temperatures in order to guarantee the functionality at all temperatures that may appear in the field. Another temperature-dependent parameter is the transistor threshold voltage, which increases with rising temperature. The increasing threshold voltage results in an elevated drain current, which compensates for the degraded circuit performance due to the reduced carrier mobility and interconnect resistance. The threshold voltage dominates the performance after the operating temperature exceeds a certain point, referred to as the CMOS zero-temperature-coefficient (ZTC) point [3], meaning that the circuit performance increases with further rising temperature. Thus, there exist two temperature dependence regions [3], [1], [20], a nominal region in which the circuit delay increases with rising temperature, and a reverse dependence region in which the circuit delay decreases with rising temperature. Figure 1 illustrates circuit delay variation in the nominal and reverse dependence regions [20]. This phenomenon is usually observed in low power designs with ultra-low supply voltage. It indicates that, for those circuits in which reverse temperature dependence is observed, a delay test should be applied at the temperature point between the nominal and reverse regions where the circuit delay is the largest. Delay
Nominal Dependence Region
Reverse Dependence Region Temperature
Figure 1. Nominal and reversal temperature dependence regions
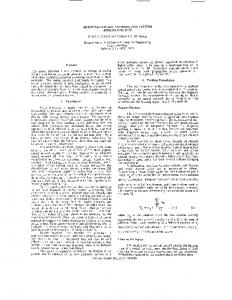
B. Subtle Defects and Parametric Failures VLSI systems manufactured with nanometer technologies, typically below 45nm, encounter more reliability problems and parametric failures caused by widely distributed variations and a wide spectrum of subtle defects. Defect-induced parametric failure mechanisms include weak interconnect opens, resistive vias and contacts, metal mouse bites and metal slivers, with the first two as major causes [18]. In [12], examples of a weak interconnect open and a resistive via in a deep-submicron CMOS IC are given. Although most parametric failures are speed-related, some of them are insensitive to a single test method such as IDDQ test, stuck-at test, delay test, and functional test. Simply applying a single type of tests may not be capable to identify the outliers from the normal parts, resulting in either an increased amount of test escapes or unexpected yield loss. In order to effectively screen the chips having subtle defects, multiple parameters may need to be combined for a test making the chip out of specification. Temperature, transition delay, supply voltage, and clock frequency are important parameters to be considered in multi-parameter testing [18], [13], [14]. Running at a certain given frequency, a chip with resistive vias may fail a speed test such as Fmax test and delay test, but pass the test at the same frequency when the operating temperature is elevated [13]. As explained in [18] and [13], the root cause was the voids existing in vias. When the temperature
increases, the surrounding metal expands inwardly, forcing the voids to shrink. As a consequence, the metal resistance is reduced and the delay becomes shorter. Figure 2 illustrates that the shapes of two voids in a via vary at different temperatures [18]. This subtle-defect-induced parametric failure indicates that a combination of parameters (e.g. frequency and temperature) is needed to sensitize the defects and a comparison of test results at different temperatures is needed for screening defective parts. M3
M3 Voids
Via
Via
M2
M2
(a) Room temperature
(b) High temperature
Figure 2. Illustrations of via voids at different temperatures
C. System-on-Chip Testing The ever increasing demands on system performance have led to the integration of more and more functionalities into modern ICs, making them highly complex. While the industry steadily follows the Moore's law, the time between technology nodes has been significantly shortened, intensifying the time-tomarket pressure. In order to accomplish the design and production of highly complex systems within a shortened period, a module-based design methodology has been widely adopted by the industry, referred to as core-based SoCs. Naturally, the testing of modern SoCs inherits this modular style, making the tests of cores to be independent from each other. Nonetheless, the modular SoC test becomes difficult and expensive, due to inefficient test access mechanisms (TAM) [2], [11], large volume of test data [8], [15], high power density [5], [10] and high temperature [10], [16]. The long test application time is one of the major contributors to the testing cost. An efficient schedule of tests can help reduce the total test time, which is a key issue in volume production tests. In recent years, many test scheduling techniques have been proposed for test time reduction [2], [7], [9]. As demonstrated in previous sections, multi-temperature testing is needed for core-based SoCs. It is also important to develop efficient test scheduling techniques for multitemperature SoC testing, in order to reduce the even longer test application time. D. Problem Formulation We assume that the tester employed for a SoC test is either an automatic test equipment (ATE) or an embedded tester in the chip. The tester consists of two major components, a test controller and a memory. The memory stores a test schedule and the generated test patterns. The test controller reads the test schedule and transports the test data to/from the CUTs accordingly. A test bus is used for the test data transportation between the tester and the CUTs. Each core is connected to the test bus through dedicated TAM wires. Through the test bus and TAM wires, test patterns are sent to the CUTs and test responses are sent back to the tester. Suppose that a system-on-chip, denoted with S, consists of n cores, denoted with C1, C2, ... , Cn, respectively. The cores are placed on a silicon die according to a floorplan F, which also specifies the physical parameters of the silicon die and the package. In order to test core Ci (1 i n), li test patterns are
generated and form a test set, denoted with Si. The test patterns/responses are transported through the test bus to/from core Ci, if a certain amount of bus width, denoted with Wi, is granted. The test bus can concurrently transport test data for different cores under a width limit B (B Wi, i = 1, 2, ... , n). In order to sensitize temperature-dependent defects, we need to apply tests to the SoC at different temperature spectra. Each temperature spectrum is specified as a given temperature interval I = (TL, TH), where TL and TH are the temperature lower limit and upper limit, respectively. In this paper, it is assumed that a test should be applied only when the temperature of core Ci (i = 1, 2, ... , n), denoted with Ti, is within the temperature interval I. The problem we address in this paper is to minimize the test application time by generating an efficient SoC test schedule such that the following two constraints are satisfied: (1) the amount of bus width required for concurrently applying different tests is less than or equal to the bus width limit, and (2) any test has to be applied when and only when the temperature of the core is within the given temperature interval. The problem formulation is given in Figure 3. A multi-temperature testing problem can be further formulated as multiple test scheduling problems associated with different temperature intervals. Input: SoC floorplan F including physical parameters of the die and package, A set of test sets for all cores {Si | i = 1, 2, ... , n}, A set of required test-bus widths for all tests {Wi | i = 1, 2, ... , n}, Test-bus width limit B, Temperature upper limit TH and temperature lower limit TL. Output: A test schedule with the minimized test application time. Subject to the following constraints: 1. At any time moment t before the test process is terminated, the total amount of allocated test-bus width W(t) is less than or equal to the bus width limit B, i.e. t, W(t) ! B, where W(t) ::= "jWj(t); 2. At any time moment u when a test is applied to core Ci, the instantaneous temperature Ti(u) of the core Ci is less than the temperature upper limit TH, and greater than the temperature lower limit TL, i.e. TL < Ti(u) < TH. Figure 3. Problem formulation
III.
SOC TESTING WITHIN A TEMPERATURE INTERVAL
A. Test Set Partitioning and Interleaving In order to sensitize faults at a certain temperature level, a test should be applied to the core only when its temperature is within a temperature interval between an upper limit and a lower limit. Whenever the temperature of a core exceeds the upper limit, the test should be stopped and the core is turned into an idle state in which no dynamic power is dissipated and the core temperature decreases. When the temperature of the core decreases to a certain level, the test can be resumed if the test bus has sufficient width to transport the test data for the core. We define the subset of the test patterns continuously applied to the core as a test sub-sequence, and we consider the period between the applications of two test sub-sequences as a passive cooling period. As such, we can partition the entire test set into a number of test sub-sequences between which cooling periods are introduced, referred to as test set partitioning [6]. Using test set partitioning substantially increases the total test time because of the introduction of long cooling periods
between test sub-sequences and the time overhead for the test controller to switch tests for different cores. Since no test data is transported to/from a core during its cooling periods, the surplus width of the test bus can be allocated to other cores for their test data transportations and test applications, which means that we can utilize the cooling periods for one core to test other cores. In this way, test sets for different cores are interleaved with each other, referred to as test set interleaving [6]. As such, we can reduce the long test time due to introducing cooling periods between the partitioned test sub-sequences. There exists a time overhead when the test controller stops one test and starts/resumes another test [4]. It is very important to select a proper stop-cooling temperature, denoted with TC, for test set partitioning and interleaving. If TC is too high, a test set is partitioned into too many test sub-sequences which are further interleaved with tests for other cores. In such cases, the overall time overhead becomes significantly large, leading to substantially increased test time. On the other hand, if TC is too low, the long cooling time also leads to long test time, making test schedules inefficient. In this paper, we use a heuristic to find a proper stop-cooling temperature for test scheduling. B. Heating Sequence Ideally, we expect that the temperature of a core is always maintained within the given temperature interval whenever a test is applied. However, this condition does not always hold in reality. Sometimes, the core temperature may decrease below the lower limit of the temperature interval. One reason for the decrease in the temperature of a core is that the test patterns consume insufficient power and the amount of heat generated by applying the test patterns is less than the amount of heat dissipated by the physical cooling system. Another reason is that no sufficient bus width is available for a test and it has to be postponed until the bus width requirement is satisfied. If the problem of temperature decrease is not properly addressed in test scheduling, it can cause invalid test schedules where tests may be applied at temperatures below the lower limit and cannot screen the targeted defects. In order to solve this problem, we apply a sequence of dummy patterns that consume sufficiently high power and raise the core temperature towards the lower limit TL. We refer to such a high-power test pattern as a heating pattern (HP) and a sequence of heating patterns as a heating sequence (HS). It should be noted that transporting a heating pattern through the test bus requires the same amount of bus width as transporting a test pattern. The minimal length of a heating sequence (denoted with Lmin) preceding a test sub-sequence is the number of heating patterns needed to raise the core temperature to TL. If the test subsequence following a heating sequence does not consume sufficiently high power and causes the core temperature to decrease, the required length of the heating sequence (denoted with Lreq) should be larger than Lmin. The actual value of Lreq depends on the temperature profile of the succeeding test subsequence. Figure 4 shows the temperature profiles of a core stimulated with a heating sequence and a test sub-sequence consecutively, depicted with doted and solid curves, respectively. The core temperature is Ts when the HS starts. Three lengths are chosen for the HS, namely L1, L2, and L3, while the length of the succeeding test sub-sequence is M. The HS is too short in Figure 4(a) and too long in Figure 4(b), causing the core temperature going out of the interval (TL, TH) during the test application period. The HS is given a proper length in Figure 4(c) such that the core temperature reaches a
medium value (denoted with TM) between TL and TH before the test starts and remains inside the interval during the test application period. TH
Temperature
TM TL
TS L1
M (a)
L2
M (b)
L3
M
Time
(c)
Figure 4. Impact of heating sequence length
In order to avoid frequently violating the temperature limits due to improperly determining the lengths of heating sequences, we propose a preprocessing approach for each test set S, before we perform the test scheduling algorithm. We define an observation frame (OF) for each test pattern of a test set, and the OF contains D consecutive test patterns. For each OF, we calculate the average power consumption POF of all test patterns in the OF. We categorize an observation frame to be a lowpower frame (LPF) if its POF is smaller than a threshold power value PTHD, or a high-power frame (HPF) if otherwise. PTHD is defined as a power consumption value that ultimately causes the core temperature to reach a steady-state at TM. We perform a series of steady-state temperature analysis to find PTHD. Before scheduling a test sub-sequence, we must determine the required length Lreq of its preceding HS. If the OF associated with the first test pattern of the test sub-sequence is a LPF, Lreq should be equal to the number of heating patterns that heats the core to TM. Otherwise, Lreq should be equal to Lmin. C. Finite State Machine for Thermal Management As a part of the test scheduling algorithm, we develop a finite state machine to control the states of cores. A core has the following states: heating, testing, cooling, waiting, and complete, defined as follows. (1) Testing: the core is tested within the temperature interval (TL, TH). (2) Cooling: the core is passively cooled down without any test pattern applied, and its temperature is decreasing from TH towards TL. (3) Heating: the core is actively heated by heating patterns and its temperature is increasing. (4) Waiting: the core is waiting for allocation of sufficient amount of test-bus width for its test and the temperature of the core is usually below TL. (5) Complete: the core has finished its test. Figure 5 depicts the temperature profile of a core and illustrates the relation of core state and temperature. When the test scheduling process starts, we assume that all cores are at the waiting state and their temperatures are equal to the ambient temperature TA (TA < TL). Each core is associated with a dedicated flag start, indicating that the core is chosen for test if it is equal to 1, or is not chosen for test if otherwise. A core remains within the waiting state until it is selected for test. From the waiting state, a core can move to the heating state if its temperature T is below TL, or to the testing state if T is
already within the imposed temperature interval. In the heating state, a core is applied with heating patterns and its temperature increases to TL or TM, depending on whether the observation frame of the succeeding test pattern is an HPF or LPF, respectively. As soon as the core temperature T exceeds TL or TM, the state of the core is changed to the testing state. The core stays in the testing state as long as its temperature T remains inside the temperature interval if the test is not finished. Otherwise, the core moves to the cooling state when T exceeds TH, or the waiting state when T falls below TL, or the complete state when the test is finished. In the cooling state, a core is supposed to be cooled down until T reaches to a stop-cooling temperature TC (TC TL), after which the core moves to the testing state if it is selected for test, or remains in the cooling state until it is moved to the waiting state if it is not selected for test. The entire SoC test finishes after all cores reach the complete state. Figure 6 illustrates the five states and the transitions between the states. It should be noted that a cooling period ends at the stopcooling temperature TC where TC TL. The purpose of introducing TC is to further reduce test time, especially when cooling a core to TL needs substantially long time. We have developed a heuristic, denoted with ALG0, to search for the best TC between TL and TH. The heuristic is an iterative algorithm that sets a new TC for each iteration step and invokes the proposed test scheduling algorithm to calculate the TAT with respect to the current TC. The heuristic returns the TC with which the TAT is the shortest among all iterations. Temperature
complete
TH TM TC TL cool
cool
test
cool
test
test
heat
test
heat
wait
wait
Time
Figure 5. Core states w.r.t. changes of temperatures start = 0 & T !"TL
start = 1 & T ! TL
start = 1 & T ! TL (HPF) or T ! TM (LPF)
heating
waiting T ! TL start = 0 & T ! TL
cooling
start = 1 & TL < T < TH T
TH
start = 1 & T < TH & TL < T (HPF) or TM < T (LPF)
testing
start = 1 & TC < T < TH start = 0 & T > TL
Finished
start = 1 & TL < T < TH
complete
Figure 6. Finite state machine model for temperature management
D. Test Scheduling Algorithm We propose a test scheduling algorithm to generate a test schedule that meets the temperature and test-bus width requirements. The algorithm employs a thermal simulator ISAC [21] to obtain instantaneous temperature values which are used by the proposed finite state machine to control state transitions for every core. The ISAC thermal simulator takes the floorplan of a chip and the power consumption of every core as inputs, considers the thermal influence between neighborhood cores, and calculates the temperatures of all cores at every simulation cycle. The scheduling algorithm uses the FSM to update the state of every core at every simulation cycle, and maintains a queue of cores in the waiting state in order to activate some cores for test, if available. The scheduling algorithm terminates when all cores reach the complete state. Figure 7 describes an algorithm ALG1 that activates cores for test. ALG1 takes the queue (Q) of all cores in the waiting state as an input. According to the ratio r of the number of remaining test patterns to the current temperature of each core (Line 1), ALG1 selects as many cores as possible to start/resume their tests, if their bus width requirements can be met. A core that has a relatively larger number of remaining test patterns and is relatively colder gets a higher value of r and hence is given higher priority to be scheduled for test. As such, the scheduling algorithm takes into account the impact of the distance between cores on the temperature, since a core located further away from a hot core is more likely to have a lower temperature than the direct neighbors of the hot core. By allocating the required bus width to the selected cores (Line 5) and changing their states to testing (Line 6), the algorithm activates as many cores as possible for test. ALG1. ACTIVATE(Queue of cores in the waiting state :: Q) 01 Sort Q decreasingly according to r where r = number of remaining test patterns / core temperature 02 C = GetFrontElement(Q); 03 while (RemainingBusWidth() > 0 & IsNotEmpty(Q)) loop 04 if (RequiredBusWidth(C) RemainingBusWidth()) then 05 AcquireBusWidth(C); 06 ChangeState(C, testing); 07 RemoveElement(C, Q); 08 end if 09 C = GetNextElement(Q); 10 end while Figure 7. Pseudo-code of the algorithm activating cores for test
IV.
EXPERIMENTAL RESULTS
We select ISCAS’89 benchmark designs as cores of 6 different SoCs. The number of cores in these SoCs varies from 4 to 42. The cores have different physical sizes, depending on their complexity. We use a cycle-accurate power estimation method proposed in [17] to calculate the power consumption (in watt) of a core according to the amount of switching activity. Taking the floorplan of a SoC and the power consumption profiles of individual cores as inputs, the thermal simulator, ISAC, calculates instantaneous temperatures of all individual cores at every cycle of the test process. The assumed scan frequency is 100MHz. We employ the proposed test scheduling technique to generate test schedules for the SoCs. Two groups of experiments are performed to generate different test schedules for each SoC with respect to different temperature intervals (at low, medium, and high temperature levels) as well as to
different test-bus width limits (low, marginal, and high), respectively. Table 1 shows the impact of the temperature interval on the TAT. The first column lists the numbers of cores in the SoC designs. Columns 2, 4, and 6 list the TATs (in number of cycles) of the generated test schedules with respect to different temperature intervals. Columns 3, 5, and 7 list the CPU times (in seconds) for the generation of the corresponding test schedules. The test-bus width limit for the experiments in this group is 60 bits. The experimental results show that the test schedule length decreases along with increasing temperature level at which the tests should be applied. This is because it takes a longer time to cool down a core when a test is applied at a lower temperature level. TABLE 1. TATS WITH DIFFERENT TEMPERATURE INTERVALS (B=60) # of Cores 4 8 16 25 36 42
TL=65C, TH=80C TL=85C, TH=100C TL=105C, TH=120C CPU CPU CPU TAT TAT TAT Time (s) Time (s) Time (s) 59887 347 29651 171 19562 115 61014 404 30256 180 20194 124 64658 411 31023 195 21055 138 71913 433 35785 214 24798 152 74886 477 37249 221 26402 168 76102 490 37989 243 27031 174
Table 2 shows the impact of the test-bus width on the TAT. The first column lists the number of cores in the SoC designs. Columns 2, 4, and 6 list the TATs (in number of cycles) of the generated test schedules with respect to different test-bus width limits. Columns 3, 5, and 7 list the corresponding CPU times (in seconds) the generation of the corresponding test schedules. The imposed temperature interval for the experiments in this group is 85-100°C. It can be seen that the length of test schedule decreases with increasing test-bus width limit. TABLE 2. TATS WITH DIFFERENT BUS WIDTH LIMITS (TL=85°C, TH=100°C) # of Cores 4 8 16 25 36 42
B=40 CPU TAT Time (s)
B=60 CPU TAT Time (s)
B=80 CPU TAT Time (s)
29821 30261 31623 38391 38568 39785
29651 30256 31023 35785 37249 37989
29648 29752 34613 35415 35936 36430
145 182 210 252 267 264
171 180 195 214 221 243
177 197 218 230 245 251
The third group of experiments compares the TATs of test schedules generated using different stop-cooling temperatures, either TC found by ALG0 or the given lower limit TL. Table 3 shows the impact of the stop-cooling temperature on the TAT. The fist column lists the number of cores in the designs. Columns 2 and 4 list the TATs of test schedules using TL and TC as the stop-cooling temperature, respectively. Columns 3 and 5 show the CPU times (in seconds) for test scheduling. The TAT reduction (in percentage) is listed in Column 6. The experiments in this group are performed with a temperature interval 85-100°C and a test-bus width limit of 60 bits. It is seen that using the TC found by ALG0 reduce the TAT by up to about 9% rather than using TL. Similar results are shown in Table 4 where the temperature interval is 65-80°C and the test-bus width limit
is 60 bits. With this temperature interval, the TAT reduction is up to about 20%. The third group of experimental results indicates that using TC rather than TL for test scheduling leads to a greater reduction on the TAT when the temperature interval is imposed at a lower temperature level. On the other hand, the CPU time for test scheduling becomes substantially longer because of the increased time for determining TC. TABLE 3. TATS WITH/WITHOUT TC (B=60, TL =85°C, TH =100°C) # of Cores 4 8 16 25 36 42
Use TL (85°C) as TC TAT 29651 30256 31023 35785 37249 37989
CPU Time (s) 171 180 195 214 221 243
4 8 16 25 36 42
Use TL (65°C) as TC TAT 59887 61014 64658 71913 74886 76102
CPU Time (s) 347 404 411 433 477 490
[2]
[3]
[4]
Use TC found by ALG0 TAT 28711 29142 29779 33654 34372 34627
TAT CPU Time Reduction (s) 1265 3.17% 1327 3.68% 1402 4.01% 1511 5.96% 1776 7.72% 1843 8.85%
TABLE 4. TATS WITH/WITHOUT TC (B=60, TL =65°C, TH =80°C) # of Cores
REFERENCES [1]
Use TC found by ALG0 TAT 52691 52746 55376 59162 60701 60935
CPU Time (s) 2340 2366 2587 2830 2865 2884
TAT Reduction 12.02% 13.55% 14.36% 17.73% 18.94% 19.93%
V. CONCLUSIONS In this paper, we demonstrate the need for multi-temperature testing and address the problem of long test application time when applying multi-temperature testing to systems-on-chip. We propose a test scheduling technique to minimize the test application time such that a test is applied only when the core temperature is within a given interval and the test-bus width limit is satisfied. The proposed test scheduling technique employs a thermal simulator to partition and interleave test sets on-the-fly and uses a finite state machine to manage the state transitions for all cores. Experimental results show that, in general, the test application time is longer when a test is applied at a lower temperature level and/or with a lower test-bus width limit. Moreover, the test application time can be further reduced by stopping the cooling periods at an explored temperature rather than at the imposed temperature lower limit, especially for the tests applied at a low temperature level.
[5]
[6]
[7]
[8]
[9]
[10]
[11] [12]
[13]
[14]
[15] [16]
[17]
[18] [19] [20]
[21]
B. H. Calhoun, and A. P. Chandrakasan, “Ultra-dynamic voltage scaling using sub-threshold operation and local voltage dithering,” IEEE J. SolidState Circuits, Vol. 41, No. 1, pp. 238-245, Jan. 2006. K. Chakrabarty, “Design of system-on-a-chip test access architectures under place-and-route and power constraints,” Proc. ACM/IEEE Des. Autom. Conf., 2000, pp. 4332-437. I. M. Filanovsky, and A. Allam, “Mutual compensation of mobility and threshold voltage temperature effects with applications in CMOS circuits,” IEEE Trans. Circuits Syst., Vol. 48, No. 17, pp. 876-884, Jul. 2001. S. K. Goel and E. J. Marinissen, “Control-aware test architecture design for modular SoC testing,” Proc. IEEE Eur. Test Work., 2003. pp. 57-62. S. Gunther, F. Binns, D. M. Carmen, and J. C. Hall, “Managing the impact of increasing microprocessor power consumption,” Intel Technol. J., Q. 1, pp. 1-9, 2001. Z. He, Z. Peng, P. Eles, P. Rosinger, and B. M. Al-Hashimi, “Thermalaware SoC test scheduling with test set partitioning and interleaving,” J. Electron. Test.: Theory Appl., Vol. 24, No. 1-3, pp. 247-257, Jun. 2008. U. Ingelsson, S. Goel, E. Larsson, and E. J. Marinissen, “Test scheduling for modular SOCs in an abort-on-fail environment,” Proc. IEEE Eur. Test Symp., 2005, pp. 8-13. A. Larsson, E. Larsson, P. Eles, and Z. Peng, “Optimized integration of test compression and sharing for SOC testing,” Proc. Des. Autom. Test Eur. Conf., 2007, pp. 207-212. E. Larsson and Z. Peng, “Power-aware test planning in the early systemon-chip design exploration process,” IEEE Trans. Comput., Vol. 55, No. 2, pp. 227-239, Feb. 2006. R. Mahajan, “Thermal management of CPUs: a perspective on trends, needs and opportunities,” (Keynote), Proc. Int. Work. Therm. Invest. ICs Syst., 2002. E. J. Marinissen, S. K. Goel, and M. Lousberg, “Wrapper design for embedded core test,” Proc. IEEE Int. Test Conf., 2000, pp. 911-920. R. R. Montanes, J. P. Gyvez, and P. Volf, “Resistance characterization for weak open defects,” IEEE Des. Test Comput., Vol. 19, No. 5, pp. 18-26, Oct. 2002. W. Needham, C. Prunty, and E. H. Yeoh, “High volume microprocessor test escapes, an analysis of defects our tests are missing,” Proc. IEEE Int. Test Conf., 1998, pp. 25-34. P. Nigh, D. Vallet, A. Patel, and J. Wright, “Failure analysis of timing and IDDq-only failures from the SEMATECH test methods experiment,” Proc. IEEE Int. Test Conf., 1998, pp. 43-52. B. Pouya and A. Crouch, “Optimization trade-offs for vector volume and test power,” Proc. IEEE Int. Test Conf., 2000, pp. 873-881. P. Rosinger, B. M. Al-Hashimi, and K. Chakrabarty, “Thermal-safe test scheduling for core-based system-on-chip integrated circuits,” IEEE Trans. Comput. Aided Des. Integr. Circuits Syst., Vol. 25, No. 11, pp. 2502-2512, Nov. 2006. S. Samii, E. Larsson, K. Chakrabarty, and Z. Peng, “Cycle-accurate test power modeling and its application to SoC test scheduling,” Proc. IEEE Int. Test Conf., 2006, pp. 1-10. J. Segura, and C. F. Hawkins, “CMOS electronics: how it works, how it fails,” Wiley-IEEE Press, Apr. 2004. G. Singer, “The challenges of nanotechnology and giga-technology,” (Keynote), Proc. IEEE Int. Test Conf., 2007. D. Wolpert, and P. Ampadu, “A sensor to detect normal or reverse temperature dependence in nanoscale CMOS circuits,” Proc. IEEE Int. Symp. Defect Fault Tolerance in VLSI Syst., 2009. Y. Yang, Z. P. Gu, C. Zhu, R. P. Dick, and L. Shang, “ISAC: Integrated Space and Time Adaptive Chip-Package Thermal Analysis,” IEEE Trans. Comput. Aided Des. Integr. Circuits Syst., Vol. 26, No. 1, pp. 86-99, Jan. 2007.