rst concentration. This is a multiple linear regression model with two regres- ... :)r)
uglas C. Montgomery,F,lizabeth A. Peck, and Geoffrey Vining. ', rieht @ 2006 ...
HAPTER
3
Multiple Linear Regression
-:gression model that involves more than one regressor variable is called a : -rltiple regression model. Fitting and analyzing these models is discussedin this .rter. The results are extensions of those in Chapter 2 for simple linear -:cssion.
1I
\IULTIPLE
REGRESSION MODELS
.-rose that the yield in pounds of conversion in a chemical process depends on " rcrature and the catalyst concentration. A multiple regression model that *:t describethis relationship is
l:
F o - tF f i r + F z x r * e
(3 . 1 )
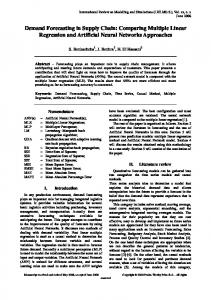
-:e ,1, denotes the yield, x, denotes the temperature, and x2 denotes the ,.rst concentration. This is a multiple linear regression model with two regres- '.ariables. The term linear is used becauseEq. (3.1) is linear function a of the ..:r()wnparameters Be, Br, and B,r. . ne regression model in Eq. (3.1) describes a plane in the three-dimensional .-: of l, xt, and xr. Figure3.la shows this regressionplane for the model E(y):50*10x,t7x, ;r-d we have assumedthat the expected value of the error term e in Eq. (3.1) is - ,. The parameter Bo is the intercept of the regressionplane. If the range of the : - r i n c l u d e s1 1 : x z : 0 , t h e n F o i s t h e m e a n o f y w h e i l x t : x 2 : 0 . O t h e r w i s e has no physical interpretation. The parameter Fr indicates the expected ,nse iil response (y) per unit change in x, when x, is held constant. Similarly measures the expected change in y per unit change in x, when x, is held :r:triflt. Figure 3.1b shows a contour plot of the regressionmodel, that is, lines of
.luction to Linear RegressionAnalysis, Fourth Edition. :)r)uglas C. Montgomery,F,lizabeth A. Peck, and Geoffrey Vining. ',rieht @ 2006 John Wiley & Sons, Inc.
63
64
MULTIPLE LINEAR REGRESSION
-:tt_i
f
L
|l
*
ii(,R
240 2AO 160 E(y)12o 80 4A 0 0L 0
6
(a)
I
10x1
(b)
Figure3.1 (a) ttre regression plane for the model E(y) :50
+ L0rr -r 7xr. (b) The contour plot.
constant expected response E(y) as a function of x, and xr. Notice that the contour lines in this plot are parallel straight lines. In general, the response y may be related to k regressor or predictor variables. The model
f : F o i -F f l t t
Fzxz+ ...+ Bpxpt e
(3.2)
is called a multiple linear regression model with k regressors. The parameters F.,. j :0,1,...,k, are called the regression coefficients. This model describes a hyperplane in the k-dimensional space of the regressor variables xr. The parameter Bt represents the expected change in the response y per unit change in x when all of the remaining regressor variables xi(i + /) are held constant. For this reason the parameters Fi, j : 1,2, . . . , k, are often called partiat regression coefficients. Multiple linear regression models are often used as empirical models or approximating functions. That is, the true functional relationship between y and xy x2,. . ., xk is unknown, but over certain ranges of the regressor variables the linear regression model is an adequate approximation to the true unknown function. Models that are more complex in structure than Eq. (3.2) may often still be analyzed by multiple linear regression techniques. For example, consider the cubic polynomial model
!:Fo*Ffi*Fzxz+Brx3+e
( 3 . 3|
(3.4)
which is a multiple linear regressionmodel with three regressorvariables.Polyno mial modelswill be discussedin more detail in Chapter 7. Models that include interaction effectsmay also be analyzedby multiple linear regressionmethods.For example,supposethat the model is ! : B o - f F f i r t F z x z* F n x r x , * e
r- .lr
xE.H ir -J
tir.l_rS
L
(3.5)
t
u--*Oc- s fu ::rrJ
tl
t}
fraa {tbtrlll
!j
rr-..si
a
:5al trFr grr: of *
I
tl:n I :o ,r - -.: lnt, ksa
tlMs
$c1 ffi