variation (Garland and Adolph 1991, and references there) existed prior to the .... work was supported by National Science Foundation grants BSR-9006083 and ... The deer flees, the wolf pursues: incongruencies in predator-prey coevolution.
-
Vol. 140, No. 3
-
The American Nat~~ralist
September 1992
NOTES AND COMMENTS
RATE TESTS FOR PHENOTYPIC EVOLUTION USING PHYLOGENETICALLY INDEPENDENT CONTRASTS Most studies of evolutionary rates, except those concerning laboratory populations, use data from fossils to measure amounts of change occurring over time (e.g., Raup and Crick 1981; Cracraft 1984; Stanley 1985; Futuyma 1986; Bookstein 1987, 1988, 1989; Campbell and Day 1987; Gingerich 1987; Rosenzweig et al. 1987; Forey 1988; MacFadden 1988; McNamara 1990; Taylor and Larwood 1990; Fenster and Sorhannus 1991). For many phenotypic traits and for many kinds of organisms, however, fossil information is either sparse or unavailable (e.g., physiological or behavioral traits, such as maximal running speed or home range area [Garland 1983; Garland et al. 1988; Garland and Losos, in press; Janis, in press]; organisms such as Drosophila [Parsons 1987, 19911). Evolutionary-rate tests based on comparative data from living species may, therefore, greatly extend the types of traits and organisms that can be studied and compared (e.g., Coyne and Orr 1989; Lynch 1990; Vogl and Wagner 1990). Possible explanations for variation in evolutionary rates are discussed elsewhere (e.g., Futuyma 1986; Bookstein 1987, 1988, 1989; Campbell and Day 1987; Coyne and Orr 1989; Vrba 1989; Lynch 1990; Vogl and Wagner 1990; Fenster and Sorhannus 1991 ; Janis, in press) and will not be considered here. Recently, Lynch (1990) has described a test for comparing evolutionary rates within a clade with those predicted under the neutral theory of phenotypic evolution. His test requires estimates of divergence times (as may be derived from paleontological information andlor molecular clocks) and of the expected rate at which mutation adds new phenotypic variance to populations. Here, I consider a different but complementary problem, that of comparing rates of phenotypic evolution among clades. I show that phylogenetically independent contrasts (Felsenstein 1985) allow simple and statistically valid comparisons of evolutionary rates among monophyletic groups of extant (or extinct) species. The proposed test requires the genealogy (or cladogram) for all included species, as well as estimates of phylogenetic branch lengths, but it does not require information on mutation rates. As well, the clades to be compared do not need to be sister clades. Because organisms are related hierarchically, data for living species generally lack biological and hence statistical independence (e.g., Grafen 1989; Harvey and Pagel 1991; Harvey and Purvis 1991; Martins and Garland 1991). As noted by Am. N;tt. 1992. Vol. 140. pp. (09-519 1992 hv The Univclh~tyof Chicago. (K)03-0147/92/4003-(K)08'F02.00. All light5 rc\erved.
,vc)
1
Body Mass
sprint Speed
(kg)
(Wh)
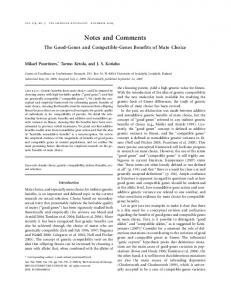
251.3 93.4 2.5 11.6 Canis lupus 35.3 Canis latrans 13.3 Lycaon pictus 20 Canis aureus 8.8 Urocyon cinereoargenteus 3.7 vu1pes ful4.8 Eyaena hyaena 26.8 Crocutta crocutta 52 Acinonyx jubatus 58.8 Panthera pardus 52.4 Panthera tigris 161 Panthera leo 155.8 Diceros bicornis 1200 Ceratotherium simum 2000 Eguus hemionus 200 Equus caballus 350 235 Eguus burchelli 1075 Giraffa camelopardalis Syncems caffer 620 Bison bison 865 Taurotragus oryx 511 Gazella granti 62.5 Gazella th-onii 20.5 Antilope cervicapra 37.5 Hadogua kirki 5.0 Oreamnos m r i c a n u s 113.5 Ovis canadensis nelsoni 85 Hippotragus eguinus 226.5 Aepyceros melampus 53.25 COMoChaetes taurinus 216 Damaliscus lunatus 130 Alcelaphus buselaphus 136 Antilocapra americana 50 Ce-s canadensis 300 Dama dama 55 Alces alces 384 Kangifar tarandus 100 57 adocoileus virginianus 74 Odocoileus hemionus
48 48 16 30 64 65 70 56 64 72 50 65 110 60 56 59 45 25 70 70 70 60 57 56 70 81 81 105 42 33 48 56 47 80 70 80 100 72 65 56 80 64 61
m/F
Ratio
MC/E Ratio
Borne Range
(lrm2) .220 ,200 -265 -313 -437 ,426 .395 .434 ,473 .a83 .313 -365 -438 .401 .345 .348 .360 ,327 -872 .806 .784 1.416 -572 .680 .813 1.105 1.138 1.051 -780 ,448 .780 .762 1.128 ,818 1.004 ,924 1.000 .956 -971 .933 .947 1.002 -963
82.8 56.8 0.09 0.87 394.0 45 160 9.1 1.1 4.3 152.8 25 62.1 23.2 69.6 236 15.6 6.65 35 22.5 165 84.6 138 133 87.5 20 5.3 6.5 0.04 22.75 14.33 80 3.8 75 2.2 5.0 9.65 12.93 0.43 16.09 30 1.96 2.85
NOTES AND COMMENTS
511
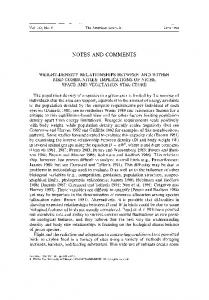
Felsenstein (1985), however, phenotypic data for the N tip species of any monophyletic group can be transformed into N - 1 independent "contrasts" or differences. For example, in the phylogeny shown in figure 1, one contrast would be the phenotypic value for Ursus horrihilis minus that for Ursus americanus; another would be the mean for these two bears minus the mean for the two mustelids, Mephitis mephitis and Meles meles (see Felsenstein 119851 for details of computations and weightings). If the characters in question have evolved by independent Brownian motion along each branch, the contrasts are statistically independent. This property derives from the general property of a normal distribution that for any three points sampled from it, for example, A , B, and C, the quantity A B is independent of I(A - B)/2] - C. Furthermore, each such contrast is an index of the minimum amount of evolutionary change that has occurred since divergence from the most recent common ancestor of two tips or nodes. Independent contrasts can be brought to a common variance if information on branch lengths-in units of expected variance of change-is available (see Felsenstein 1985; Martins and Garland 1991; Garland et al. 1992). For example, if the trait in question has evolved by a Brownian-motion-like process, then expected variance of change is directly proportional to time (see also Bookstein 11987, 1988, 19891 on expectations under models of random walks for discrete time). In other words, under a Brownian-motion model of character change, the possible difference between two sister species increases with time; more specifically, the variance of the difference between two species is proportional to the sum of the branch lengths leading to them from their most recent common ancestor. Given that branch lengths are available, each contrast can be standardized by dividing it by the square root of the sum of its branch lengths, which is its standard deviation (Felsenstein 1985). Although Felsenstein originally proposed using standardized independent contrasts in statistical tests for correlated evolution (Felsenstein 1985, 1988; Burt 1989; Grafen 1989; Harvey and Pagel 1991; Harvey and Purvis 1991; Martins and Garland 1991; Garland et al. 1992), I argue that they are equally useful for comparisons of evolutionary rates of different clades. The important point tiere is that the absolute value of each standardized contrast provides one independent index of the minimum amount of phenotypic evolution that has occurred as one hypothetical ancestor diverged to yield two daughter species (which may be tips -
FIO. I.-(Jirc.irlg ptrgc) Hypothesi~edphylogenetic relationships and divergence times for. 16 species of Carnivora and 27 species of ungulates. Data for five phenotypic characters are listed to the right of the phylogeny (average adult body mass, maximal sprint running speed, metatarsal-femur ratio, metacarpal-humerus ratio. and home-range area-from Garland 1983; Garland et al. 1988; Janis, in press). The phylogenetic information was compiled by Garland and Janis (1992; see text). Timing of basal split between Carnivora (Ursidae, Mustelidae, Canidae, Hyaenidae, and Felidae) and ungulates (Rhinoceratidae, Equidae, Giraffidae, Bovidae, Antilocapridae, and Cervidae) is 70 million yr; the shortest branch segment depicted is 0.5 million yr. A complete listing of branch lengths, suitable for input to the CMSINGLE program of Martins and Garland (1991), is available from the author.
Metacarpal/Hurnerus Ratio
D 0 000135 --
.-2
'
P
0
D
5
0.00009--
0
*
0
*-
0
0
0
Q)
0 00 0
00.00045--
00 0
0
aJ
-03 n
O 0.00007
aJ
3 -
ln 0 D
a
.
; o ~ . . ~ O , @ 0
0
0 0
2500
"oa
;m.@~o
0
0
;
0
5000
7500
10000
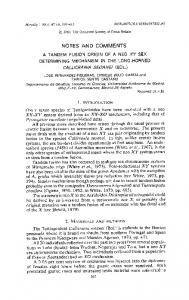
Standard Deviation of Contrast
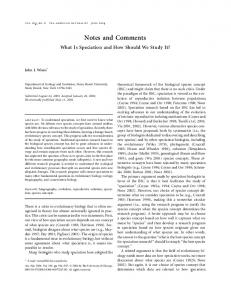
FIG.3.-Comparison of evolutionary rates for loglobody mass of 16 species of Carnivora and 27 species of ungulates. Symbols are as in fig. 2.
NOTES AND COMMENTS
513
or nodes on a phylogenetic tree), scaled by the square root of time (although branch lengths in other units are possible; see below). From a clade of N species, therefore, N - I independent indices of the minimum rate of phenotypic evolution within that clade can be extracted. To compare the mean rate of evolution among clades we need simply to compare the central tendencies of the distributions of absolute values of standardized independent contrasts. For each clade, we may expect the distribution to approximate one-half of a normal distribution (Bookstein 1987, p. 459). Thus, such nonparametric statistical tests as Mann-Wh~tney U or Kruskal-Wall~s(Sokal and Rohlf 1981) seem appropriate for hypothesis testing. Alternatively, if the distributions can be made approximately normal with appropriate transformations, t-tests or analysis of variance can be used. As an example of the proposed rate test, consider the phylogeny and data for tip species presented in figure 1. These phylogenetic relationships were compiled by Garland and Janis (1992), who provide further references. In brief, ungulate relationships are based primarily on cladistic analyses of morphological traits, supplemented by molecular information, and with splitting times estimated from first fossil appearances (Hooijer 1978; Bennett 1980; Janis 1982; Groves and Grubb 1987; Janis and Scott 1987; Prothero et al. 1988; Gentry 1990; Miyamoto et al. 1990). Relationships for Carnivora are based primarily on molecular data sets (Wayne et al. 1989, and references there). Hypothesized phylogenetic relationships change frequently because systematics is an active area of research. It is therefore important to publish the actual phylogeny used in studies such as the present, so that reanalysis is possible when enhanced phylogenetic information becomes available. As a convenient visual depiction, figure 2 plots the absolute values of standardized independent contrasts for metacarpal-humerus ratio (MCIH, an index of "cursoriality"; Janis, in press) versus their standard deviations (computed with the "CMSINGLE" program of Martins and Garland (19911). No correlation is apparent, which is expected if the branch lengths adequately standardize the independent contrasts. However, the standardized contrasts for the ungulate clade are, on the average, considerably greater in magnitude than are those for the Carnivora. (The basal contrast between the two clades cannot be assigned to either, so it is not used in the comparison.) As the data do not appear normally distributed, 1 have compared their means with a nonparametric Mann-Whitney U-test (using SPSSIPC version 3.0). The difference is highly significant ( U = 19.0, exact two-tailed P < .0001). A similar comparison of metatarsal-femur ratio (MTIF) also indicates a significantly higher rate of evolution in the ungulates ( U = 73.0, exact two-tailed P = .0010). Thus, limb proportions seem to have evolved at different rates in these species representing samples of two clades. However, neither body mass nor maximal sprint running speed has evolved at different rates (both log,,, transformed prior to analysis; mass, U = 177.0, exact two-tailed P = .6396; speed, U = 180.5, exact two-ta~ledP = .6981). Figure 3 shows the comparison of standardized independent contrasts in body mass. For body mass, running speed, and limb proportions (e.g., figs. 2, 3), branch
+
a)
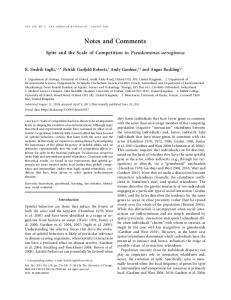
log Home Range Area
0
2500
5000
7500
10000
Standard Deviation of Contrast
b)
log Home Range Area, log Branch Lengths
Standard Deviation of Contrast
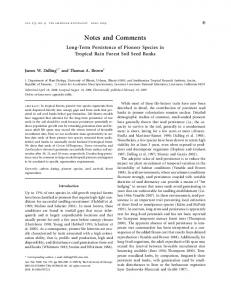
FIG.4.-a, Details are as in figs. 2 and 3 but for log,, home-range area. Note 1.egative trend, indicating that contrasts involving long branch segments are overstandardized relative to those involving short branches (times). b, Details are same as a but with branch lengths of fig. I log,, transformed prior to computations. These transformed branch lengths appear to adequately standardize contrasts in log,, home-range area (see also Garland et al. 1992). Symbols are as in fig. 2.
NOTES AND COMMENTS
515
lengths in units of time appear to yield adequate standardization of independent contrasts. But this will not always be true. Although the theories of Brownian motion (Felsenstein 1985, 1988) and of random walks (Bookstein 1987, 1988, 1989) as applied to phenotypic evolution indicate that the square root of the sum of elapsed time is appropriate for temporal scaling of estimated amounts of divergence, this is really an empirical issue (with some support, e.g., Lynch 1990). Thus, plots such as figures 2 and 3 might sometimes ind~catethat branch lengths (or tip data) should be transformed (e.g., logarithms, squares) in an attempt to eliminate correlations between standardized independent contrasts and their standard deviations (see Garland et al. 1992). In fact, when log home-range area is considered, figure 4a shows a negative trend (Pearson's v = -0.299, two-tailed P = .055), indicating that contrasts involving longer branch segments tend to be "overstandardized." Such a pattern may be interpreted as a violation of Brownian-motion evolution. Divergence seems not to occur without limit; instead, evolution slows down over longer time periods within both Carnivora and ungulates. A log,, transform of the branch lengths of figure 1 has the effect of reducing the standard deviations of contrasts involving long branch segments (e.g., rhinos vs. equids) relative to the standard deviations of contrasts involving short branch segments (e.g., Odocoileus vivgini~rnusvs. Odocoileu.\ hemionus). When log-transformed branch lengths are used to standardize contrasts (fig. 4h), the negative trend seen in figure 4~1disappears (Pearson's v = 0.021, two-tailed P = ,895; see also figs. in Garland et al. 1992). Based on the standardized contrasts of figure 4h, log home-range area has not evolved at different rates in the two clades (fig. 4h: U = 180.0, exact two-tailed P = .6981). Branch lengths in units other than time may also be used (cf. Bookstein 1987, p. 461; Grafen 1989; Martins and Garland 1991; Garland et al. 1992). Possible branch lengths include genetic distances (e.g., Coyne and Orr 1989) or the number of changes in other characters (i.e., not those whose rate of evolution is to be compared) estimated to have occurred along each branch, as might be available from a cladistic analysis of either morphological or genetic character data. Although branch lengths in units of time have intuitive appeal for yielding "rate" comparisons, we are really just dealing with ratios estimating (minimum) standardized amounts of divergence, and the scaling metric to be used depends on the biological question one wishes to address (e.g., What are rates of evolution per unit time, per generation, or per unit genetic distance'?). Note also that the branch lengths are used in the basic computation of all contrasts involving other than two species at the tips of a phylogeny (see formulas in Felsenstein 1985; computer programs accompanying Martins and Garland 1991). What biological significance can be attached to the foregoing results? First, consistent with the concept of mosaic evolution (Futuyma 1986; Fenster and Sorhannus 1991), some traits evolve at different rates in Carnivora as compared to ungulates (hind limb proportions), whereas others do not (size, speed, home range). Second, the observation that limb proportions evolve more rapidly in the ungulates is consistent with Janis's (in press) analyses showing that limb proportions similar to those of living forms appear sooner in the fossil record for ungu-
5 16
THE AMERICAN NATURALIST
lates than for carnivores (see also Bakker 1983). Third, the five traits analyzed here do not diverge on the same time scales. Limb proportions, log body mass, and log maximal running speed seem to diverge linearly with the square root of elapsed time. The logarithm of home-range area, however, seems to diverge approximately linearly with the square root of the logarithm of elapsed time. Thus, home-range area seems to diverge relatively rapidly at first, but then divergence slows as if some limits were being reached. Empirical examples similar to this are presented by Lynch (1990). As well, Grafen (1989, p. 145), in his discussion of ways to standardize independent contrasts, notes that "it is perfectly possible that different characters should have different sets of [branch] lengths." The idea that home-range area, which may be considered primarily a behavioral trait, evolves more rapidly than do the three morphological traits (MCIH ratio, MTIF ratio, body mass) or the organismal performance trait (maximum sprint speed; sensu Garland and Losos, in press) is consistent with the long-standing idea that behavior generally evolves more rapidly. In addition to simple parametric and nonparametric comparisons of central tendency, other statistical tests might be used to compare independent contrasts. For example, absolute values of nonstandardized independent contrasts could be regressed on their standard deviations and analysis of covariance used to compare slopes. In this case, regression through the origin seems appropriate since, in general, no evolutionary divergence is expected to have occurred prior to a speciation event. On the other hand, some divergence may have occurred if geographic variation (Garland and Adolph 1991, and references there) existed prior to the speciation event(s) leading to the clades being compared. Applying such a test to the data and phylogeny of figure 1 results in complications due to substantial heteroscedasticity and an apparently low statistical power (results not shown). Alternatively, one might wish to examine absolute values of standardized independent contrasts in relation to time (cf. Bookstein's [I9871 fig. 6 and [I9881 fig. 8; see also Grafen 1989; Garland et al. 1992). However, in addition to the conceptual and statistical problems discussed by Bookstein (1987, 1988, 1989), problems would arise in assigning particular contrasts to specific times, since each involves three points (basal node plus two tips or nodes) corresponding to (potentially) three different times. Two other recent studies have considered evolutionary rate tests that are somewhat different from and complementary to the one proposed here. Bookstein (1987) uses the term "reduced speed" for a ratio of absolute amount of change divided by the square root of time. He provides tests for comparing reduced speeds of fossil sequences with those that might occur under random evolution. Bookstein (1987, p. 458) argues that such ratios are not actually evolutionary rates in the sense that "random walks have no rates" (see also Fenster and Sorhannus 1991). Moreover, scaling phenotypic differences by their square roots explicitly "reject(s) the possibility of linear scaling, and with it all conventional notions of evolutionary rate" (Bookstein 1988, p. 377). Returning to comparisons of contemporary clades, Vogl and Wagner (1990) propose considering several characters simultaneously and using Mantel's test for vector correlations to compare clades in terms of their within-clade variances. This test requires having data for at least six or seven characters and gives an
NOTES A N D COMMENTS
517
indication of differences in clade-specific "evolutionary fexibilities"; it does not require information on within-clade phylogenetic relationships. Vogl and Wagner (1990) also consider comparing the evolutionary flexibilities of two traits within a single clade on the basis of a simple ratio of their variances and suggest using computer simulation models to estimate appropriate degrees of freedom for hypothesis testing against an F distribution (cf. Martins and Garland 1991). In summary, Felsenstein's (1985) standardized independent contrasts can be used to compare monophyletic groups in terms of estimated minimum rates of phenotypic evolution. The proposed test requires only phenotypic data for species at the tips of a phylogeny, as are commonly available to comparative biologists studying extant organisms. (Although fossil information is not required, it can be incorporated into the analysis simply by adding fossil species as additional bifurcations whose branches terminate before the present. If so used, one must of course verify that the branch lengths adequately standardize the contrasts, as in figs. 2-4.) Both a complete phylogenetic topology and branch lengths are also required for the analysis. Lest this requirement seem too onerous, it should be noted that studies of evolutionary rates using fossil sequences also require phylogenetic information in that fossils from successive strata must be "known" to represent ancestor-descendant lineages (Fenster and Sorhannus 1991). As with any phylogenetically based comparative method, errors in the available topology may lead to inaccuracies; however, the effects of topological inaccuracies have yet to be studied (see also Grafen 1989; Harvey and Page1 1991; Martins and Garland 1991) and are beyond the scope of this note. Errors in branch lengths may also lead to inaccuracies; Martins and Garland (1991, pp. 550-551) provide limited simulation results (see also Grafen 1989), and one empirical example suggests that errors in branch lengths may have relatively little effect (Garland et al. 1992). Deviations from the assumed model of character evolution (e.g., pure Brownian motion) will be equivalent to introducing errors into branch lengths (e.g., in units of time). In many cases, such problems can be detected by plots as in figures 2-4 and can be corrected by suitable transformation of characters or of branch lengths (e.g., fig. 4b; see also Garland et al. 1992). The monophyletic groups to be compared by the proposed method need not be sister clades, and branch lengths in units other than time can be employed. As well, the present test requires no information on mutation rates, unlike existing tests comparing rates of phenotypic evolution with predictions from neutral theory (Lynch 1990). Analysis of variance or nonparametric equivalents are used to compare means of the absolute values of standardized independent contrasts. Extensions to multiple characters (see also Fenster and Sorhannus 1991) should be possible through multivariate analysis of variance (cf. Bookstein 1988) or perhaps by using a statistic of multivariate distance when computing independent contrasts (cf. Lynch 1990). ACKNOWLEDGMENTS
1 am very grateful to C. M. Janis for allowing me to use unpublished data gathered for our ongoing analyses. S. C. Adolph, R. Bleiweiss, A. R. Dickerman, D. H. Geary, A. R. Ives, R. E. Jung, W. P. Maddison, G. C. Mayer, and two
518
THE AMERICAN NATURALIST
reviewers provided helpful discussions and/or comments on the manuscript. This work was supported by National Science Foundation grants BSR-9006083 and BSR-9157268 (Presidential Young Investigator Award). LITERArURE
CITED
Bakker, R. T. 1983. The deer flees, the wolf pursues: incongruencies in predator-prey coevolution. Pages 350-382 in D. J. Futuyma and M. Slatkin, eds. Coevolution. Sinauer, Sunderland, Mass. Bennett, D. K. 1980. Stripes do not a zebra make. Systematic Zoology 29:272-287. Bookstein, F. L. 1987. Random walk and the existence of evolutionary rates. Paleobiology 11: 258-271. -. 1988. Random walk and the biometrics of morphological characters. Evolutionary Biology 23:369-398. . 1989. Comment on a rate test. Evolution 43:1569-1570. Burt, A. 1989. Comparative methods using phylogenetically independent contrasts. Oxford Surveys in Evolutionary Biology 6:33-53. Campbell, K. S. W., and M. F. Day. 1987. Rates of evolution. Allen & Unwin, London. Coyne, J . A , , and H. A. Orr. 1989. Patterns of speciation in Drosophila. Evolution 43:362-381. Cracraft, J. 1984. Conceptual and methodological aspects of the study of evolutionary rates, with some comments on bradytely in birds. Pages 95-104 in N . Eldredge and S. Stanley, eds. Living fossils. Springer, New York. Felsenstein, J. 1985. Phylogenies and the comparative method. American Naturalist 125:l-15. -. 1988. Phylogenies and quantitative characters. Annual Review of Ecology and Systematics 19:445-471. Fenster, E. J . , and U. Sorhannus. 1991. On the measurement of morphological rates of evolution: a review. Evolutionary Biology 25:375-410. Forey, P. L. 1988. Golden jubilee for the coelacanth L