12 Vol 8 No. 1 April 2014
Journal of Geomatics
OBCsvmFS: Object-Based Classification supported by support vector machine Feature Selection approach for hyperspectral data D. Chutia1, D.K. Bhattacharyya2, R. Kalita1 and S. Sudhakar1 North Eastern Space Applications Centre, Department of Space, Government of India. Umiam - 793103 Meghalaya, India 2 Department of Computer Science and Engineering, Tezpur University, Napaam 784028 Assam, India Email:
[email protected];
[email protected];
[email protected];
[email protected]
1
(Received: Nov 23, 2013; in final form Mar 14, 2014)
Abstract: During last few decades, significant efforts have been made to investigate the effectiveness of the conventional multispectral classification approaches on hyperspectral data. Object-based classification approaches have been investigated in the classification of high spatial resolution satellite data and found to be more efficient as compared to the other classifiers. However, object-based classification approaches have not been explored much in hyperspectral remote sensing, because of huge dimensionality of data. In this work, a novel classification framework characterized by effective features selection technique is proposed for hyperspectral data. It is called as ‘OBCsvmFS’Object-Based Classification supported by Support Vector Machine Feature Selection. Effectiveness of other features selection techniques on the performance of a few other classifiers is also investigated and a comparative assessment was carried out through experimental demonstrations using Hyperion satellite data. The proposed classification framework outperforms the existing classification approaches investigated here. It is also concluded that SVM-based feature selection technique can play an important role in designing an effective object-based image analysis (OBIA) classification framework. Keywords: Classification, Features selection, Hyperspectral remote sensing, Multi-resolution segmentation, ObjectBased Image Analysis (OBIA) 1. Introduction Contiguous, narrow bandwidth of hyperspectral data makes possible detail assessment of earth surfaces which would be otherwise not possible with the relatively coarse bandwidths acquired by multispectral sensors. Availability of large number of spectral bands with considerable information in hyperspectral data has offered significant potential for materials recognition (Jensen, 1996) within a wavelength range of interest and presents new challenges for the development of advanced classification algorithms. Major difficulty found in hyperspectral remote sensing is the huge dimensionality of data that gave rise to ‘Hughes’ phenomenon (Hsu, 2007), which refers to the fact that sample size required for training a specific classifier grows exponentially with the number of spectral bands. However, better consideration should be given to the collection of training data that characterize the range of land surface variability at the spatial scale of the image (Pal and Mather, 2006). 1.1 Hyperspectral classifications Most routinely used conventional classifiers have considerable difficulties while dealing with high resolution data and they produce a characteristic, inconsistent classification results (Marangoz et al., 2006). Recently, researchers and scientists have developed advanced classification approaches for hyperspectral remote sensing data. Artificial neural network (ANN, Atkinson and Tatnall, 1997), decision tree (DT, Lu and Weng, 2007), WAVANGLET (Schmidt et al.,. 2007), border vector detection adaption (BVDA, Kasapoglu and Esroy, 2007), © Indian Society of Geomatics
averaged learning subspace method (ALSM, Bagan et al., 2008), independent component analysis (ICA, Kosaka et al., 2005) and nonlinear principal component analysis (NLPCA, Licciardi et al., 2012) are found effective for the classification of hyperspectral remote sensing data in a supervised mode. Over the last few decades, conventional and formerly widely accepted statistical classification methods have been superseded by recent machine learning algorithms. For example, multiple classifier systems (MCS, Du et al., 2011) and support vector machines (SVMs, Melgani and Bruzzone, 2004) have been reported as an efficient alternative to hyperspectral remote sensing. Genetic optimization framework (Bazi and Melgani, 2006), geostatisticsaided approach (Bahriaa et al., 2010), relevance vector machines (RVMs, Demir and Ertuk, 2007), incremental import vector machines (IVM, Roscher et al., 2012), support vector data description (SVDD, Sakla et al., 2011), learn multiple-kernel SVMs (Sun et al., 2013) are recent additions into the domain of SVM classification framework. An embedded-featureselection (EFS, Archibald and Fann, 2007) algorithm supported by SVMs was proposed to perform both band selection and classification simultaneously. Marconcini et al. (2009) proposed a novel composite semisupervised SVM with significant increase in classification accuracy as compared to supervised SVMs with composite kernels. Ensemble approaches are now getting new vistas in machine intelligence and pattern recognition applications. Random forest (RF) framework in binary hierarchical classifier (BHC, Ham et al., 2005), AdaBoost (Chan et al., 2012) etc. are few popular
13 Journal of Geomatics ensemble classification systems. Robust support vector method (Camps-Valls et al., 2004), wavelet domain statistical classifier (Zhang et al., 2005), and regularized maximum likelihood classifier (RMLC, Mayer et al., 2007) can be put forward as an ensemble classification system for hyperspectral data. Chi et al. (2009) proposed an effective ensemble classification approach where generative Gaussians model is combined with support cluster machine discriminative models with a minimal set of training data. In a few studies, SVMs with Markov random field (MRF, Tarabalka et al., 2010) classifiers were applied effectively in hybrid mode and found to be with improved performance as compared to other conventional MRF models and SVM classifiers. 1.2 Object-based approaches Object-based image analysis (OBIA) represents a significant classification trend in remote sensing as concluded by Blaschke (2010). Sheeren et al. (2009) have proposed OBIA as an alternative to the pixelbased classification approaches for very high-spatialresolution images. Object-oriented classifier of eCognition (Harken and Sugumaran, 2005) was effectively used for classification of wetlands. Very recently, an OBIA-based approach (d’Oleire-Oltmanns et al., 2013) is reported to have extracted landforms at multiple scales from two distinct data types. Krigingbased soft classification (KBSC, Das and Singh, 2009) is an effective nonparametric geostatistical approach where ground hyperspectral signatures were used to detect subpixel targets. On the other hand, in a semisupervised learning (SSL, Li et al., 2013) algorithm both hard and soft labels were exploited using soft sparse multinomial logistic regression to enhance the performance. In OBIA, a number of attributes or features are associated with each of the image objects and attribute values of those can be derived. Selection of optimal set of features for classification of unknown image objects is a very crucial step and very important for designing effective classification system. Many features selection techniques have been reported and out of those SVM (Archibald and Fann, 2007), Gabor wavelets (Shen et al., 2013), and sparse multinomial logistic regression (SMLR, Zhong et al., 2008) etc. are effectively used. eCognition software is one of the most successful software in OBIA domain where feature space optimization (FSO, Baatz et al., 2001) is used to define optimal set of features to improve the classification performance. However, effectiveness of SVM for defining optimal set of features has not been reported in any OBIA based classification approaches. Here, it is proposed to utilize the SVM based feature selection technique instead of FSO in eCognition and assess the performance in terms of accuracy over a few widely used advanced classification approaches.
Vol 8 No.1 April 2014 1.3 Dimensionality reduction The dimensionality of hyperspectral data is a major drawback when applying traditional approaches of pattern recognition to a hyperspectral image (Mader et al., 2006). Principal Component Analysis (PCA) is a well established dimensionality reduction technique which can reduce data in fewer independent bands with noncorrelated information and are often more interpretable than the source data. ICA (Hyvärinen and Oja, 2000) transforms a set of mixed, random signals into components that are mutually independent and the advantage over PCA is that IC transformation can distinguish features of interest even when they occupy only a small portion of the pixels in the image. However, ICA is computationally more expensive, which limits its application to high-dimensional data analysis (Du et al., 2006) and is more relevant for classification. The minimum (or maximum) noise fraction (MNF, Green et al., 1988) is a second major algorithm belonging to the family of PCA techniques and effectively used in hyperspectral data processing (Harris et al., 2006; Yang et al., 2009). However, it requires prior estimation of signal and noise covariance matrices and it is computationally more expensive as compared to PCA. In this work, it is proposed to apply PCA to reduce data dimensionality and mitigate the Hughes phenomenon. Comparatively, PCA is much simple as it does not require prior statistical information and is computationally robust and efficient. 2. Data and methodology Hyperion sensor data of NASA’s Earth Observing (EO-1) satellite was used for investigation. It is the first spaceborne hyperspectral instrument to acquire both visible/near-infrared (400-1000nm) and shortwave infrared (900-2500nm) spectral data in 220 potential bands with a spatial resolution of 30 m with 7.6 km swath. Band specification of Hyperion data acquired on August 13, 2006 is given in Table 1. Table 1: Band specification of Hyperion data Sl. Bands Wavelength (nm) Spectral No. region 1 8-15 426.81-498.04 B 2 16-25 508.22-599.80 G 3 26-34 609.97-691.37 R 4 35-57 & 701.55-1991.96 NIR 77-184 5 185-220 2002.06-2355.21 MIR The test site investigated here is located in the southern part of Jorhat city, Assam, India. It is mainly a flat area and represents a typical rural landscape with agricultural land use, tree-clad areas and tree plantation. Rural residential areas are usually surrounded by agricultural fields growing rice, vegetables, etc.
14 Journal of Geomatics
Vol 8 No.1 April 2014
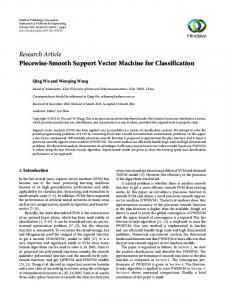
The classification is exclusively performed for previously classified land use, for which training data had been collected in the same vegetation period. The training dataset had been prepared with reference to the existing classified map, other satellite data sources of same period. Training datasets in the form of GIS layers were supplied and 40% of total training sets were used for performance assessment of classifier. PCA of the bands in each of the spectral region was carried out and then selected the first PC which gives the maximum spectral information. Finally, bands of images are represented by the first PC of bands of each spectral region (Fig.1). An example of color composite (CC) is given in Fig. 2.
with compactness ‘hcomp’ and smoothness ‘hsm’. The weight parameters (wspec and wsh) allow adapting the heterogeneity definition to the application. There is a difference between scale and spatial resolution of image: the higher the value of scale, the larger the resulting image objects. Hence, it is suggested to do the segmentation analysis in different levels of scale instead of analyzing the same in different resolutions (Benz et al., 2004). A 2-scale level approach was adopted as mentioned below: i) Small image objects on level 1 have meaningful spectral features, e.g. settlements, tree-clad, tea plantation etc. ii) Groups of settlements, tree-clad, tea plantation aggregated to the level 2 along with agricultural crop areas.
Fig. 1: PCA flowchart
Fig. 2: CC of PC bands
OBCsvmFS is realized through the following steps:
Multi-resolution segmentation on the images based on spectral and shape homogeneity Application of SVM method for ranking or selection of optimal features derived from the image objects Classification using fuzzy nearest neighbor (NN)classifier on a set of optimal features defined by SVM
2.1 Multi-resolution segmentation
A detailed discussion on multi-resolution segmentation with the associated features derivable from segmented objects can be found in Baatz and Schäpe (2000) and eCognition guide. However, some of the important features are discussed here while illustrating results in the discussion section. Table 2: Parameters in multi-resolution algorithm Test level S wspec wsh wcomp wsm T1
Multi-resolution segmentation, which minimizes the heterogeneity and exploits respective homogeneity for a given number of objects, was applied. Here, scale (S) determines the maximum allowed heterogeneity for the resulting image objects based on spectral and shape in eCognition. In each loop, every image object is handled once and the loops continue until no further merger is possible. Heterogeneity (h) considers as primary object features representing spectral and shape of an object and can be defined as follows (Benz et al., 2004):
h wspec .hspec wsh .hsh
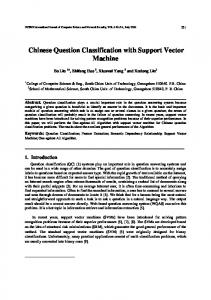
A number of tests have been carried out to assess the dependency of scale parameter along with other parameters of the multi-resolution algorithm on the quality of image objects of interest. Four test levels with different scales and other parameters are illustrated in Table 2. Level 2 is the main classification level and parameter applied in Test level T3 is found to be more effective for classification. Image objects creation during Test level T3 in L1 and L2 are depicted in Fig 3 and Fig 4 respectively.
T2 T3 T4
L1 L2 L1 L2 L1 L2 L1 L2
15 30 25 35 15 30 20 40
0.7 0.8 0.7 0.5 0.8 0.7 0.4 0.7
0.3 0.2 0.3 0.5 0.2 0.3 0.6 0.3
0.8 0.5 0.7 0.3 0.8 0.8 0.7 0.8
0.2 0.5 0.3 0.7 0.2 0.2 0.3 0.2
(1)
wspec 0,1, wsh 0,1, wspec wsh 1 The spectral heterogeneity ‘hspec’ is the sum of the standard deviations of an object in each of the PC and the shape heterogeneity ‘hsh’ of an object is associated
Fig. 3: T3-L1
Fig. 4: T3-L2
2.2 SVM-based optimal features selection Features of each of the image object are characterized by spectral, spatial and textural morphological properties, however all features are not equally
15 Journal of Geomatics
Vol 8 No.1 April 2014
influential to the performance of classifier. In eCognition, FSO defines the optimal set of features in terms of best class separable distances. Here, WEKA’s (Hall et al., 2009) SVM-based attribute ranking (SVMAttributeEval, Guyon et al., 2002) was utilized instead of using ecognition’s FSO technique. It is called as svmFS. In svmFS, the significance of an attribute is evaluated by using an SVM classifier where attributes are ranked by the square of the weight assigned by the SVM. SVM defines the decision function D(f) with weights wi on an input vector patterns fk of n dimensional feature vectors as (Cortes and Vapnik, 1995):
D f w f b
(2)
w k y k xk
(3)
k
where, w is the weight vector representing training patterns, yk encodes the class label as binary value (+1 or -1), αk is soft margin parameters and b= is the bias value. Guyon et al. (2002) have explained in detail regarding feature selection and ranking using SVM (Cortes and Vapnik, 1995), where one variant of the soft-margin algorithm was used effectively. For comparison, an investigation was carried out to assess the performance of classifier with the optimal sets of features defined by three other features selection techniques; CfsSubsetEval (cfsSE, Hall, 1998), ConsistencySubsetEval (consistSE, Liu and Setiono, 1996) including eCognition’s FSO. The assessment was done through kappa index agreement (KIA) analysis on the same sets of hyperion data and illustrated subsequently. Table 3 illustrates the performances of fuzzy NN-classifier in terms of KIA while using different sets of optimal features defined the above techniques. 2.3 Fuzzy NN-classifier In OBIA, fuzzy NN-classifier (Benz et al., 2004; Chutia et al., 2012) has been successfully used for classification of multispectral remote sensing data. It searches for the closest sample image object in the feature space defined by fuzzy membership grading on a set of optimal features and classification is carried out through the following steps: The dissimilarity measure dsu between the sample object Os and the unknown object Ou in the optimal feature space can be computed as follows (Guyon et al., 2002):
v sf v uf d su f 1 f n
vs
vu
2
(4)
where f and f are the respective object feature values on feature f. σf is the standard deviation of the feature values for f, used for standardizing the various
features with varying ranges of values. A multidimensional membership function using Gaussian function can be defined as:
(d su ) e
( z n d su ) 2 2 n2
(5)
where zn and σn are the centre and width of the fuzzy set µ(dsu) respectively. Fuzzy classification (Benz et al., 2004) defines an m-dimensional tuple of membership degrees, which describes the degree of classification assignment µ of the unknown object Ou to the m considered classes as
FC , Ou C1 (Ou ), C2 (Ou ),... Cm (Ou )
(6)
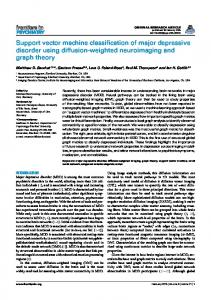
An unknown object Ou is assigned to a class if its membership grading is highest for that said class. An example of experimental result is depicted in Fig 5. 3. Results 3.1 Analysis on features selection Optimal set of features selected by each of the techniques is given in Table 3 with their effectiveness on the performance of OBIA based classification system in terms of KIA and overall accuracy (OA). Total number of features in the Table 3 is 9, here dimension or feature space means the number of features defined by the features selection techniques. It was observed that both svmFS and consistSE enhanced the performance of OBIA classification system as compared to its own FSO (Table 4). The study also reveals that dimension does not play the most significant role on the performance of any classification system; however, as experimentally observed, the type of optimal features defined by each of the feature selection technique can influence the performance. Features space with higher dimension often increases the computation time and produces inconsistent results. Here, mNDVI is mean normalized difference vegetation index of image objects and found as one of the effective features in all the feature selection techniques (Table 3) for improving classification accuracy. It is observed that classifiers with svmFS results in higher classification accuracy with 0.88 KIA as compared to other approaches and it plays an important role in the performance of OBCsvmFS classification framework proposed here. 3.2 Evaluation of performance An investigation was carried out to examine the effectiveness of svmFS optimization technique in OBCsvmFS as well as in some other advanced classifiers. This section illustrates the comparative
16 Journal of Geomatics performances of LibSVM (Chang and Lin, 2011), linear logistic regression model (Landwehr et al., 2005), K-NN with KDTree (Aha and Kibler, 1991), bagging a classifier (Breiman, 1996) with random forest (RF, Breiman, 2001), random sub space (Ho, 1998) with RF, and multi-layer perceptron (MLP, (Baraldi et al., 2001) classifier approaches. LibSVM is the most popular machine learning open source library and computationally the most efficient approach since it uses LibSVM to build the SVM classifier. Here, LibSVM with svmFS provides higher classification accuracy (85% OA) (Table 4) than while employed with cfsSE, consistSE, and FSO. On the other hand, OA of K-NN classifier is also found satisfactory with svmFS; here, KDTree is effectively used as a searching technique. RF in bagging and random subspace are realized here as an ensemble classification framework and have also shown a satisfactory performance while employed with svmFS. However, performance of MLP with cfsSE classifier is comparatively better than while using svmFS and others. The proposed classification framework outperforms the above classification approaches with 0.88 KIA and 91% OA. However, performance of a few other classifiers is also found satisfactory while employed with consistSE and FSO (Table 3 and Table 4). A detailed analysis on the performance of the proposed classification framework is illustrated in the next section.
Vol 8 No.1 April 2014 characteristics are classified satisfactory with shape index. In such situation, shape index has an important role since it defines the number of pixels forming an image object and its association with neighboring image objects. The study indicated that there were still some misclassifications taking place because of the shadow effects produced by clouds and hilly slopes. It was visible in a few areas in the classification of settlements that are mixed with vegetation. In this study, it was observed that performance of SVMs both in classification and features selection is greatly enhanced. Some of the important observations with reference to the OBCsvmFS have been made during the study and are concluded below: Problem occurred due to Hughes phenomenon was minimized effectively by applying PCA on the bands of each of the spectral region. In OBIA, SVMs have tremendous potential to define optimized feature space to enhance the classification performance. Hyperspectral images exhibit strong dependencies across spatial and spectral neighbors, which need to be explored and established to be useful for improving classification accuracy. Integration of morphological profiles of image objects can further improve the accuracy of OBIA approaches. Extraction of endmembers is always a key issue in the pre-processing of hyperspectral analysis; however, it is difficult to establish a relation between endmembers of a specific feature with field data because of the data quality. However, advanced classification approaches needs to achieve a high degree of classification accuracy with a minimal set of training data.
Fig. 5: One classification result by OBCsvmFS
5. Summary
4. Discussion
Recent technology is more biased toward usages of nonparametric and soft classification framework as compared to parametric classification approaches; the biggest challenge is to deal with very high-spatialresolution hyperspectral data. The proposed approach achieved the best accuracy in this case study, but it needs to be investigated under different circumstances to assess its performance over other approaches.
Conventionally, OBIA based approaches have been found more robust and efficient in the classification of high spatial resolution spaceborne as well airborne data. Proposed classification approach is a kind of multistage classification framework supported by dimensional reduction of spectral bands and effective SVM-based feature selection technique where soft classification approach under OBIA has been projected. It outperforms the other advanced classifiers as described here. Classification has been illustrated with five major land use classes, namely rice crop areas (current fallow), tea plantation, tree-clad areas, wetted rice crop fields, and settlements mixed with vegetation (Fig. 5). Actual tea grown areas within tea plantation and tree-clad areas having similar band mean and brightness
Further research is required to realize the proposed approach in an ensemble mode to achieve better results. The results reported here is quite encouraging, but further efforts are required to evaluate the quality of results of each of the intermediate algorithms such as PCA, multi-resolution segmentation and features selection to get the best performance of the proposed approach.
17 Journal of Geomatics Acknowledgment Authors acknowledge North Eastern Space Applications Center, Umiam, Shillong, Meghalaya, India for providing necessary supports during the study. References Aha, D. and D. Kibler (1991). Instance-based learning algorithms. Machine Learning. 6(1): 37-66. Archibald, R. and G. Fann (2007). Feature selection and classification of hyperspectral images with support vector machines. Geoscience and Remote Sensing Letters, IEEE, 4(4): 674-677. Atkinson, P. and A. Tatnall (1997). Neural networks in remote sensing. International Journal of Remote Sensing, 18(4), 699–709. Baatz, M. and A. Schäpe (2000). Multiresolution segmentation: An optimization approach for high quality multi-scale image segmentation. Angewandtegeographischeinformationsverarbeitung, 12(12):12-23. Baatz, M., U. Benz, S. Dehghani, M. Heynen, A. Höltje, P. Hofmann, I. Lingenfelder, M. Mimler, M. Sohlbach, M. Weber and G. Willhauck (2001). eCognition user guide, Definiens Imaging GmbH, Munich, 310p. Bagan, H., Y. Yasuoka, T. Endo, X. Wang and Z. Feng (2008). Classification of airborne hyperspectral data based on the average learning subspace method. IEEE Trans. Geosci. Remote Sens., 5(3): 368 – 372. Bahriaa, S., N. Essoussia and M. Limam (2010). Hyperspectral data classification using geostatistics and support vector machines. Remote Sensing Letters, 2(2): 99-106. Baraldi, A., E. Binaghi, P. Blonda, P.A. Brivio and A. Rampini (2001). Comparison of the multilayer perceptron with neuro-fuzzy techniques in the estimation of cover class mixture in remotely sensed data. IEEE Trans. Geosci. Remote Sens, 39(5): 9941005. Bazi, Y. and F. Melgani (2006). Towards an optimal SVM classification for hyperspectral remote sensing images. IEEE Trans. Geosci. Remote Sens., 44(11): 3374-3385. Benz, U.C., P. Hofmann, G. Willhauck, I. Lingenfelder and M. Heynen (2004). Multi-resolution, objectoriented fuzzy analysis of remote sensing data for GISready information. ISPRS Journal of Photogrammetry and Remote Sensing, 58(3), 239-258.
Vol 8 No.1 April 2014 Blaschke, T. (2010). Object based image analysis for remote sensing. ISPRS Journal of Photogrammetry and Remote Sensing, 65(1), 2-16. Breiman, L. (1996). Bagging predictors. Machine Learning. 24(2): 123-140, 1996. Breiman, L. (2001). Random Forests. Machine Learning. 45(1): 5-32. Camps-Valls, G., L. Gomez-Chova, J. CalpeMaravilla, J.D. Martin-Guerrero, E. Soria-Olivas, L. Alonso-Chorda and J. Moreno (2004). Robust support vector method for hyperspectral data classification and knowledge discovery. IEEE Trans. Geosci. Remote Sens., 42(7): 1530–1542. Chan, J.C.W., P. Beckers, T. Spanhove and J.V. Borre (2012). An evaluation of ensemble classifiers for mapping Natura 2000 heathland in Belgium using spaceborne angular hyperspectral (CHRIS/Proba) imagery. International Journal of Applied Earth Observation and Geoinformation, 18, 13–22. Chang, C.C. and C.J. Lin (2011). LIBSVM: A library for support vector machines. ACM Transactions on Intelligent Systems and Technology (TIST), 2(3), Article no. 27. Chi, M., Q. Kun, J.A. Benediktsson and R. Feng (2009). Ensemble classification algorithm for hyperspectral remote sensing data. Geoscience and Remote Sensing Letters, IEEE, 6(4): 762-766. Chutia, D., D.K. Bhattacharyya and S. Sudhakar (2012). Effective feature extraction approach for fused images of Cartosat-I and Landsat ETM+ satellite sensors. Applied Geomatics, Springer, 4(3): 217-224. Cortes, C. and V. Vapnik (1995). Support-vector networks. Machine learning, 20(3): 273-297. Das, S. K. and R. Singh (2009). Performance of kriging-based soft classification on WiFS/IRS-1D image using ground hyperspectral signatures. Geoscience and Remote Sensing Letters, IEEE, 6(3): 453-457. Demir, B. and S. Erturk (2007). Hyperspectral image classification using relevance vector machines. Geoscience and Remote Sensing Letters, IEEE, 4(4): 586-590. d’Oleire-Oltmanns, S., C. Eisank, L. Dragut and T. Blaschke (2010). An object-based workflow to extract landforms at multiple scales from two distinct data types. Geoscience and Remote Sensing Letters, IEEE, 10(4): 947-951. Du, P., J. Xia, W. Zhang, K. Tan, Y. Liu and S. Liu (2011). Multiple classifier system for remote sensing image classification: A review. Sensors (Basel, Switzerland), 12(4), 4764-4792.
18 Journal of Geomatics Du, Q., I. Kopriva and H. Szu (2006). Independentcomponent analysis for hyperspectral remote sensing imagery classification. Optical Engineering, 45(1), 017008-017008. Green, A.A., M. Berman, P. Switzer and M.D. Craig (1988). A transformation for ordering multispectral data in terms of image quality with implications for noise removal. IEEE Trans. Geosci. Remote Sens., 26(1), 65-74. Guyon, I., J. Weston, S. Barnhill and V. Vapnik (2002). Gene selection for cancer classification using support vector machines. Machine learning, 46(1-3): 389-422. Hall, M.A. (1998). Correlation-based feature subset selection for machine learning. Hamilton, New Zealand. Hall, M., E. Frank, G. Holmes, B. Pfahringer, P. Reutemann and I.H. Witten (2009). The WEKA data mining software: An update. SIGKDD Explorations, 11(1): 10-18. Ham, J., Y. Chen, M.M. Crawford and J. Ghosh (2005). Investigation of the random forest framework for classification of hyperspectral data. IEEE Trans. Geosci. Remote Sens., 43(3): 492–501. Harken, J. and R. Sugumaran (2005). Classification of Iowa wetlands using an airborne hyperspectral image: A comparison of the spectral angle mapper classifier and an object-oriented approach. Canadian Journal of Remote Sensing, 31(2) 167-174. Harris, J.R., P. Ponomarev, J. Shang and D. Rogge (2006). Noise reduction and best band selection techniques for improving classification results using hyperspectral data: Application to lithological mapping in Canada's Arctic. Canadian Journal of Remote Sensing, 32(5), 341-354.
Vol 8 No.1 April 2014 multispectral and hyperspectral remote sensing images. IEEE Trans. Geosci. Remote Sens., 45(2): 3880-3893. Kosaka, N., K. Uto and Y. Kosugi (2005). ICA-aided mixed-pixel analysis of hyperspectral data in agricultural land. Geoscience and Remote Sensing Letters, IEEE, 2(2): 220-224. Landwehr, N., M. Hall and E. Frank (2005). Logistic model trees. Machine Learning, 59(1-2): 161-205. Li, J., J.M. Bioucas-Dias and A. Plaza (2013). Semisupervised hyperspectral image classification using soft sparse multinomial logistic regression. Geoscience and Remote Sensing Letters, IEEE, 10(2): 318-322. Licciardi, G., P.R. Marpu, J. Chanussot and J.A. Benediktsson (2012). An linear versus nonlinear PCA for the classification of hyperspectral data based on the extended morphological profiles. Geoscience and Remote Sensing Letters, IEEE, 9(3): 447-451. Liu, H. and R. Setiono (1996). A probabilistic approach to feature selection - A filter solution. In: 13th International Conference on Machine Learning, 319-327. Lu, D. and Q. Weng (2007). A survey of image classification methods and techniques for improving classification performance. International of Remote Sensing, 28(5), 823-870. Mader, S., M. Vohland, T. Jarmer and M. Casper (2006). Crop classification with hyperspectral data of the HyMap sensor using different feature extraction techniques. In 2nd Workshop of the EARSel SIG on Remote Sensing of Land Use & Land Cover, edited by M Braun (Bonn, Germany) (pp. 96-101).
Ho, T.K. (1998). The random subspace method for constructing decision forests. Pattern Analysis and Machine Intelligence, IEEE Transactions on, 20(8): 832-844.
Marangoz, A.M., M. Oruç, S. Karakış and H. Şahin (2006). Comparison of pixel-based and object-oriented classification using Ikonos imagery for automatic building extraction–Safranbolu testfield. In Fifth International Symposium" Turkish-German Joint Geodetic Days (pp. 28-31).
Hsu, P.H. (2007). Feature extraction of hyperspectral images using Wavelet and matching pursuit. ISPRS Journal of Photogrammetry and Remote Sensing, 62(2), 78-92.
Marconcini, M., G. Camps-Valls and L. Bruzzone (2009). A composite semisupervised SVM for classification of hyperspectral images. Geoscience and Remote Sensing Letters, IEEE, 6(2): 234-238.
Hyvärinen, A. and E. Oja (2000). Independent component analysis: algorithms and applications. Neural networks, 13(4), 411-430.
Mayer, R., J. Antoniades, M. Baumback, D. Chester, J. Edwards, A. Goldstein, D. Haas and S. Henderson (2007). Extending classification approaches to hyperspectral object detection Journal of Applied Remote Sensing, 1(1): 013526-013526.
Jensen, J.R. (1996). Introductory digital image processing, 3rd Ed., Prentice Hall, Upper Saddle River, NJ. Kasapoglu, N.G. and O.K. Ersoy (2007). Border vector detection and adaptation for classification of
Melgani, F. and L. Bruzzone (2004). Classification of hyperspectral remote sensing images with support vector machines. IEEE Trans. Geosci. Remote Sens., 42(8): 1778–1790.
19 Journal of Geomatics
Vol 8 No.1 April 2014
Pal, M. and P.M. Mather (2006). Some issues in the classification of DAIS hyperspectral data. International Journal of Remote Sensing, 27(14), 2895-2916.
Sun, Z., C. Wang, H. Wang and J. Li (2013). Learn multiple-kernel SVMs for domain adaptation in hyperspectral data. Geoscience and Remote Sensing Letters, IEEE, 10(5): 1224-1228.
Roscher, R., B. Waske and W. Forstner (2012). Incremental import vector machines for classifying hyperspectral data. IEEE Trans. Geosci. Remote Sens., 50(9): 3463–3473.
Tarabalka, Y., M. Fauvel, J. Chanussot and J.A. Benediktsson (2010). SVM- and MRF-based method for accurate classification of hyperspectral images. IEEE Trans. Geosci. Remote Sens., 7(4): 736-740.
Sakla, W., A. Chan, J. Ji and A. Sakla (2011). An SVDD-based algorithm for target detection in hyperspectral imagery. Geoscience and Remote Sensing Letters, IEEE, 8(2): 384-388.
Yang, C., J.H. Everitt and H.B. Johnson (2009). Applying image transformation and classification techniques to airborne hyperspectral imagery for mapping Ashe juniper infestations. International Journal of Remote Sensing, 30(11), 2741-2758.
Schmidt, F., S. Doute and B. Schmitt (2007). WAVANGLET: An efficient supervised classifier for hyperspectral images. IEEE Trans. Geosci. Remote Sens., 45(5):1374–1385.
Zhang, X., N.H. Younan and C.G. O’Hara (2005). Wavelet domain statistical hyperspectral soil texture classification. IEEE Trans. Geosci. Remote Sens., 43(3): 615–618.
Sheeren, D., N. Bastin, A. Ouin, S. Ladet, G. Balent and J.P. Lcombe (2009). Discriminating small wooded elements in rural landscape fromaerial photography: a hybrid pixel/object-based analysis approach. International Journal of Remote Sensing, 30(19), 4979–4990.
Zhong, P., P. Zhang and R. Wang (2008). Dynamic learning of SMLR for feature selection and classification of hyperspectral data. Geoscience and Remote Sensing Letters, IEEE, 5(2): 280 – 284.
Shen, L., Z. Zhu, S. Jia, J. Zhu and Y. Sun (2013), Discriminative Gabor feature selection for hyperspectral image classification. Geoscience and Remote Sensing Letters, IEEE, 10(1): 29-33. Sl. Nos 1 2 3 4 5 6 7 8 9
Classifier Lib SVM
Table 3: Accuracy versus optimal set of features Features cfsSE svmFS consistSE FSO Brightness Mean 1st PC [NIR]: mNIR Mean 1st PC [R]: mR Mean 1st PC [G]: mG Maximum difference Mean NDVI: mNDVI StDev 1st PC [NIR]: stdNIR Compactness Shape Index Dimension Kappa Index Agreement (KIA) Overall accuracy (OA) in %
6 0.78
5 0.88
3 0.83
7 0.80
80
91
84
82
Table 4: Comparative assessment of accuracy Using various feature selection techniques cfsSE svmFS Consists FSO KIA OA KIA OA KIA OA KIA OA 0.82 84 0.74 77 0.72 73 0.84 85
K-NN with KDTree Bagging a classifier with RF Random sub space with RF MLP OBCsvmFS
0.74 0.65
75 67
0.82 0.80
83 82
0.81 0.77
82 79
0.71 0.75
73 76
0.74
76
0.80
82
0.70
72
0.76
78
0.80 0.78
82 80
0.79 0.88
81 91
0.81 0.83
83 84
0.71 0.80
73 82