Ashutosh Pandey and V. John Mathews. Department of Electrical & Computer Engineering. University of Utah, Salt Lake City, UT 84112, USA. ABSTRACT.
OFFENDING FREQUENCY SUPPRESSION WITH A RESET ALGORITHM TO IMPROVE FEEDBACK CANCELLATION IN DIGITAL HEARING AIDS Ashutosh Pandey and V. John Mathews Department of Electrical & Computer Engineering University of Utah, Salt Lake City, UT 84112, USA
Index Terms— Feedback, Hearing aids, Adaptive filters 1. INTRODUCTION A hearing aid amplifies the incoming sound to make it audible for people with hearing loss. The maximum gain achievable in a hearing aid is limited by acoustic feedback. An adaptive filter is often used to continuously estimate the feedback path and cancel the acoustic feedback in hearing aids. Figure 1 shows the block diagram of a typical digital hearing aid with a single microphone, speaker and an adaptive feedback canceller implemented in the subband domain1 . Digital hearing aids use discrete signal samples of the microphone signal u(n) and the speaker signal x(n) to perform the necessary signal processing. In Figure 1, the prescribed amplification for a hearing-impaired listener is provided in the subband domain with gain values g(m). The delay d1 is used to adjust the bias in the adaptive filter estimate. The broadband variable gain function gc can be used to adjust the overall output sound level in changing acoustic environments. Adaptive feedback cancellation (AFC) improves the output sound quality and provides an additional gain over the critical gain2 for which the hearing aid is stable [1]. The additional gain made possible by feedback cancellation is termed as the added stable gain (ASG). When the amplification in a hearing aid is more than the limits of the added stable gain, the hearing aid becomes unstable or the quality of the signal degrades to below acceptable levels [1]. 1 In
Figure 1, thin and thick lines indicate scalar and vector quantities whereas m and n denote the time indices for the subband domain and fullband signals, respectively. 2 Critical gain refers to the maximum amplification for which the output signal quality is acceptable without feedback cancellation.
978-1-4577-0539-7/11/$26.00 ©2011 IEEE
301
v(n)
f (n) u(n)
Microphone
AF Acoustic feedback u(m) e(m) −d z 1 + − Delay y(m) w(m)
g(m) Hearing aid Gain x(m)
Synthesis
Acoustic feedback limits the gain provided by hearing aids. Digital hearing aids identify acoustic feedback signals and cancel them continuously in a closed loop with an adaptive filter in the digital domain. This scheme facilitates larger hearing aid gain and improves the output sound quality of hearing aids. However, the output sound quality of hearing aids deteriorates as the hearing aid gain is increased. This paper automatically identifies and suppresses residual acoustical feedback components at frequencies that have the potential to drive the system to instability. The suppressed frequency components are monitored and the suppression is removed when such frequencies no longer pose a threat to drive the hearing aid system into instability. Experimental results obtained with real world hearing aid gain profiles using speech and music signals indicate that the method of this paper provides less distortion in the output sound quality than classical feedback cancelers enabling the use of more comfortable style hearing aids for patients with moderate to profound hearing loss.
In a recent paper [2], we presented an approach that reduces the forward path gain at frequencies in the signal that are more likely to drive the system to unstable behavior. We refer to the frequencies so identified as the offending frequencies (OF). If offending frequencies are detected accurately and gain is reduced in a narrowband frequency region around these frequencies, the gain reduction is not audible for a few offending frequencies [2, 3]. The gain is reduced with narrowband parametric equalization (EQ) filters.
Analysis
ABSTRACT
x(n) gc Analysis
Speaker
Fig. 1. Simplified block diagram of a digital hearing aid with AFC. In [2], offending frequency suppression (OFS) method uses a voice activity detector to accurately detect offending frequencies. While the method works well for speech signals, it is not as suitable for music signals. In this paper, we use additional characteristics of the acoustic feedback signal that is suitable for speech and music signals. Furthermore, the method of this paper tracks the changes in offending frequencies that is not done in [2] or traditional methods that employ similar approaches in other applications. If the changes in the offending frequencies are not tracked, it can result in unwanted gain reductions at several frequencies in the signal over long periods of time. Traditionally, in public address (PA) systems, parametric EQ filters are reset (removed from the forward path) periodically and new offending frequencies are detected upon reset. However, this is not the most desired method because until the offending frequencies are reset, there may be unnecessary distortion in the system. This paper addresses this problem by developing a method that continuously monitor the adaptive feedback canceller coefficients to reset the parametric EQ filters when the offending frequencies change and no longer poses a threat to the stable operation of the hearing aid. Simulation results presented in this paper with real world hearing aid gain profiles, feedback path models and speech/music signals demonstrate substantial performance improvements with the method of this paper over prior art. 2. CLASSICAL METHOD FOR HEARING AIDS For performance comparisons, we will use a subband-based system employing M subbands, which are created with oversampled generalized discrete Fourier transform (GDFT) filter banks [4]. Each subband component operates at L ≤ M times lower sampling rate than the full sampling rate of the system. The adaptive filter coefficient
ICASSP 2011
vector for the ith subband contains Ns coefficients. The normalized least-mean-square (NLMS) adaptation is used to perform adaptive feedback cancellation (AFC) in each subband. 3. OFFENDING FREQUENCY SUPPRESSION (OFS) A block diagram employing offending frequency suppression and the reset algorithm is shown in Figure 2. Detection of offending frequencies is performed by monitoring the energy of the microphone signal in the subband domain ui (n) and using adaptive notch filters tracking behavior on the microphone signal in the fullband u(n). Specifically, the energy monitoring can distinguish feedback components from audio components because the acoustic feedback components are known to grow steadily in successive time intervals whereas the audio components behave otherwise. Additionally, our approach uses the variability of the notch frequency as the other measure to detect the offending frequencies as suggested in [2]. The offending frequency detection scheme is described in Section 3.1. Acoustic feedback AF
u(n) Microphone
New offending frequencies
Energy monitoring + e(m) z −d1 u(m) − Delay
g(m) Hearing aid Gain
Synthesis
v(n)
Parallel notch OF detection
Analysis
f (n)
Parametric EQ filter bank
gc
Speaker
Reset algorithm
for band i) and it (Piu (m)) is greater than or decreased by a small amount, say νu , compared to energy at time m − 1 (Piu (m − 1)) i.e. PiΔ (m) > 0 or PiΔ (m) < νu < 0. Increase in the microphone energy indicates sustained howling whereas small change in the energy may indicate early stages of howling [2]. On the other hand, the energy growth counter γir (m) is reduced by an amount Γl < 0, if the relative change is smaller than a pre-determined negative constant νl to indicate audio components. In other situations, where the relative change in energy PiΔ (m) lies between νl and νu , the energy growth rate is modified with a number that is linear interpolation between Γl and Γu . The amount of change in the energy growth rate value at time m for a given PiΔ (m) is defined by a function Φ(PiΔ (m)) as ⎧ ; PiΔ (m) > νu ⎨ Γu Δ Γl ; PiΔ (m) < νl Φ(Pi (m)) = ⎩ Γu −Γl Δ (Pi (m) − νl ) + Γl ;otherwise νu −νl The complete energy growth rate calculation is described in Table 1. It is easy to see from Table 1 that if the relative change in energy is positive or close to zero in successive time indexes, the growth rate value γir (m) grows. Otherwise, the growth rate value r will tend to a minimum value γm . If the growth rate value γir (m) exceeds a pre-determined threshold Tr , one of the two criteria for band i to have an offending frequency is fulfilled.
Analysis y(m)
w(m)
x(m)
Fig. 2. Simplified block diagram of a digital hearing aid with OFS. Upon detection of an offending frequency, a second-order IIR parametric EQ filter, that is specified by three parameters - the center frequency fp , the depth of suppression p < 1 and quality factor q, is used to suppress the offending frequency [2]. The parameters p and q are fixed in our implementation whereas the parameter fp is derived from the adaptive notch filter. Calculation of the coefficients of the parametric EQ filter in the discrete-time domain for given p, q, fp and the sampling frequency fs is performed as described in [2]. Finally, the reset method that monitors adaptive filter coefficients is described in Section 3.2. 3.1. Detection of Offending Frequencies The offending frequencies are detected independently for each subband. In this section, we explain offending frequency detection in the ideal frequency range of the ith subband - [fil , fiu ], where fil = 2πi M and fiu = 2π(i+1) are the lower and upper frequencies for band i. M Let the microphone signal energy in band i at time m be Piu (m) = uTi (m)ui (m), where ui (m) = [ui (m) ui (m − 1) · · · ui (m − Ns + 1)]T . The relative change in the microphone energy between two successive time intervals PiΔ (m) defined as PiΔ (m) =
Piu (m) − Piu (m − 1) Piu (m − 1)
along with the estimated microphone signal energy Piu (m) and the estimated background noise signal power Pib (m) are used by the counter γir (m) to monitor the energy change for the ith subband at time m. Larger values of the counter γir (m) makes the band i more probable to contain an offending frequency. The counter is incremented by Γu > 0 to indicate possible howling if the microphone signal Piu (m) at time m has sufficient energy (at least Tb times larger than the background noise power3 Pib (m) 3 In this paper, the background noise is estimated with the minimum statistics method according to [5]. The constant δb > 1 used in Table 1 is the slow rising constant required in the minimum statistics method.
Table 1. Detection of offending frequencies in the ith band. Adaptive notch filter update and tracking si (n) = u(n) + ρai (n − 1)si (n − 1) − ρ2 si (n − 2) zi (n) = si (n) − ai (n − 1)si (n − 1) + si (n − 2) Pi (n) = λs Pi (n − 1) + (1 − λs )s2i (n − 1) αa ai (n) = ai (n − 1) + Pi (n)+� si (n − 1)zi (n) a ⎧ l ⎨ 2cos(2πfi ) ; ai (n) > 2cos(2πfil ) ai (n) = 2cos(2πfiu ) ; ai (n) < 2cos(2πfiu ) ⎩ ai (n) ;otherwise am λm am i (n) = � i (n − 1) + (1 − λm )ai (n) γia (n − 1) + 1 ; |ai (n) − am a i (n)| < δq γi (n) = 0 ;otherwise Energy growth monitoring Pib (m) = � min(δb Pib (m − 1), Piu (m)) γir (m − 1) + Φ(PiΔ (m)) ; Piu (m) > Tb Pib (m) γir (m) = 0 ;otherwise r γir (m) = max(γir (m), γm ) Offending frequency detection (when n = Lm) if γia (n) > Ta and γir (m) > Tr ⇒ Offending frequency detected The adaptive notch filter uses the microphone signal u(n) for calculating the center frequency for each parametric EQ filter employed to suppress an offending frequency. In addition, the adaptive notch filters are also used to detect onset of instability along with the energy growth rate counters. We employ a second-order notch filter Hia (z) =
1 − ai (n)z −1 + z −2 1 − ρai (n)z −1 + ρ2 z −2
(1)
for band i. The parameter ai (n) is constrained to adapt between [2cos(2πfiu ), 2cos(2πfil )] to track the frequency range of the ith subband - [fil ,fiu ]. The update equations for the adaptive notch filter realized in direct-form II are summarized in Table 1. In Table 1, λs is a suitable averaging constant, αa is the step size for adaptation and a is a small positive constant to prevent singularities. The second parameter we employ to detect onset of instability is the variability of the coefficients of the notch filter. The variability of the parameter ai (n) from the mean of its past values
302
; κi (m) > δo 0 ;otherwise if γio (n) > To ⇒ Reset EQ filters in the ith frequency range [fil ,fiu ] γio (m) =
1
Specifically, the reset algorithm uses two measurements of the adaptive filter coefficients wi (m). First, a long term average Li (m) of the adaptive filter coefficients for for the ith band at time m is estimated using a single pole IIR filter with averaging constant λl , 0 < λl < 1. This is treated as a measure of the past stable path of the feedback path at time m. A short term average Mi (m) of the adaptive filter coefficients for the ith band at time m is also estimated with an averaging constant λh where the averaging constant is such that 0 < λh < λl < 1. The short term average is treated as a measure of the current state of the feedback path. If the distance between the short term average differs significantly from the long term average for a few iterations, say To , the system assumes that the feedback path has changed for that band. In this event, any parametric EQ filters that fall in the frequency range of that band are removed. The reset algorithm for the ith band at time m is listed in Table 2. In Table 2, the normalized distance κi (m) remains close to 0 if the feedback path is relatively stationary and increases in magnitude when there are changes in the feedback path. The variable γio (m) counts the number of times the normalized distance has been more than a pre-determined threshold δo to trigger reset process. 4. RESULTS AND DISCUSSION This section presents the results from MATLAB simulations of the hearing aid algorithms. The true feedback path was simulated using a 192-tap FIR filter in parallel with a homogeneous quadratic nonlinearity. The nonlinearity simulates the nonlinear distortions in the in a hearing aid system. The harmonic signal strength was 40 dB below that of the output of the linear component. Coefficients for the linear component of the feedback paths were obtained from measurements of an inside-the-ear (ITE) hearing aid. Two feedback paths were used in the experiments. In estimating the feedback paths, the ITE hearing aid was fitted into the earpiece
303
30
20 2 10
3
10
Frequency (Hz)
41 40.5 40 39.5 39 2 10
3
10
Frequency (Hz)
(a)
(b)
20 15 10 5 0 2 10
3
10
Frequency (Hz)
20 15 10 5 0 2 10
3
10
Frequency (Hz)
100 80 60 40 20 2 10
3
10
Frequency (Hz)
110
100
90
80 2 10
3
10
Frequency (Hz)
Insertion gain (dB)
40
(c) Insertion gain (dB)
κi (m) =
DT i (m)Di (m) LT i (m))Li (m)+�r � γio (m − 1) +
50
Hearing loss (dB HL) Hearing loss (dB HL)
Li (m) = λl Li (m − 1) + (1 − λl )wi (m) Mi (m) = λh Mi (m − 1) + (1 − λh )wi (m) Di (m) = Li (m) − Mi (m)
Hearing loss (dB HL)
Hearing loss (dB HL)
Table 2. Monitoring ith band to reset offending frequencies.
Insertion gain (dB)
3.2. Resetting Offending Frequency Suppression (OFS) Filters In practice, new offending frequencies appear because the feedback path of the hearing aid and the signal chracteristics change [1]. We monitor each subband independently to track the changes in different frequency regions. The reset method calculates relative change in the current adaptive filter estimate from its older estimates. if the relative change is larger than a pre-determined threshold, the offending frequencies are reset - parametric EQ filters are removed.
of a Knowles Electronic Manikin for Acoustic Research (KEMAR) that was placed in a quiet location. A large white board on a stand was placed parallel to the face plate of the ITE hearing aid at different distances to create different feedback paths. The white board (reflective surface) was 100 cm and 5 cm away for the first and second feedback path, respectively. The feedback canceller employed a linear FIR system model with 128 coefficients. This undermodeling and the model mismatch attempt to capture the practical situation. Parameters of the subband design were M = 128, L = 16 and fs = 16000. The speech input signals to the hearing aid in experiments were 6 clean speech waveforms of length 80 seconds taken from the TIMIT database. In experiments where music signals were used, 6 music waveforms of length 80 seconds from the album “18 till I die” by Bryan Adam were chosen. The music signals were resampled at 16000 Hz for the experiments in this paper. Colored noise samples to model hardware noise, with the power spectral density reducing at the rate of 3 dB per octave as the frequency increases, were added to simulate a noisy signal with 40 dB signal-to-noise ratio.
Insertion gain (dB)
a am i (n) is monitored with a counter γi (n) as listed in Table 1. If the parameter ai (n) does not vary significantly from its mean as determined by a pre-selected threshold δq , the counter γia (n) grows; otherwise it is reset to 0. If the counter γia (n) gets larger than a predetermined threshold Ta , and the energy growth rate value γia (m) becomes larger than a pre-determined threshold Tr , the system determines that the hearing aid may go unstable (howl) at or around the notch frequency. In such event, a parametric EQ filter whose center frequency is derived from the current value of am i (n) as −1 m 1 cos (a (n)/2) is applied to the output signal and the counters i 2π γia (n), γir (m) are reset to 0.
(d)
40 30 20 10 0 2 10
3
10
Frequency (Hz)
55
50
45
40 2 10
3
10
Frequency (Hz)
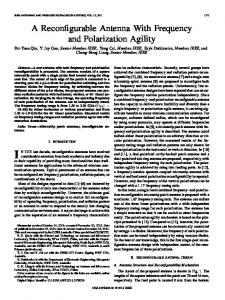
Fig. 3. Hearing loss profile and insertion gain of, (a) mild-gently sloping hearing loss (b) moderately-flat hearing loss (c) moderatesteeply sloping hearing loss (d) profound-gently sloping hearing loss. To assess performance of the classical system and the method of this paper, four hearing aid profiles - mild-gently sloping loss4 , moderate-flat loss, moderate-steeply sloping loss and profoundgently sloping loss and the corresponding insertion gain profiles – as shown in Figures 3a - 3d were used. The insertion gains for the hearing loss profiles used in this paper were obtained with the NAL-RP prescription [1] and are shown in Figures 3a - 3d. The initial value of hearing aid gain was set to 20 dB below the target gain. Subsequently, the gain was slowly increased for 20 seconds at the rate of 1 dB/second to reach the target gain level. The adaptive feedback cancellation experiment ran for 80 seconds in each case. The last 10 seconds of the experiment were deemed as the steady state. The perceptual quality of the output speech from the steady state was measured in each simulation using the perceptual evaluation of speech quality (PESQ) measures [6]. PESQ provides perceptual quality rating of a speech segment between −0.5 and 4.5 and can be interpreted as follows. The highest score indicates that the speech signal is virtually identical to the clean speech segment. The PESQ scores between −0.5 and 1 indicate that the distortions in the speech signal are very high and the segment sound unacceptably annoying. The ratings of 4, 3, 2 can be interpreted as “good quality”, “slightly annoying” and “annoying” respectively. In the first experiment, we evaluated the offending frequency suppression scheme in terms of speed of detection and output sound 4 In the definition of a hearing loss profile, the first word suggests the degree of hearing loss and the second hyphenated word suggests the hearing loss shape across frequency [1].
quality. The output sound quality was judged with the PESQ measure from the steady state output sound. The speed of the offending frequency suppression method was calculated with the time to recover from instability (TRI) measure. The TRI is an estimate of the time intervals during which howling occurs in the experiment. Howling occurrences were manually identified according to the method described in [3]. Let the time interval for the j th howling segment be Δtj , then the TRI is calculated as j=Nh
1 � Δtj TRI = Nh j=1
(2)
where Nh is the number of offending frequencies detected. The parameters for detection of offending frequencies with adaptive notch filters and energy growth monitoring were ρ = 0.95, αa = 0.005, λs = 0.99, a = 10−5 , λm = 0.99, δq = 0.05, Ta = 750, r νu = −0.01, νl = −0.1, Γu = 1, Γl = −4, γm = −20, Tr = 75, δb = 1.0003 and Tb = 6. Parameters of a parametric EQ filter to suppress an offending frequency upon detection were p = 0.5012 (−6 dB) and q = 5. The maximum number of parametric EQ filters were set to 12 in order to limit perceptual distortions in the output sound. The parameters for the reset algorithm were λl = 0.999, λh = 0.7, r = 10−12 , δo = 0.1 and To = 10. Table 3. Measures for the OFS with and without reset algorithm. Measures Nhs
Case 1
With reset Case 2
Case 3
Case 1
1
3
3
3
Without reset Case 2 Case 3 5
Nh
19
30
48
18
30
44
0.1
0.2
0.3
0.1
0.2
0.2
PESQ
3.8
3.8
3.8
3.7
3.7
3.5
Table 4. PESQ values for various schemes. Performance Measure
Method
PESQ
Classical
Signal 1
OFS
Speech Music Speech Music
3.9 3.9 3.9 3.9
Profile 2 3 3.9 3.9 3.9 3.9
3.9 2.8 3.9 3.6
4 2.2 1.5 3.8 3.6
It is interesting to note that the traditional system could not provide enough feedback cancellation in the case of profound hearing loss gain profile (profile 4) for an ITE hearing aid5 used in the experiment. Often, audiologist suggest the use of behind-the-ear hearing aids for patients with profound hearing loss [1]. The results in Table 4 indicates that the method of this paper will enable a patient with profound hearing loss to use an ITE hearing aid which is not possible otherwise. The method of this paper not only provides additional added stable gain but also enables patients to use more comfortable style hearing aids which is a big concern for many patients [1]. 5. CONCLUSION
8
TRI (s)
in the output signal when music signals were input to the hearing aid system. On the other hand, the OFS method yielded good output sound quality for both types of input signals with hearing aid gain profile 3. Finally, the classical scheme had significant residual feedback components in the the output sound for the hearing aid profile 4. Use of the OFS methods improved the output sound quality for profile 4 as well.
In this simulation, profile 4 and the six speech input signals of 80 seconds were used. Three acoustic feedback cases were studied. In the first case, feedback path 1 was used for the whole 80 seconds. Feedback path 2 was used for the whole experiment in the second case. In the third case, the experiment started with feedback path 1 and after 40 seconds, it was switched to feedback path 2. For the three feedback cases discussed above, total number of howling occurrences (Nh ), TRI and mean PESQ values were calculated and are listed in Table 3. Table 3 also lists the average number of offending frequencies that remained for the different feedback cases in the steady state (Nhs ) with and without the use of the reset algorithm. The howling occurrences (Nh ) in Table 3 indicate that ramping up gain to the target gain in the beginning and the feedback path change created several instances of howling. The number of howling occurrences were the most for the feedback case 3 because of the feedback path change. The effects of such occurrences were mitigated by the OFS method. The instability was detected in less that 0.4 second in all the experiments. The use of reset algorithm yielded in fewer number of parametric EQ filters in the steady state (Nhs ). However, this did not compromise the output sound quality as indicated by the PESQ values. On the contrary, use of the reset algorithm yielded slightly better output sound quality. In the next experiment, the classical system was evaluated against the offending frequency suppression (OFS) with reset method on four hearing aid gain profiles using speech and music signals. Feedback path 2 was used for this experiment. The PESQ values for various profiles with all methods are summarized in Table 4. In Table 4, both methods provided good output sound quality for profiles 1 and 2 for both types (speech and music) of input signals. The classical method provided good output sound quality for profile 3 with speech signals, however, had soft whisting sounds
304
This paper presented an algorithm that modifies the forward path gain in a hearing aid to improve adaptive feedback cancellation efficiency. MATLAB simulations and evaluations suggest that this paper’s method delivers better output sound quality especially for patients with need for high hearing aid gains. The reset algorithm successfully eliminated unnecessary filters placed in the signal path during the transient periods. The reset algorithm developed here can also be extended for public address (PA) offending frequency suppression methods. 6. REFERENCES [1] H. Dillon, Hearing Aids, Thieme Medical Publishers Inc, New York, NY, USA, first edition, 2001. [2] A. Pandey and V. J. Mathews, “Improving adaptive feedback cancellation in digital hearing aids through offending frequency suppression,” Proc. IEEE International Conf. Acoustic Speech and Signal Process., pp. 173–176, Dallas, TX, Mar 2010. [3] T. van Waterschoot and M. Moonen, “Adaptive feedback cancellation for audio applications,” Signal Processing, Elsevier, vol. 89, no. 11, pp. 2185–2201, Nov 2009. [4] M. Harteneck, S. Weiss, and R. W. Stewart, “Design of near perfect reconstruction oversampled filter banks for subband adaptive filters,” IEEE Trans. Circuits and Systems, vol. 46, no. 8, pp. 1081–1086, Aug 1999. [5] R. Martin, “An efficient algorithm to estimate the instantaneous SNR of speech signals,” Proc. EUROSPEECH, vol. 3, pp. 1093– 1096, Sep. 1993, Berlin, Germany. [6] ITU-T Rec. P.862, “Perceptual evaluation of speech quality (PESQ): An objective method for end-to-end speech quality assessment of narrow band telephone networks and speech coders,” Feb. 2001. 5 Feedback
path was derived from an ITE.