the ARES aircraft and design a control system to achieve or surpass the given ... v. Velocity along the y-axis of the body frame w. Velocity along the z-axis of the ...
AIAA 2008-7454
AIAA Guidance, Navigation and Control Conference and Exhibit 18 - 21 August 2008, Honolulu, Hawaii
On Modeling and Robust Control of ARES Baljeet Singh
‡
Raktim Bhattacharya ∗ John Valasek† Shalom Johnson‡ Justin Jackson‡ Monica Marwaha‡
Aerospace Enginieering Department, Texas A&M University, College Station, Texas 77843-3141.
This paper presents the development of a mathematical model and controller of the Aerial Regional-scale Environmental Survey of Mars (ARES) aircraft. This paper also presents the implementation of the model and control system in software. The team consisted of two advisors and four graduate students. A detailed model of the Mars airplane was developed using Simulink. The specifications for the aerodynamic data, atmosphere, and gravitational model were supplied by the Mathworks Inc. The purpose of this mission is to explore a region of the Martian atmosphere. This scouting mission will provide high-value science measurements. The objective of this project was to develop a model for the ARES aircraft and design a control system to achieve or surpass the given control performance requirements. The primary deliverable for this challenge is a set of C-language source code files that implement the control system given the constraints furnished in this request.
I.
Nomenclature
All derivatives are presented in the airplane stability axes. p·b p¯ = 2·V ∞ q·¯ q¯ = 2·Vc∞ r·b r¯ = 2·V ∞ α β m U1 −−→ CF −−→ CM −−→ ∆cg=[∆x/¯ c, ∆y/b, ∆z/¯ c]T u v w φ θ ψ
Dimensionless Roll angular rate in body frame, Dimensionless Pitch angular rate in body frame, Dimensionless Yaw angular rate in body frame, Angle-of-attach, rad side slip angle, rad Mass, kg steady state velocity in the x-axis of the body frame Vector of the force coefficient Vector of the moment coefficient is the change if center of gravity Velocity along the x-axis of the body frame Velocity along the y-axis of the body frame Velocity along the z-axis of the body frame Aircrafts bank angle Aircrafts pitch attitude angle Aircrafts heading angle
∗ Assistant
Professor Professor ‡ Graduate Assistant † Associate
1
Copyright © 2008 by Raktim Bhattacharya. Published by the American Institute of Aeronautics and Astronautics, Inc., with permission.
To Ts h γ Rm Po Ps gM ars G ρ δ DCM CD1 CDu =δCD /δ(u/U1 ) CDα =δCD /δα C Y1 CYβ =δCY /δβ CYp =δCY /δ p¯ CYr =δCY /δ¯ r CL1 CLu =δCL /δ(u/U1 ) CLα =δCL /δα CLq =δCL /δ q¯ Clβ =δCD /δβ Clp =δCD /δ p¯ Clr =δCD /δ¯ r Cm1 Cmu =δCY /δ(u/U1 ) Cmα =δCY /δα Cmq =δCY /δ q¯ Cnβ =δCL /δβ Cnp =δCL /δ p¯ Cnr =δCL /δ¯ r Subscript ∞ thrust elevator rudder aileron prime crossP total Superscript s b
Temperate at altitude datum Temperature change due to Altitude change hight above the altitude datum dimensionless ratio of specific heats Ideal gas constant Pressure at altitude datum Pressures exponential growth constent Acceleration due to Mars gravity Gravity constant Density Controls Direction cosine matrix drag coefficient at steady state conditions Variation of the airplane drag coefficient with dimensionless speed Variation of the airplane drag coefficient with angle of attack Side force coefficient at steady state conditions Variation of the airplane Side force coefficient with side slip angle Variation of the airplane Side force coefficient with dimensionless roll rate Variation of the airplane Side force coefficient with dimensionless yaw rate Lift coefficient at steady state conditions Variation of the airplane Lift coefficient with dimensionless speed Variation of the airplane Lift coefficient with angle of attack Variation of the airplane Lift coefficient with dimensionless pitch rate Variation of the airplane drag coefficient with side slip angle Variation of the airplane drag coefficient with dimensionless roll rate Variation of the airplane drag coefficient with dimensionless yaw rate Side force coefficient at steady state conditions Variation of the airplane Side force coefficient with dimensionless speed Variation of the airplane Side force coefficient with angle of attack Variation of the airplane Side force coefficient with dimensionless pitch rate Variation of the airplane Lift coefficient with side slip angle Variation of the airplane Lift coefficient with dimensionless roll rate Variation of the airplane Lift coefficient with dimensionless yaw rate freestream conditions Values associated with the thrust Values associated with the symmetric control deflection Values associated with the asymmetric control deflection Values associated with the aileron The coefficient with out cross-product terms The cross-product terms The total coefficient Stability axis Body axis
II.
Introduction
The idea of an aircraft that could be used to explore other plant has been around for 50 years; however, the recent research reviled that these type of planet exploration is plausible with the new technologies available 2
in today’s aerospace industry. This Mars exploration aircraft project is called the “Aerial Regional-scale Environmental Survey of Mars” (ARES). This paper presents the design and development of a mathematical model of the ARES aircraft. This model was then used to test a controller that was developed to control the ARES aircraft through surveying mission in the Mars atmosphere. This model and controller was developed using Simulink and was then converted into C-code. This model included all actuator, sensor, and noise subsystems. The specifications for the aerodynamic data, atmosphere, and gravitational model were supplied by the Mathworks Inc. The purpose is to explore a region of the Martian surface. This scout mission will provide high-value science measurements in atmosphere chemistry, surface geology and mineralogy, and crustal magnetism.1 The objective of the present work was to develop a model for the ARES aircraft and design a control system to achieve or surpass the given control performance requirements. The primary deliverable for this challenge is a set of C-language source code files that implement the control system given the constraints furnished in this request.
III.
Aircraft Model Specifications
This section presents the aircraft model specifications that were provided in the MACH-1 CFI.2 These specifications consisted of the aerodynamic data of the ARES aircraft, equations and constants that model the Mars atmosphere, and the constants used the gravitation model, the parameters used in the actuator models, and the parameters specifying noise characteristics. These specifications will be referred to throughout this report. III.A.
Aircraft Properties
Some of the properties of the aircraft were provided to aid in the dimensionalizing of the aerodynamic forces and moments and to provide the dynamic characteristics of the aircraft. These properties are listed below in Table (1). Table 1. Aircraft Properties
Property M ass S b c¯ Ixx Iyy Izz
III.B.
Value 100 7.0 6.25 1.25 270 190 460
Units kg m2 m m kg · m2 kg · m2 kg · m2
Aerodynamic force and moment coefficients
The aerodynamic force and moment coefficients were provided as functions of independent variables: Mach number, angle-of-attack, and control surface deflections. A aerodynamic coefficients and the independent variables are listed in Table (2). The aerodynamic coefficients were organized in three dimensional arrays. The arrays of coefficients and there independent variables were linearly interpolated through Simulink ’lookup table (n-D)’ block. III.C.
Sensor Model Specifications
A sensor noise data sheet was provided with the documentation. It consisted of the dynamic error models for various sensor channels. Based on the given shaping filter state space matrices, a single input discrete noise
3
Table 2. Aerodynamic Coefficients
Forces in the X-axis CD.basic f (M ach, α) CD.drvs f (M ach, α, δe ) CD.dyn N/A
Moments Around the X-axis Clβ f (M ach, α) [deg −1 ] Clo .drva f (M ach, α, δr ) Clo .dail f (M ach, α, δail ) Clo .p f (¯ p) Clo .r f (¯ r) Clo .r f (¯ r) Clo .dyn N/A Moments Around the Y-axis Cm.basic f (M ach, α) Cm.drvs f (M ach, α, δe ) Cm.q f (¯ q) Cm.dyn N/A Moments Around the Z-axis Cnβ f (M ach, α) [deg −1 ] Cno .drva f (M ach, α, δr ) Cno .dail f (M ach, α, δail ) Cno .p f (¯ p) Cno .r f (¯ r) Cno .dyn N/A
Forces in the Y-axis CYβ .basic f (M ach, α) [deg −1 ] CYo .drva f (M ach, α, δr ) CYo .dail f (M ach, α, δail ) CYo .dyn N/A Forces in the Z-axis CL.basic f (M ach, α) CL.drvs f (M ach, α, δe ) CL.dyn N/A
model driven by the Simulink - ’Band-Limited White Noise’ block was developed. The input power to the noise model is set to unity while all the channels are properly scaled according to the respective variances. III.D.
Actuator Model Specifications
The control surfaces are modeled as damped second order systems. The natural frequency and the damping ratio was provided in the documentation. Also, Simulink -’Backlash’ and ’Saturation’ block were used to model the respective nonlinearities. III.E.
Engine Model Specifications
The thrust is modeled as a simple first-order lag system with a time constant of τ = 5.0 sec−1 . the control input for the thrust commands is normalized with respect to the maximum thrust available. This normalization yields a control input, δt , that ranges from 0 to 1. The commands are translated to thrust by multiplying it by the maximum thrust. The maximum thrust for the ARES aircraft is 250N. The thrust vector was determined by using the thrust alignment matrix provided. The Equ.(1) was used to calculate the thrust vector, F~thrust = [T A][FthrustM AX · δt , 0, 0]T (1) where the thrust alignment matrix, [T A], is shown below. 1 0 0 [T A] = 0 0 0 0 0 0
4
(2)
The thrust moment vector was calculated using the thrust lever arm which was provided. The thrust ~ thrust , is [0, 0, 0]T m. The moment arm is the distance from the CG to the thrust vector. The lever arm, X equation used to calculate the trust moment is shown below in Eqn.(3). ~ thrust = X ~ t × F~thrust M III.F.
(3)
Atmosphere Model Specifications
The specifications of the Mars atmosphere model were provided in the form of equations and constants. The constraints are listed in the Table 3. Below is a brief description of the equations used in the Mars atmosphere model. Table 3. Atmosphere and Gravitational Constant
Constant To Ts γ Rm
Value 249.75 −2.22 × 10⁻³ 1.25 191.8
Units K K/m
Po Ps G MM ars RM ars
699.0 9.0 × 10⁻⁵ 6.67 × 10⁻¹¹ −9. × 10−5 −9. × 10−5
Pa 1/m N · m2 kg 2 kg m
N ·m kg·K
1. The Mars temperature equation is shown in Equ(4). T (h) = To + Ts · h
(4)
Where h is the altitude in meters and T (h) is the temperature in degrees Kelvin. 2. The equation for the Speed of Sound in shown in Equ(5). p a = γ · Rm · T
(5)
Where γ is the dimensionless ratio of specific heats on Mars and Rm is the ideal gas constant. 3. The pressure distribution as a function of altitude is shown in Equ (6). P (h) = Po · ePs ·h
(6)
Where h is the altitude in meters and P is in Pascal’s. 4. The ideal gas equation is used to calculate the density, this function is shown in Equ(7) ρ=
P Rm · T
where P the pressure, Rm is the ideal gas constant, and T the temperature.
5
(7)
III.G.
Gravitation Model Specifications
The constants required to model the gravitational field around Mars were provided and are shown in Table(3). Equ.(8) is used to calculate the gravity around Mars. gM ars. = G
MM ars (RM ars + h)2
(8)
Were ag is the magnitude of the gravitational acceleration acting on an object a distance h from the ·m2 surface datum. Gravitational constant, G in Nkg 2 , the Mass of mars, Mmars , in kg and radius of the semi-major axis, RM ars in meters is listed in Table (3).
IV.
Aircraft Model Development
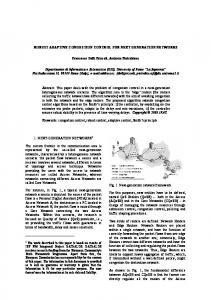
The model was developed using Simulink for two reasons. The first reason was to allow the block diagrams to be used to aid in understanding the flow of information.3 This clear understanding of the flow of information allowed many people to work on different subsystems without having a comprehensive understanding of the inner workings of all the other subsystems of the model. The second reason was to allow the model to use pre-existing Simulink blocks. The Simulink aircraft model was design in two major sections: (1) the force and moment section, and (2) the dynamic section. This two-section design was chosen to help in the verification and validation portion of the project. The layout of the model is shown in Fig. 1.
&!"#"$! )
&!"#"$! )
*+,- .
E"#"$!
!"#"$!
!"#"$!
B
E"#"$! % 6+,/$! '!"75787"9
&*+,/$ ' "+"#8 )
&*+,/$ ' "+"#8 )
H+"+ I
6+,/$!
1
E"#"$
234 '!$ 234 '!$
&234 ' !$ )
234 234 .
*+,/$! ' #0( ' -+-$0"!
290#-7/!
(13 D$* !>?1
!3 !
*8#=! ;/+0 D$* !> ?1
E"#"$ G
!"#"$! &!"#"$! ' ( ) !"#"$! %
>24 ?@24 ?>4?A4
>2- ?@24 ?>4?A4
!"#"$!2
#((,@!" ' /+--#0($( /-( ;(,:! (,:! ' /-( /-( ;(,:# (,:# ' /-( /-( ;(#78 (#78 ' /-(
Figure 1. The Layout of Model
6
H+"+ .
G
IV.A.
Modeling of Forces and Moments
The forces and moments section was broken into three parts: (1) aerodynamic section, (2) gravity section, and (3) thrust section. The inputs to all the three sections were the states, the controls, and the appropriate direction cosine matrix (DCM). The forces and moment block is shown in Fig.(2).
1
states
states Fg_s force _total _s 4
DCM_se
DCM _se
out 1 1
Gravity _Model
Thrust_s
U
3
Forces _stibility
Moments_s
DCM_sb
DCM _sb Thrust model
states Aero_Forces_s 2 2
Moments _stibility
U
U mom _total _s Aero_Moments_s out 2
DCM_sb
aero model
Figure 2. Force and Moment Block
IV.A.1.
Aerodynamic forces and moments
This section presents the four-step process used in calculating the aerodynamic forces and moment acting on the center of gravity of the aircraft. The first step was to model the actuators. The second step was to calculate the dynamic pressure and the Mach number. The third step was to determine the total force and moment coefficients. The fourth step was to dimensionlize the forces and moments. A block diagram used to preform the aerodynamic calculations is shown in Fig. (3). The first step was to develop an actuator block. The actuator block split the control into left and right actuator and then conducted four major operations to: (1) Model the actuator dynamic responses, (3) add the backlash from the control surfaces, (2) incorporate saturation of the actuators, and (4) allow the actuator dynamics to be bypassed. 1. Actuator dynamics responses were modeled using a second order nonlinear actuator block. The natural frequency and the damping ratio provided in the specification section were used in this block. 2. The backlash was then added to each control surface. This was accomplished using the backlash block provided in Simulink. 3. The saturation of the actuators was then included after converting the controls into the symmetric and asymmetric deflections. 7
V_mag
[V _ mag ]
Dynamic pressure (Pa)
[Dyn _ Pressure ]
mach
[Mach ] Goto 2
From 4
From
[total _ force _ coefficients alpha
forces s frame
Aero forces (N) ND aero forces
]
tets _ values
K *u
1
−D,Y ,−L
Aero _ Forces _ s
[AOA ] From 10 Goto 7
forces
AOA
[AOA ] From 1
1
beta
states
total forces coefficients stability
[beta ]
states
[total _ force _ coefficients
Goto 10
mach number beta
[beta ] omega
From 12
[omega ]
[Dyn _ Pressure ]
Dyn _Pressure
2 Aero _ Moments _ s
Goto 4
From 8 [U_ surfaces ]
Hight
]
1
[Height ]
Aero Moments
U_surfaces
ND Aero Moments
moments in s frame
From 2 test _ valus
moments
Goto 1 Non Dim Aero Forces
(Stability Frame
)
new states
[total _ force _ coefficients
]
total forace coefficients stability
From 9 Uact 2
U
[Mach ]
To Workspace 6
U_surfaces
U
mach
From 5
[U_ surfaces ] Goto 9
[AOA ]
AOA
From 6 actuator dynamics [beta ]
beta
From 24
[V _ mag ]
velocity vector
(m/s)
dynamic pressure
(Pa)
From 30
[Dyn _ Pressure ] dynamic pressure
(Pa )
omega ] From 3
[V _ mag ] [Height ]
mach number
reference height (m)
From 31
V_mag
From 11
[Mach ] mach number
ND Aero moments stability
omega
[U_ surfaces ]
U_surfaces
From 7
atmospher model
DCM _sb
3 DCM _ sb
Non Dim Aero Moments
(Stability Frame
)
Figure 3. Aerodynamic Force and Moment Block
4. The actuator block would also need to allow the actuator dynamics to be turned on and off for different model simulations. This was accomplished using a toggle switch that would either implement or bypass the actuator dynamics. The toggle switch was controlled with a flag that was set in the m-code that runs the simulation. Several steady state simulations were run with the actuator dynamics turned off.
The second step was to develop an atmosphere block that calculates the dynamic pressure and the Mach number of the aircraft. The atmosphere block was constructed using the equations of pressure, density, temperature, and speed of sound provided in the specification section of this paper. The block diagram of the atmosphere model is shown in Figure (5). The third step was to develop the aircraft’s total force and moment coefficients. This was accomplished by using a series of lookup tables implemented to interpolate through the three-dimensional array of aerodynamic coefficients. The total force coefficients were then calculated using the values obtained from the lookup tables. However, the moment coefficients were calculated in a two-step process. The first calculations were done using the values gathered from the lookup tables, referred to as the prime moment coefficients. The second moment calculation used the total force coefficients and the shift in the center of gravity, which is referred to as the cross product moment coefficients. The shift in the center of gravity was converted to the stability frame to allow this calculation to be performed. The prime and cross product moment coefficients were then added to form the total moment coefficients. The vector equations used in these calculations are shown in Eqn. (9).
8
drvs _ out To Workspace 2
Terminator A 1
A
demand
Switch 2 actual
aileron dynamics
U
rt/lft cmd
A
demand
drva _ out
drvs /drva actual
*uvec A
To Workspace 9 Switch 1
actual
aileron dynamics
Saturation
*uvec Backlash
2
Saturation 1
−C−
Backlash 1
1
1
Constant 1
U_ surfaces
A
demand
A
dail _ out
actual
Backlash 2
aileron dynamics
To Workspace 10 Switch
−C−
Saturation 2
flags .act
Constant 2
actuator dynamics flag
Figure 4. Actuators blocks
density To Workspace 2 density
(kg /m ^3)
[Density ] density (kg/m^3)
[h]
height (m )
[Temp ]
temperature
(K)
soundspeed
(m /s )
temp in deg K
height (m)1
temp (K)
Goto 3
temp (K) density
[SoundSpeed ]
[Temp ] speedofsound
temperature
speed of sound
To Workspace 3
To Workspace 1 1 velocity vector (m /s)
[V_mag ] Goto 1 q_test
2 reference height (m )
[h]
To Workspace 13
Goto 2
DP To Workspace 6 V
1
/ !V 2
[Density ]
2
q
1 dynamic pressure (Pa )
!
From 2
cmd .mach
Dynamic Pressure
Constant 2 [V_mag ]
machout
flags .mach
From
V
To Workspace
Constant 1 Mach
a
0
Switch
2 mach number
Mach Number
Constant
[SoundSpeed ] From 3
Figure 5. Atmosphere Block
s −−→ CM total
� � −−→ −−→� � −−→ =s CM prime − [sb]b ∆cg X s CF total
−−→ Were CM prime is defined in the equations (10). Cl ClB.basic · (β) + Cl0.drva + Cl0.dail + Cl0.p · p¯ + Cl0.r · r¯ prime Cmprime = Cm.basic + Cm.drvs + Cm.q · q¯ Cnprime CnB.basic · (β) + Cn0.drva + Cn0.dail + Cn0.p · p¯ + Cn0.r · r¯
(9)
(10)
The fourth step was to dimensionalize the force and moment coefficients. This was accomplished using the dynamic pressure and the aircraft parameters listed in the specification section of this paper. The forces and moments were left in the stability frame. IV.A.2.
Gravitational forces
The gravitational forces block was developed using the Newton’s universal gravity equation. The semi-major axis radius was used as zero altitude datum. The value of Mars mass and semi-major axis were provided in 9
the specification section of this paper. The gravitational forces were then converted into the stability frame. The gravitational force block is shown in Fig. (6). 2 DCM _se
mass.f mass6
Matrix Multiply 1
K*u
g
alt
states
Product 1
Gain 6
DCM e to s
Fg_test To Workspace 1 Fg_s
gravity
Figure 6. Gravitational force block
IV.A.3.
Thrust forces and moments
A Thrust block was developed to calculate the thrust force and moment. This block consisted of a threestep process. The first step was to develop a thrust dynamic block that modeled the thrust dynamics. The second step was to calculate the moment acting on the center of gravity using the thrust forces and the thrust moment arm. The third step was to convert the forces and moments to the stability axis. The contents of this block is shown in Fig. (7)
1 U
K*u
Matrix Multiply
Thrust_body
Commanded Thrust
DCM b to s
thrust
[Thrust_applied ]
thrust_arm Thrust_applied ]
Matrix Multiply
A
Cross Product C B C = AxB
DCM b to s1
3x3 Cross Product
force_thrust_test To Workspace
Goto
Subsystem 2 DCM_sb −C−
1 Thrust_s
2 Moments_s
moment _thrust_test To Workspace1
From
Figure 7. Thrust
1. The first step, modeling the thrust dynamic response, was accomplished using a first order lag block. The time constant used in the block is provided in the specifications section of this paper. The thrust dynamic block also incorporated the thrust saturation point. The saturation was implemented using a saturation block. The thrust dynamic block also had a toggle switch that would allow the thrust dynamics to be simulated or bypassed. This switching was accomplished using a flag set in the m-code that executed the simulation. 2. The second step was to calculate the moment using the thrust forces and the thrust moment arm. The equation used in this section is shown in Eqn. (3) 3. The third step was to convert the thrust forces and moments to the stability frame. This was accomplished using the relevant direction cosine matrix.
10
IV.B.
Dynamics
The dynamic section was used to calculate dynamic effects of the forces and moments had on the aircraft’s states. This calculation were accomplished in four steps: (1) The forces and moments were converted to the body frame, (2) then the derivatives of the states were calculated, (3) the state derivatives were integrated to get the new state values, and (4) the new state values were used to calculate the new direction cosine matrices. 1. The forces and moments were converted to the body frame using the direction cosine matrices. 2. The derivatives of the states were calculated in a MATLAB function. The following kinematic and dynamic equations are used shown below.4
sin(φ)tan(θ) cos(φ)tan(θ) p cos(φ) −sin(φ) q sin(φ)sec(θ) cos(φ)sec(θ) r p u [F ]b − q × v m r w p p [I]−1 b [M ]b − q × [I]b q r r u = cos(α)cos(β) kF k = m ! 1 w˙ w˙V˙ = p − 2 V 1 − Vw2 V � � v˙ 1 v˙u˙ = − 2 1 − uv 2 u V 2
φ˙ ˙ θ = ψ˙ u˙ v˙ = w˙ p˙ q˙ = r˙ V V˙ α˙ β˙
1 0 0
(11)
3. An integrator block was used to integrate the derivatives of the state. The location was calculated by integrating the velocities in the North-East-down (NED) frame. 4. A direction cosine matrix block was developed. All of the direction consine matrices used in the model were calculated in this block. By centralizing these calculations we insured that the all the direction cosine matrices were consistent throughout the model. The direction cosine matrix block is shown in Fig.(8) The states and controls used in the model were chosen to be: States: [u, α, β, p, q, r, φ, θ, ψ, x, y, z]T Controls: [δthrust , δelevator , δrudder , δaileron ]T These states and controls were chosen to allow comparisons to be made with other aircraft in the validation section of this project. The controls were also chosen to allow intuitive estimations to be made about the control deflections. The maximum range and maximum endurance trim velocity were considered. The maximum range trim velocity was chosen to allow more of Mars to be explored. The maximum range trim velocity was determined by analyzing the lift-over-drag values through out the angle of attack range. The maximum range 11
1
u,alpha,beta,p,q,r,phi,theta,psi
MATLAB Function
K*u u,alpha,beta
V,alpha,beta
Matrix Multiply K*u
!"
DCMwb
1 DCM_we
DCM Earth to Wind
6 DCM_wb
alpha,beta DCM Body to Wind
K*u
uT
5 DCM_eb
p,q,r,phi,theta,psi K*u phi,theta,psi
K*u
[R1,R2,R3]
DCMbe
4 DCM_be
psi,theta,phi Rotation Angles to Direction Cosine Matrix1
Matrix Multiply
Rotation Order: ZYX
8 DCM_se
DCM Stability to Body1
uT
uT
Matrix Multiply
7 DCM_sb
3 DCM_bs
DCM Stability to Body K*u
[R1,R2,R3]
DCMbe
beta,0,0
2 DCM_ws
Rotation Angles to Direction Cosine Matrix2 Rotation Order: ZYX
Figure 8. Direction cosine matrix block
√ was determined by plotting CL /CD and calculating the maximum values obtainable.5 The maximum endurance was determined by plotting CL /CD and calculating the maximum values obtainable. A plot of √ both CL /CD and CL /CD is shown in Fig.(9), which also has the trim value used in this report. This trim value corresponds to a speed of 167 m/s.
IV.C.
Executing the Simulink Model
There were several m-codes used to execute the aircraft model simulation, which were used in the design portion of the project; therefore, a standardized initialization sequence was developed. This standardized initialization sequence allowed each team member to develop m-codes to conduct simulations that were tailored to their specific needs. The executing m-codes initializing sequence consisted of three portions. These three portions were global specific variables, loading the data needed to run the simulation, and setting the initial conditions used in the integrator blocks. The first step in the initialization sequence was to make the variables global. These variables were organized in to structural array to reduce the number of global variables. The second step in the initialization sequence was to load the aerodynamic data, aircraft parameters, atmosphere constants, and gravitation constants. This step was done in a function called data-main. The third step in the initialization sequence was to set the initial condition and to set the flags that controlled the toggle switches in the model. This was done using a function that had one input, the state vector being simulated, and three on/off-switches. The three on/off-switches set the three flags in the model. These flags were set for the specific type of simulation needed. The flags mostly used in the verification and validation portion of this paper. This initialization sequence allowed the values for the state derivatives to be calculated for any state configuration by running the simulation for a zero time step; consequently, making the model a function. This was essential in the design and testing portion of the project.
12
25 CL/CD C1/2 /CD L
20
Lift over Drag, L/D
optimal value trim value 15
10
5
0
−5 −5
0
5 10 Angle of Attack, α [deg]
Figure 9. CL /CD and
√
15
20
CL /CD vs. angle of attack (α)
Figure 10. The Initializing sequence
IV.C.1.
The basic codes used in this project
Bellow is a list of m-codes, used throughout the design and testing portion of this project, briefly describing the operations they perform. 1. Trim code: this m-code was used to calculate the trimmed configuration of the aircraft at any velocity and altitude. 2. Model-Linearizing code: this m-code calculated the A and B matrix for a given trim configuration. 3. Aero-linearizing code: this m-code used the stability derivatives to calculate the A and B matrix for a given trim configuration. 4. Verification code: this m-code ran the testing codes that were used in the verification portion of the project. 5. Running simulation: To run the open-loop/closed-loop simulations of the system in various modes. 6. Plotting aerodynamic data: this m-code developed a series of aerodynamic plots used in the verification portion of this project. 7. Calculating stability derivatives: this m-code calculated the stability derivatives using the aerodynamic data provided in the specification portion.
13
V.
Aircraft Model Verification and Validation
This section presents the methods used in the verification and validation portion of this project along with the results from these methods. V.A.
Verification
The verification process was accomplished by implementing an internal testing process that would test the values calculated through out the model and output the result to the output screen. Each test would output the name of the subsystem being tested and a 1(pass) or 0 (fail) to the output screen, which is shown in Fig.(11). The testing was done by comparing values used in the model to the values given in the specifications and comparing values calculated in the model with values calculated in subsequent testing codes. The verification testing was an ongoing process through out the design and development stage of the model; therefore, it was important that all the team members knew the status of each subsystem. This was accomplished by coloring each subsystem block green, yellow, or red, which represented that the verification process was complete, in progress, or was not tested respectively. The m-code that conducted the verification process was designed so that it could be run at anytime. This ability allowed the test to be conducted after any changes were made to the model. This was very useful during the developmental stages of the model. The verification process divided the aircraft model into two major segments: (1) the force and moment segment, and (2) the dynamic segment. V.A.1.
Verification of the aerodynamic subsystem
The first step in the verification process of the aerodynamic subsystem was to insure that the values used in the model were in fact the values given in the specifications. This was achieved by comparing the values obtained from the lookup tables with the values provided in the specification section. To make these comparisons two things had to be done: (1) the input to the system had to be controlled and (2) the output had to be monitored. All the states and controls could be set using the initialization sequence, described in the model development section of this paper; however, the lookup tables used Mach number, instead of velocity, which was calculated in the atmosphere model. To insure that the aerodynamic lookup tables were completely isolated from the other subsystems a flag was used that allowed the Mach number to be directly input into the model. This Mach-flag was set in the initialization sequence. The values outputted from the aerodynamic lookup tables were monitored using a series of ”output to workspace” blocks. These output values were then compared to the exact values given in the specifications. This test was done throughout the entire range of the aerodynamic tables. The values given in the specification section were then used to calculate the total force and moment coefficients and the dimensionalized forces and moments. These values were then compared to the values calculated in the model, which were also gathered from ”output to workspace” blocks. This method allowed the values calculated in m-codes to be used to test the algorithms used in the model; therefore, by looking at the equations used in the m-codes, one would know the calculations performed in the actual model were correct. V.A.2.
Gravity and Atmosphere Subsystem Verification
The subsystems used in calculating the gravitational forces and the atmospheric values were verified similarly to the aerodynamic subsystem. The first step was to set the states that were used in both of the subsystems, which was done using the initialization sequence. The outputs of both subsystems were monitored using ”output to workspace” blocks. The values calculated in the gravitational model and the atmosphere model were then compared to the values calculated in the m-code used to test the subsystems. V.A.3.
Dynamic Subsystem Verification
The verification of the Dynamics subsystem was accomplished in a two-step process. The first step in this process was to calculate the stability derivatives from the aerodynamic data provided in the specifications 14
Figure 11. Results of diagnostic testing
15
section. These stability derivatives were then used to calculate a linearized model of the aircraft.6 This linear model was then compared against the linear model calculated using the final model. The values from both methods generated approximately the same results. The A and B matrices for the longitudinal and lateral aircraft system is shown bellow. Method Used
Model
Coefficients
2
Model
Coefficients
6 6 6 6 6 6 4
[A] Matrices Longitudinal 2 3 −0.00148035 3.481 −3.86791 −3.69279 6 7 1 −0.000499282 7 6 −0.000447293 −0.269648 6 7 4 −0.00158067 5 −3.41711 −0.366271 0 0 0 1 0 2 3 −0.00325064 2.42319 −3.86791 −3.69378 6 7 1 2.38266e − 010 7 6 −0.00045757 −0.275408 6 7 4 −0.00158056 −3.41711 −0.366271 5 0 0 0 1 0 Lateral −0.0116008 0.0231612 −1 0.0221125 0 0.848779 −0.321052 0.0733715 0 0 0.908338 −0.0308467 −0.225992 0 0 0 1 0.0231611 −4.95701e − 023 0 0 1.00027 −2.14084e − 021 30 2 0 −0.0116008 0 −1 0.0221125 0 6 7 6 0.884384 −0.322183 0.0644366 0 0 7 6 7 6 0.896558 −0.026475 −0.226929 0 0 7 6 7 6 7 0 1 0.0231611 0 0 5 4 0 0 1.00027 0 0
3 7 7 7 7 7 7 5
It is important to note the the trust derivatives were not calculated using the aerodynamic coefficients; Therefore, the cells that correspond to the thrust terms, in B matrix, will be 0.0.
16
Method Used 2 Model
6 6 6 4
Coefficients
[B] Matrices Longitudinal 2.5 −0.208082 −6.79693e − 007 −0.014717 0 −5.02481 0 0 2 3 0 −0.266284 6 7 6 0 −0.015033 7 6 7 4 0 −5.02481 5 0
2
Model
6 6 6 6 6 6 4 2
Coefficients
V.B.
6 6 6 6 6 6 4
Lateral −0.0102377 0.407207 0.80517 0 0 −0.0102377 0.438861 0.79942 0 0
3 7 7 7 5
0
−0.000590973 1.77343 −0.00651609 0 0 −0.000590973 1.7727 −0.030617 0 0
3 7 7 7 7 7 7 5 3 7 7 7 7 7 7 5
Validation
The validation portion of this project was accomplished by comparing the stability derivatives that describe the aircraft’s characteristics to those of other similar aircraft. Because the stability derivatives are nondimensional they do not depend on the atmosphere, which the aircraft is operated in; therefore, a direct comparison can be made. The stability derivatives that were calculated in the verification portion were compared the two similar aircraft. This similar aircraft were chosen using two criteria. One of the criteria is that the aircraft operate at similar Mach numbers. The other criteria is that the aircraft have similar wing shape, such as aspect ratio. The two aircraft used in this comparison were the SIAI-Marchetti S-211, and Learjet 24. A top view of‘ these three aircraft is shown in Fig.(12). The values using in the criteria and the stability derivatives values are listed in Table (4).
Figure 12. Top View of the Three Aircraft that are Compared, left ARES, center Learjet 24, right SIAI-Marchetti S-211 (not to scale)
17
Table 4. Stability derivatives comparing SIAI-Marchetti S-211 and Learjet 24 with the ARES aircraft
Aspect Ratio Cruise Mach CD1 CDu CDα C Yβ CYp¯ CYr¯ CL1 CLu CLα CLq¯ Clβ Clp¯ Clr¯ Cm1 Cmu Cmα Cmq¯ C nβ Cnp¯ Cnr¯ V.C.
ARES Aircraft SIAI-Marchetti S-211 Criteria 5.58 5.09 0.65 0.60 Stability Derivatives 0.0355 0.022 0.0202 0.05 0.307 0.12 -0.251 -1.0 0.0 -0.140 0.0 0.610 0.6117 0.149 0.676 0.084 6.468 5.5 0.0 10.0 0.0345 -0.110 -0.999 -0.390 0.200 0.280 0.0 0.0 -.053 0.0 -0.737 -0.24 -19.971 -17.70 0.084 0.170 -0.140 0.090 -1.199 -0.260
Learjet 24 5.03 0.7 0.0335 0.104 0.30 -0.730 0.0 0.400 0.41 0.40 5.84 4.7 -0.110 -0.450 0.160 0.0 0.05 -0.64 -15.5 0.127 -0.008 -0.200
Aircraft Stability Analysis
The static stability of the aircraft was investigated using the aerodynamic data provided. The criteria for the static stability of an aircraft is shown in Fig.(13).7 These aerodynamic coefficients were plotted in respect to the independent variables. This was done to allow the derivatives to be analyzed throughout the flight envelope. There were two stability derivatives that correspond to an unstable aircraft. The two stability derivatives that makes the aircraft unstable are highlighted in Fig.(13). For more aerodynamic plot see the Appendix. The static stability criteria plots are shown in Fig.(14) and Fig.(15).
18
0
0.06
−0.01
0.05 0.04
0.05 CY
0.07 Cm
CD
Figure 13. Static stability criteria
−0.02
0 −0.05
−0.03
0.03 150
200
150
U [m/s]
200
−0.2 0 0.2 beta [rad]
U [m/s] 1
0.02
0.01
CL
Cn
Cl
0.01 0
0
0.5
−0.01 −0.01
−0.02 0 −0.2 0 0.2 beta [rad]
−0.2 0 0.2 Beta [rad]
0
0.1 0.2 0.3 alpha [rad]
Figure 14. Aerodynamic plots that are used in the static stability criteria, these plots shown that all the static stability slopes are indicating that the aircraft is stabile except for the δCm /δu and δCl /δβ which associated with an unstable aircraft
19
−4
x 10 2
−0.1
Cl
Cm
0
0
−0.2 −2
−0.3 0
0.1 0.2 alpha [rad]
0.3
−0.01
−3
0 p [rad/sec]
0.01
0 r [rad/sec]
0.01
−4
x 10
x 10
1 2 Cn
Cm
0.5 0 −0.5
0 −2
−1 −0.01
0 q [rad/sec]
0.01
−0.01
Figure 15. Aerodynamic Plots Used in the Static Stability Criteria, these plots shown that all the static stability slopes are indicating that the aircraft is stabile
20
VI.
Control Design Specifications
A longitudinal reference-tracking flight control system was developed based on the performance and and constraints specifications mentioned in the MACH-1 documentation. The sampling time of 0.02 sec. limits the maximum controller bandwidth to 25Hz (≈ 150rad/sec.). A full-state feedback controller based on the linearized dynamic model of the airplane was designed in framework of the general mixed sensitivity H∞ control problem formulation. The present section describes various performance and robustness specifications used to design the H∞ feedback law. VI.A.
Reference Tracking Specifications
The controller is designed for tracking altitude (h) and airspeed (u) commands while all the states are available for feedback through respective sensor channels. The following tracking performance criterion is used for design: Maximum reference signal amplitude Reference signal crossover frequency Allowable tracking error in low frequency region (ω < 0.001 rad/s.) VI.B.
hmax =10 m., umax =2 m/s. 0.5 rad/s. 1.56986 %
Actuator Constraints Specifications
Limits on maximum deflections and deflection rates for actuators were provided in the MACH-1 documentation. The following values are used for the control design: Controls δthrust δelevator δrudder δaileron VI.C.
Deflection Range [0, 1](normalized) [−20, 10](deg.) [−10, 10] (deg.) [−20, 20](deg.)
Max. Rate – 200 deg/s 200 deg/s 200 deg/s
Sensor Noise and Output Disturbance rejection
The noise characteristics are as previously discussed. A first order output disturbance model is used to simulate low frequency external disturbances. Maximum disturbance in altitude (h) Maximum disturbance in airspeed (u) Disturbance model time constant VI.D.
2m 0.2 m/s 50 sec.
Modeling Errors: Multiplicative Uncertainty Allowable input multiplicative uncertainty at low frequency (ω ≤ 1) rad/sec Allowable input multiplicative uncertainty at high frequency (ω ≥ 100) rad/sec
21
10% 100%
VII. VII.A.
Control Design Development (extra credit)
H∞ Control Theory
The H∞ control theory provides us a framework to design a multi-variable state feedback control law which can meet the specified performance and stability robustness objectives. This technique is particularly suitable for the multivariable systems with cross-coupling between channels. The H∞ control design technique enables us to design the control and observer gains simultaneously by solving the corresponding Riccati equations. A typical H∞ optimization problem is set up as a generic two-input-two-output (TITO) system P (s), as shown in Fig.(16). The objective is to design a stable feedback control gain K(s), such that the multivariable closed loop transfer function Ty1 u1 (s) from u1 to y1 has its ∞-norm kTy1 u1 (s)k∞ < γ, for a given γ > 0.
Figure 16. H∞ control system
The input u1 to plant P (s) includes the reference signal and disturbances. The input u2 is the commanded control signal. The two outputs are the error signals y1 that we want to minimize, and the measured variables y2 , that we use to control the system. y2 is used in K(s) to calculate u2 . The system can be represented as, " # " #" # y1 P11 (s) P12 (s) u1 = y2 P21 (s) P22 (s) u2 u2
=
K(s)y2
(12)
where Ty1 u1 (s) = P11 + P12 K(I − P22 K)−1 P21 . Therefore, the objective is, minStabilizingK(s) : kTy1 u1 (s)k∞ = supω (σmax [Ty1 u1 (jω)]) < γ VII.B.
H∞ Controller Design Methodology
The nonlinear ARES airplane model was linearized about a trim state. Based on this linearized model, the longitudinal reference tracking problem for ARES airplane was formulated in the framework of the general mixed sensitivity H∞ control problem.8 The objective was to design a linear, robust, multivariable controller for decoupled altitude and airspeed reference tracking. The detailed block diagram for the H∞ formulation is shown in Fig.(17). In Fig.(17), r are the reference commands, x are the airplane states, uc are the commanded controls to the actuators, n and d are the noise and disturbances respectively. Input, output and control scaling factors (Kr , Kn , Kd , Ke , Ky , Ku ) are used to scale the problem such that all the inputs and outputs have a unity maximum norm (γ = 1). These scale factors are selected based on the trim values and the constraints specifications discussed in the previous section. Wd represents the first-order disturbance model. For mixed sensitivity H∞ loop shaping, three weighting functions (WS , WT , WC ) are used. WS is used to shape the closed loop sensitivity transfer function in frequency domain. This ensures tracking performance in the specified frequency range. Similarly, WT and WC are used to set the stability robustness margins and 22
the controller bandwidth specified in the previous section. The weighting functions WS , WT and WC act as ”tuning knobs” to design K(s) such that the design objectives are met. The controller K(s) was computed in state-space form using MATLAB’s hinfsyn-command.
Figure 17. Inter-connection Diagram for H∞ Control
VII.C.
Controller Design Data
All the numerical data used for controller design is listed in Table(5) and Table(6). Table 5. H∞ Control Design Data - Trim Values and Scaling Weights
Trim State 167 0.023157 0 0 0 0 0 0.023157 0 0 0 −8046.72
Trim Control
Kn
0.0904026 0.0723197 0 0
0.429451 5.56988 2.57002 2.57002 2.18975 0.0308534 0.0308534 0.0308534 0.0556247 0.0556247 0.0556247
Kr
Ke , Ky
Ku
"
10 2
#
"
0.1 0.5
#
11.0616 9.78347 5.72965 2.86479
Table 6. H∞ Control Design Data - Loop Shaping Functions
WS 0.7s + 0.07 1s + 0.001 VII.D.
WT 70s + 35 1s + 50
WC 100s + 15000 1s + 15000
Controller Characteristics
This section presents various performance and robustness characteristics of the designed H∞ controller. 23
VII.D.1.
Tracking Performance
The performance specifications required the tracking error to be less than 1% in the low frequency range (ω < 0.001 rad/s.). The singular value plot for the sensitivity transfer function S(s) shows that the specified objective is met (Fig.(18(a))). The tracking error is 1.56986% for ω < 0.001 rad/s. and increases to 142.856% at ω = 0.1 rad/s.. VII.D.2.
Stability Robustness
The allowable input multiplicative model uncertainty is specified to be less than 10% for ω < 1 rad/s. The singular value plot of the complementary transfer function T (s) shows that the controller can tolerate a potential 70.0139% plant uncertainty for ω < 0.5 rad/s. (Fig.(18(b))), and could be larger at higher frequencies. Singular Values
Singular Values
5
100
0 Singular Values (dB)
Singular Values (dB)
0 −5 −10 −15 −20 −25
−100 −200 −300
−30 −400
S 1/We
−35 −40 −5 10
0
−500 −5 10
5
10 10 Frequency (rad/sec) (a) σ - Sensitivity Transfer Function
T 1/Wy 0
5
10 10 Frequency (rad/sec) (b) σ - Complementary Sensitivity Transfer Function
Figure 18. 1 1 W ,W
Singular-value plot of Sensitivity and Complementary Sensitivity Transfer Functions. blue - T, green -
VII.D.3.
Controller Bandwidth
S
T
The sampling time of 0.02 sec. limits the allowable controller bandwidth to 25 Hz. The weight function WC was used to keep the controller bandwidth within this range. The singular value plot of the control transfer function C(s) shows that the control gain rolls of at ω = 150 rad/s. (Fig.(19(a))). VII.D.4.
Sensor noise and Disturbance Rejection
Fig. (19(b)) shows the closed loop output gains for the noise and disturbance inputs. We see that the controller has good noise attenuation and disturbance rejection properties over all frequency ranges. VII.D.5.
Response to Step Commands
Fig. (20) shows the response of the closed loop system to a 1 m. step reference command in altitude. We observe that the maximum deviation in airspeed is 0.0047865 m/s. with a settling time of 30 sec.. The corresponding control commands are within the actuator limits specified. Fig. (21) shows the response to a 1 m/s. step reference command in airspeed. The maximum deviation in altitude is 0.0810796 m. with a settling time of 30 sec..
24
Singular Values
Singular Values
50
0
0 Singular Values (dB)
Singular Values (dB)
−100 −50 −100 −150 −200 −250
−200 −300 −400
−300
−400
−500
C 1/Wu
−350 −5
0
10 10 Frequency (rad/sec) (a) σ - Control Transfer Function
−600 −5 10
5
10
Figure 19.
25
Noise Disturbance 0
5
10 10 Frequency (rad/sec) (b) Noise and Disturbance Gains
Altitude (h)
Airspeed (u) 167.005
8047.5
(m/s.)
h (meters)
8048
8047 8046.5
0
20
40 60 Time (sec.)
80
167
166.995
0
20
40 60 Time (sec.) δelevator
80
0
20
40 60 Time (sec.) δaileron
80
20
40 60 Time (sec.)
80
Thrust (T) 4.16 (deg.)
(normalized)
0.092
0.091
0.09
0
20 −4
1.27
x 10
40 60 Time (sec.) δrudder
4.14 4.12 4.1
80
−5
−2
x 10
(deg.)
1.265 1.26
−4
1.255 0
20
40
60
80
−6
0
Figure 20. Response to a unit step command in Altitude. For actuators, dashed - control command, solid - actuator output
26
Altitude (h)
Airspeed (u) 168
8046.7
(m/s.)
h (meters)
8046.75
8046.65 8046.6
0
20
40 Time (sec.)
60
167.5
167
80
0
20
40 Time (sec.) δ
60
80
20
40 Time (sec.) δaileron
60
80
20
40 Time (sec.)
60
80
Thrust (T)
elevator
4.2 (deg.)
(normalized)
0.15
0.1
0.05
0
20 −4
60
0
5
20
40
0 −4
1.5
1
4
80
(deg.)
2
x 10
40 Time (sec.) δrudder
4.1
60
80
x 10
0 −5 −10
0
Figure 21. Response to a unit step command in Airspeed. For actuators, dashed - control command, solid - actuator output
27
VIII.
Control Design Verification and Validation
Control simulations are done on the nonlinear model to validate the controller designed in the previous section. Simulation results with and without noise inputs are presented here. Fig. (22) shows the system response for a 10 m/saltitude step command. Fig. (23) shows the results for a 10 m/sairspeed step command. We observe that the controller performs well on the nonlinear plant. The steady state exhibits negligible sustained oscillations and all the controls are within limits. The controller is able to achieve considerable decoupling between the outputs. A noise signal with the specified characteristics was added to the measurement states to assess the performance of the controller in the presence of noise. It is found that the sensor noise deteriorates the closed loop system performance. This can be attributed to the nonlinearities present in the model and the relatively high gain of the noise in the low frequency range. Therefore, robustness of the closed loop system with respect to the measurement noise needs to be improved and is a part of our future research.
Airspeed (u) 167.02
8058 8056 8054 8052 8050 8048 8046
(m/s.)
h (meters)
Altitude (h) 167 166.98 166.96 0
50 Time (sec.)
166.94
100
0
50 Time (sec.) δelevator
100
0
50 Time (sec.) δaileron
100
0
50 Time (sec.)
100
0.1 4.2 (deg.)
(normalized)
Thrust (T)
0.095 0.09
4 3.8
0 −5
x 10
50 Time (sec.) δrudder
100
15
0.2 (deg.)
10 5 0
0.1 0 −0.1
0
50
100
Figure 22. Nonlinear model response to a 10m step command in Altitude. For actuators, dashed - control command, solid - actual output
28
Altitude (h)
Airspeed (u) 172 (m/s.)
h (meters)
8046.8 8046.6 8046.4
170 168
8046.2 0
20
40 60 80 Time (sec.)
100
120
0
40 60 80 Time (sec.)
100
120
4.5
0.2 (deg.)
(normalized)
0.25
20
0.15
4
0.1 0.05
0
50 100 Time (sec.)
3.5
150
−4
4
50 100 Time (sec.)
150
50 100 Time (sec.)
150
−3
x 10
4
x 10
2 (deg.)
2 0 −2
0
0 −2
0
50
100
150
−4
0
Figure 23. Nonlinear model response to a 5 m/s step command in Airspeed. For actuators, dashed - command, solid - actual
29
IX.
Conclusion
It was determined that by constructing the model in Simulink yielded many benefits, which ranged from a clarity in the flow of information to an increase in team efficiency. The block diagrams allowed the flow of information to be clear. This helped in the design and debugging portion of the project. The block diagram architecture also allowed the tasks required to complete the project to be divided into subsections, which made it possible to assign each subsection to different team members. This division of tasks allowed each team member to work independently and thereby making the team more efficient. It was concluded that the ARES aircraft was unstable in the longitude and laterally. This was determined by analyzing the aerodynamic data provided. These instabilities were also found by calculating the eigenvalues of the A and B matrices . These instabilities were also seen in the simulation of the nonlinear model. However, the instabilities were overcome by implementing a control system into the aircraft. By analyzing the aerodynamic data it was shown that the ARES aircraft would need to operate at a speed of 167 m/s or 145 m/s to achieve maximum range or maximum endurance respectively.
Acknowledgments We would like to thank Mathworks for providing valuable information in form of tutorial sessions and correspondence. We would particularly like to thank Matt Jardin for organising this workshop and answering technical questions throughout the competition.
References 1 M. Guynn, P. Gelhausen Norella M. Croom, R. Parks, and Gecheng Zha. Evolution of a mars airplane concept for the ares mars scout mission. San Diego, California, United States, 2003. 2 Liz Callanan Matt Jardin and Alfred C. Watts. Model-based Aerospace Challenge #1(MACH-1)2007-2008 Undergraduate/Graduate Team Competition. 3 MATLABr Documentation. www.mathworks.com/access/helpdesk/help/techdoc/matlab.shtml. 4 H. Schaub and J. Junkins. Analytical Mechanics of Aerospace Systems , 716 pp. Reston, VA : American Institute of Aeronautics and Astronautics, c2003., 2003. 5 Jr. John D. Anderson. Introduction to flight. Boston : McGraw-Hill, c2000., 4th edition, 2000. 6 Dr. Jan Roskam. Airplane Flight Dynamics and Automatic Flight Controls. Lawrence, KS : DARcorporation, 1995., 2003. 7 Dr. Jan Roskam. Airplane Design, Part 6:Preliminary Calculations of Aerodynamic, Thrust and Power Characteristics. Ottawa, Kan. : Roskam Aviation and Engineering Corp., 1985., 2000. 8 Sanjay Garg. Robust integrated flight/propulsion control design for a stovl aircraft using h-infinity control design techniques. Automatica, 29(1):129 – 145, 1993.
30
Appendix
CL vs. α
CD vs. α
1.2 1 0.8
CY vs. α
0.4 Mach=0.6 Mach=0.7 Mach=0.8 Mach=0.9
0.35 0.3
1 Mach=0.6 Mach=0.7 Mach=0.8 Mach=0.9
0.5
Mach=0.6 Mach=0.7 Mach=0.8 Mach=0.9
0.25 CY
CL
CD
0.6 0.2
0
0.4 0.15 0.2
0.1
0 −0.2 −10
−0.5
0.05 0
α [deg]
10
0 −10
20
0
Cl vs. α
α [deg]
10
−1 −10
20
Cm vs. α
1 Mach=0.6 Mach=0.7 Mach=0.8 Mach=0.9
α [deg]
10
20
Cn vs. α
0.2
0.5
0
1 Mach=0.6 Mach=0.7 Mach=0.8 Mach=0.9
0.1
Mach=0.6 Mach=0.7 Mach=0.8 Mach=0.9
0.5
Cn
Cm
Cl
0 0
0
−0.1 −0.5
−0.5 −0.2
−1 −10
0
α [deg]
10
20
−0.3 −10
0
α [deg]
10
20
−1 −10
0
α [deg]
10
20
Figure 24. Plot of aerodynamic coefficients vs. angle-of-attack at different Mach numbers
31
CL vs. β
CD vs. β
0.4
CY vs. β
0.08 Mach=0.6 Mach=0.7 Mach=0.8 Mach=0.9
0.35
0.05 Mach=0.6 Mach=0.7 Mach=0.8 Mach=0.9
0.07
Mach=0.6 Mach=0.7 Mach=0.8 Mach=0.9
0.04 0.03
0.06 CY
CD
CL
0.02 0.3
0.05
0.01 0.04 0
0.25 0.03 0.2 −10
−5
x 10
0
0
0.02 −10
5
−5
Cl vs. β
−3
5
β [deg]
−0.01
β [deg]
0
−0.02 −10
5
Cm vs. β
Mach=0.6 Mach=0.7 Mach=0.8 Mach=0.9
0.1
0
5
0
5
0.01 Mach=0.6 Mach=0.7 Mach=0.8 Mach=0.9
0.005
Mach=0.6 Mach=0.7 Mach=0.8 Mach=0.9
0 Cn
Cm
−5
β [deg]
Cn vs. β
0.11
0.09 Cl
−5
0.08
−0.005
0.07
−0.01
0.06
−0.015
−10
−15 −10
−5
β [deg]
0
5
0.05 −10
−5
β [deg]
0
5
−0.02 −10
−5
β [deg]
Figure 25. Plot of aerodynamic coefficients vs. sideslip angle at different Mach numbers
32
Cm vs. α 0.4
Cm
0.2
0
−0.2
−0.4 −4
−2
0
2
4
6 α
8
10
12
14
16
CL vs. α 1.2 1
CL
0.8 0.6 δdrvs=−20 [deg]
0.4
δdrvs=−8.5 [deg]
0.2
δdrvs=0.0 [deg]
0
δdrvs=10 [deg]
−0.2 −4
−2
0
2
4
6 α [deg]
8
10
12
14
Figure 26. Plot of CL and Cm vs. angle-of-attack at different control deflection
33
16
CL vs. α
Cm vs. CL
1
1
0.8
0.8
0.6
0.6 CL
1.2
CL
1.2
0.4
0.4
0.2
0.2 δdrvs=−20 [deg] δdrvs=−8.5 [deg]
0
0
δdrvs=0.0 [deg] δdrvs=10 [deg] −0.2 −5
0
5
10 α [deg]
15
−0.2 0.4
20
0.2
0 Cm
−0.2
−0.4
Figure 27. Plot of CL vs. angle-of-attack and CL vs. Cm at different control deflection
34